


 are recording the largest daily outflow of funds in history")


TradingView extends your trading history. Up to 187 years back!

TradingView, a popular service offering access to quotes and charts of financial instruments from around the world, announced an important update on historical data. From now on, platform users will have access to very distant quotes. For some instruments, it is more than ... 100 years!
Read: Chart history extension on MT4 and tick data from Dukascopy
TradingView with a long history of price quotes
Changes in the availability of quotes on the charts include both selected stock indices and joint-stock companies, as well as the commodity market, and even Bitcoin. For US indices S & P 500 or the Dow Jones 30, price data includes over back. In the case of IBM or Coca-Cola stocks, it is over back. The longest history is available on precious metals - for gold it is and for silver as much as .
The following are examples of instruments with a Quote Start Year on TradingView:
- Dow Jones Industrial Average (ticker: DJI) - chart history from 1896
- S & P 500 (tick: SPX) - chart history from 1871
- Gold (tick: GOLD) - chart history from 1833
- Silver (tick: SILVER) - chart history from 1802
- Petroleum (tick: USOIL) - chart history from 1861
- Coca-Cola (tick: KO) - chart history from 1968
- Exxon (tick: XOM) - chart history from 1968
- IBM (tick: IBM) - chart history from 1968
- JP Morgan (tick: JPM) - chart history from 1969
- Bitcoin Index (tick: INDEX: BTCUSD) - chart history from 2010
To access the charts, simply enter the appropriate symbol (ticker) in the TradingView search engine.
To get started, enter any of the following symbols into the TradingView search box, e.g. GOLD, USOIL etc .. Then select resources and open a chart. Extended History is available for Source Quotes "TVC".
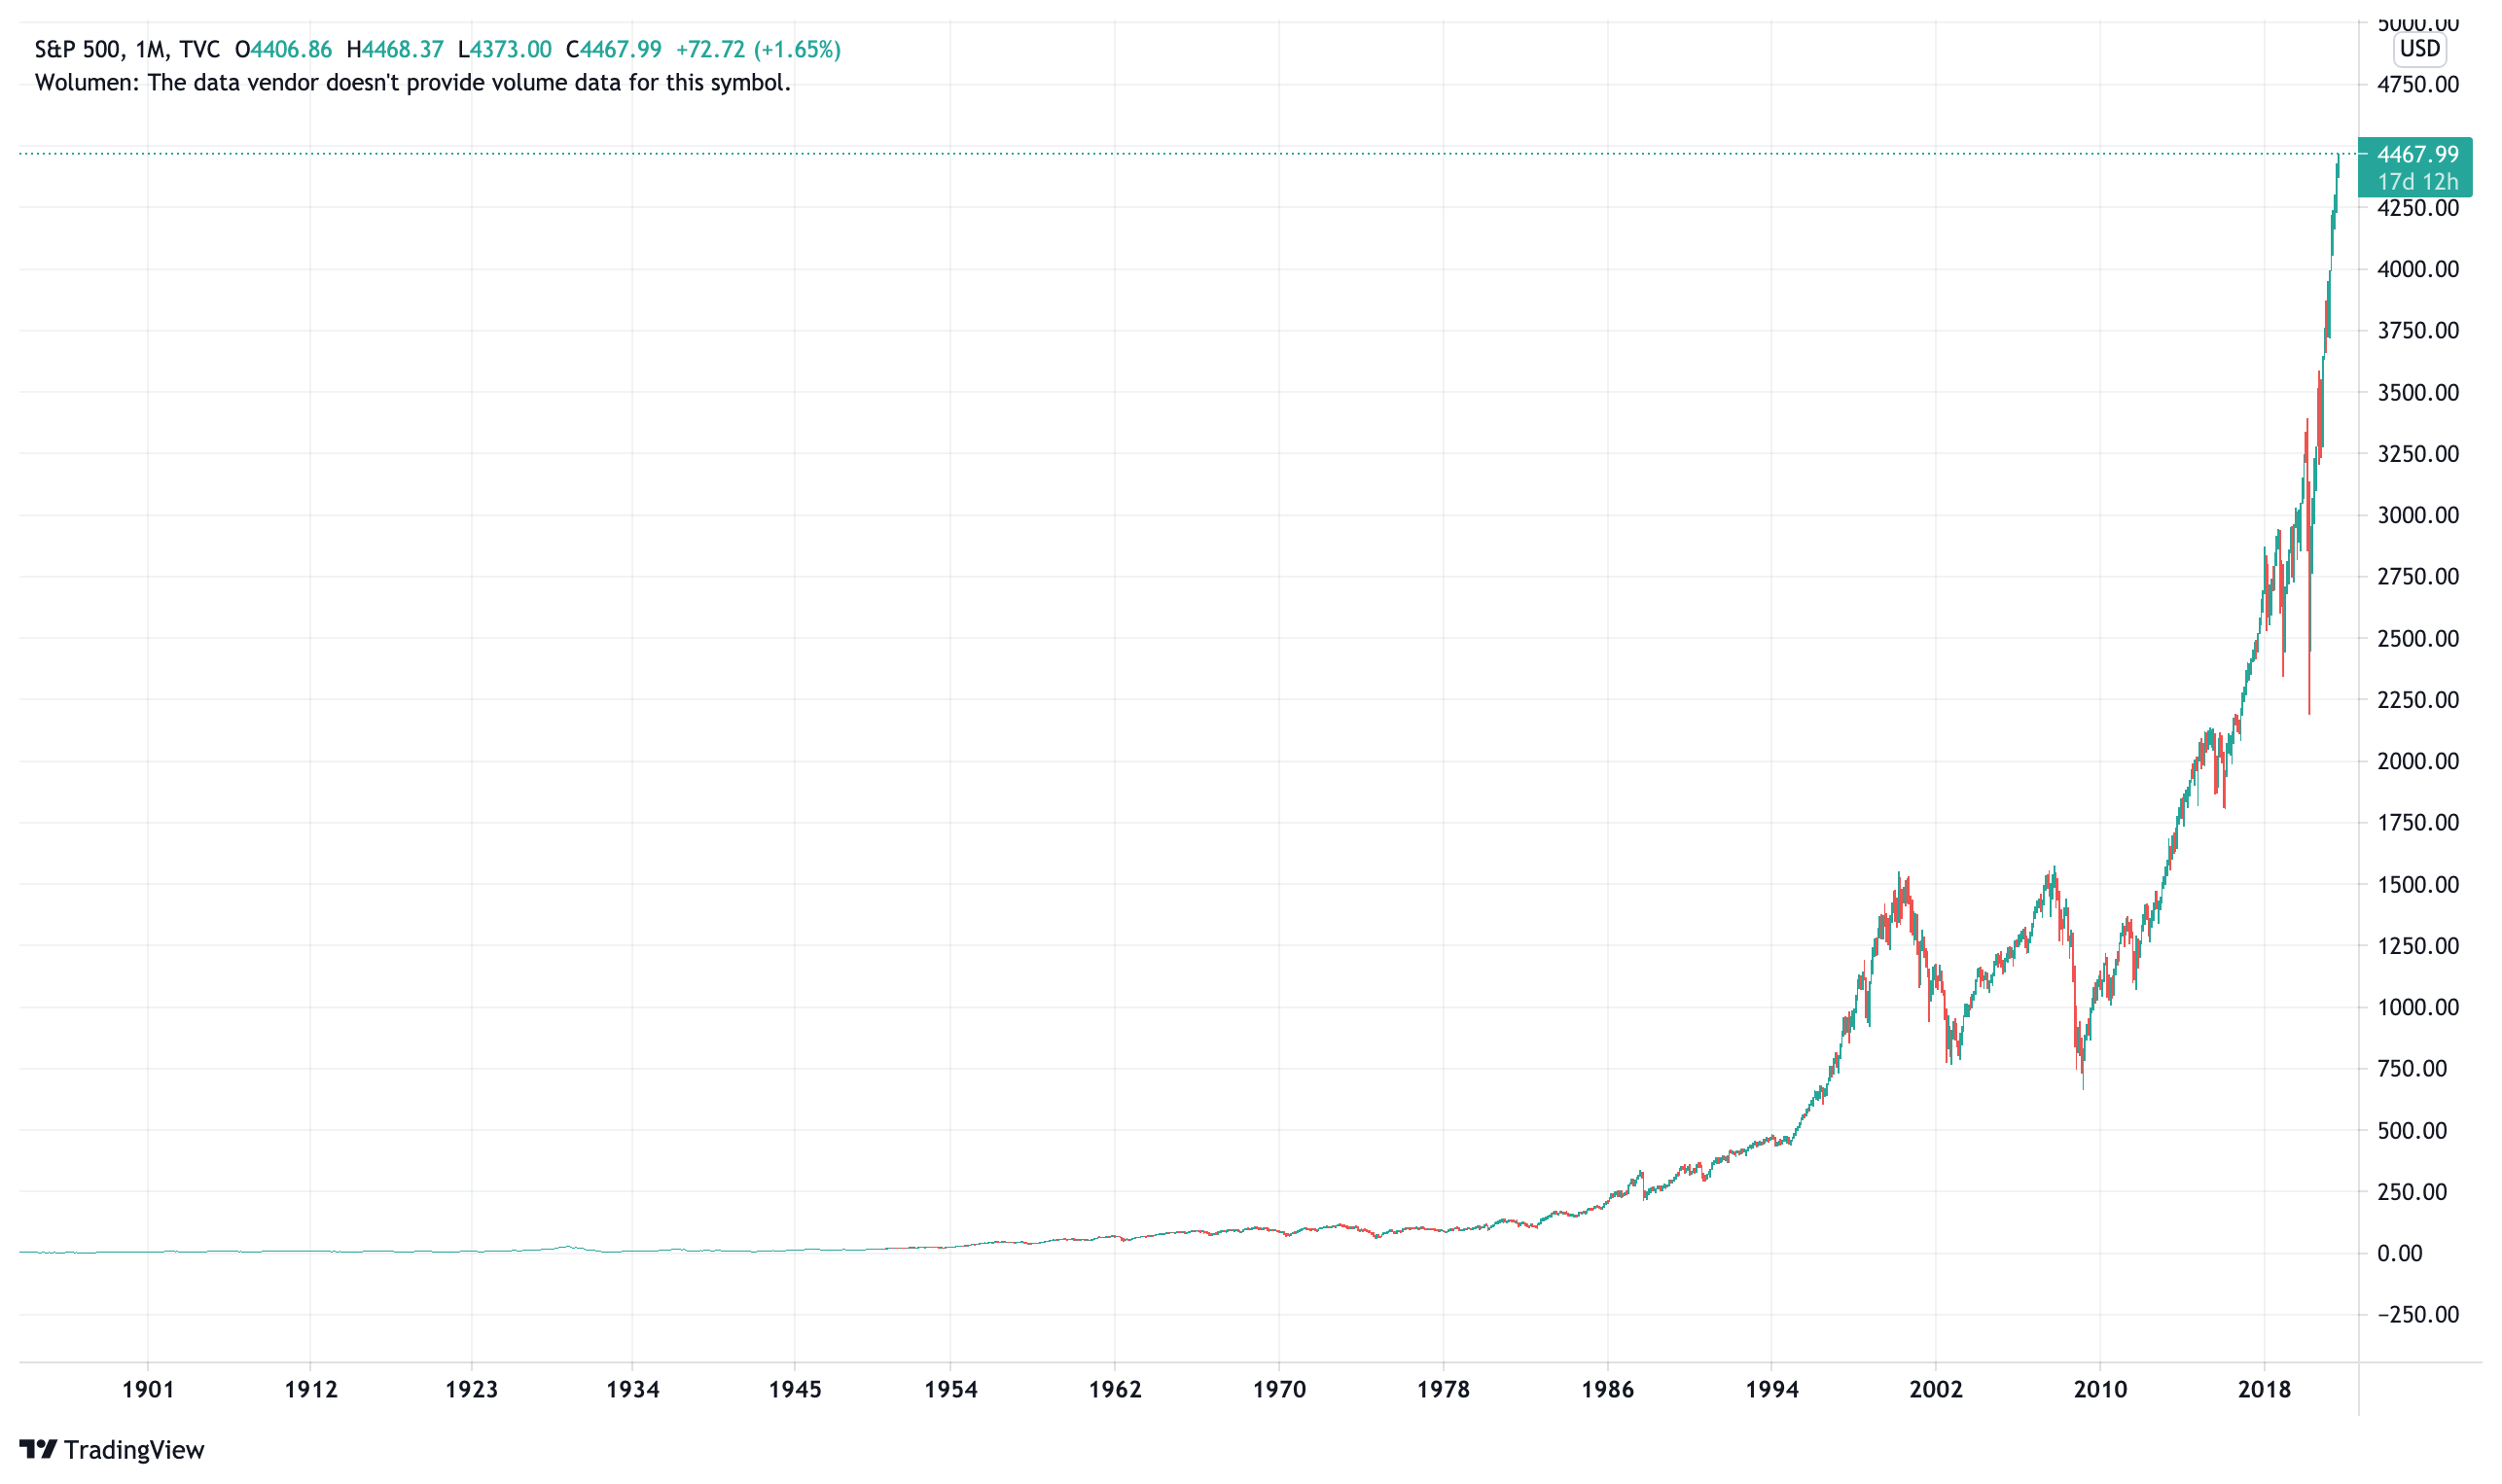
CFD chart on the S&P 500 index since 1871, 1M interval. Source: TradingView


Leave a Response