


The Trading View platform is a groundbreaking application in the investment world. Pbrought about a great revolution in the industry and gained a lot of supporters. Why did this happen? In short: it's a really good product, with interesting features and a lot of useful options. It is reliable, fast, available in many versions, including the browser version, which works really brilliantly. Additionally, it has elements of a social platform. If you haven't had the opportunity to become more familiar with Trading View yet, please read on. We were pleased to review it for you and present our conclusions below.
The company's history
TradingView (TV) was founded in 2011 by Konstantin Ivanov (CTO), Denis Globa (CEO) and Stan Bokov (COO) in New York. At the initial stage, it was intended to be primarily a platform for exchanging ideas about the markets between traders. The forum, built-in chat and the ability to present your own analyzes to other investors are the foundation that was supposed to distinguish TV from other similar websites. The platform quickly spread its wings after signing the contract with Microsoft and the Chicago Mercantile Exchange (CM extension) – and only 2 years after the start of the project. It all went downhill from there. In May 2017, TradingView was recognized as the top analytics platform at the 2017 Benzinga Global Fintech Awards, and in 2021, the company was valued at nearly $3 billion.
According to data on the TV website, the platform is used by over 50 million users from around the world. This spectacular success shows that a trader's life does not end with MetaTrader, and other platforms can successfully compete with it.
Trading on Trading View
The Trading View platform is usually used for the previously mentioned analyzes and sharing your ideas with the trader community - as it was originally designed by its creators. This is also due to the fact that until recently relatively few brokers allowed trading using it. But that's starting to change. More and more companies are integrating commerce with TV, which opens up new opportunities. Recently, a broker decided to take such a step FP Markets. We checked how to connect your account to the Trading View platform and it turned out to be very simple and quick - you can read more about it in the article How to connect your FP Markets account to the Trading View platform [Guide].
Educational partner – FP Markets with a commission discount of up to -30%
![]()
The FP Markets broker is a partner of the Forex Club website. Our Club Members receive up to: -30% lower spreads i -25% lower commissions compared to standard rates.
Trading on TV itself turns out to be very convenient. Everything is at hand and orders come in quite smoothly, although... there is room for improvement. At times it seems that the positions appear in the order window with minimal delay, so the most demanding scalpers or day traders may have minor reservations in this respect. What could be the reason for this delay? It can be assumed that this is the result of the "path" that the order must travel. After all, when trading on Trading View, we are using a third-party platform and the broker's servers remain in-house. This is probably done on principle "copy trading", where by sending a command (e.g. to buy), the order is transferred from the platform to the TV server, and only then to the broker's server. Then from there comes confirmation of the transaction in the other direction. Longer road, longer time. But again, I think it still works quite well. I encourage you to test it yourself on the FP Markets demo.
The most important functionalities of the platform
So let's move on to what made Trading View win the hearts of users. The number of functions is really huge, so in this review we decided to focus only on selected, most interesting ones that make the TV stand out from its competitors.
Trading View in many versions
Let's start with the fact that the platform is available in both versions websites (browser) as well as i desktop with (installation). In the case of the former, all popular browsers are supported, and in the case of the installer, popular operating systems, i.e Windows, Mac and Linux. It is worth noting here that the choice of version and operating system do not change the functionality of the platform - we have the same tools available in each of them, which is rare. Of course, mobile versions are also available iOS and Android.
Design and interface
Transparency and intuitiveness. This is how the platform looks in two words. Everything is quite logically arranged and after just a few minutes most users will easily navigate the platform. On the top bar we have chart support in the form of selecting the interval, type of data presentation, alerts and indicators, while on the left side there are drawing tools available. By default, a window for concluding transactions appears on the right side, but we can "detach" it from the main window and move it wherever it is convenient for us.
Additionally, in the upper left corner, under the first letter of our name, there is a configuration menu where we can change things such as the colors of the entire platform (light/dark), the language (as many as 20 are available) or the keyboard shortcut configurator (can be defined well above 100 different actions).
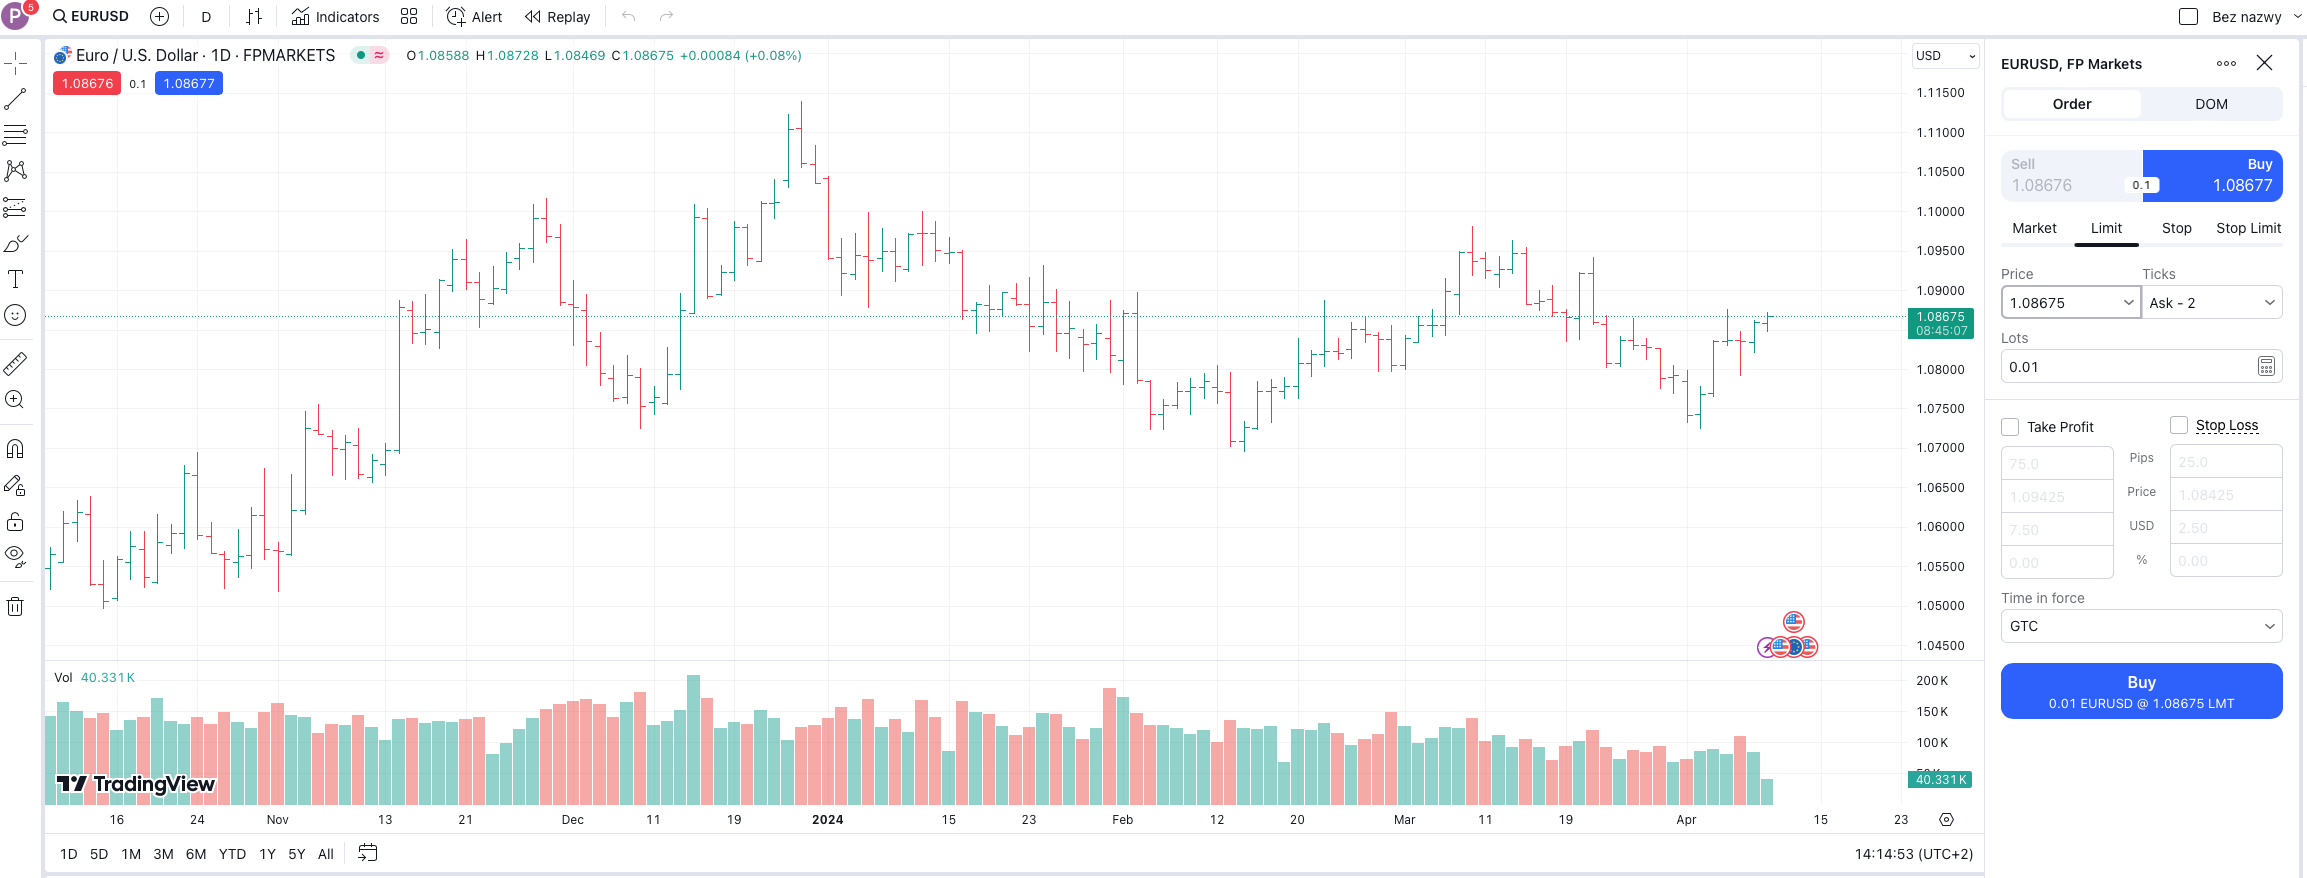
Main platform window (click to enlarge). Source: Trading View
Charts, indicators, strategies, tools
The platform is equipped with a huge number of tools. There are as many as 18 types of charts available - from the well-known candlestick or bar charts, through the relatively popular Range Bars or Renko, to niche ones such as Kagi or step charts. There are also dozens of various AT indicators, ready-made investment strategies, profiles with prepared charts and the so-called patterns, i.e. tools for automatic detection of specific formations on the chart. And all this as standard, without downloading files from the Internet or looking for which folder to put them in.
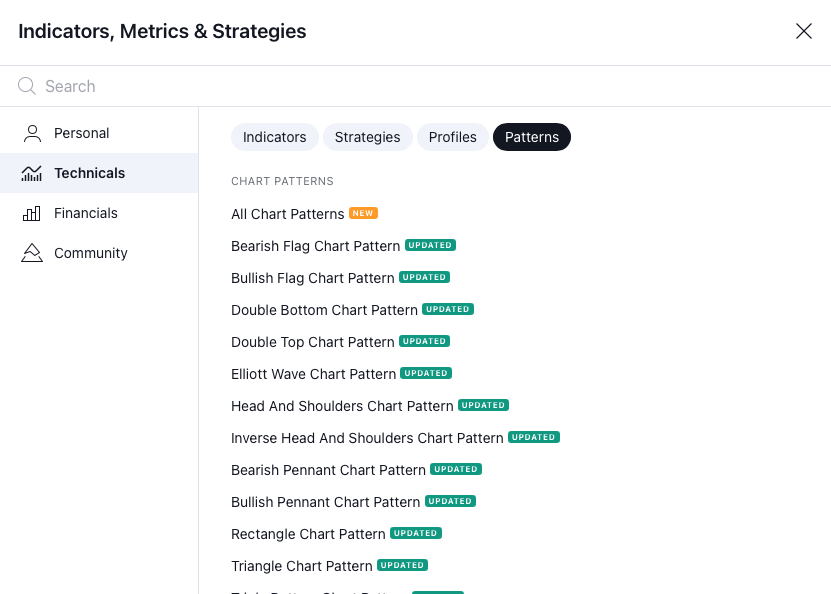
Tools for detecting patterns on charts. Source: Trading View
But it is not everything. You can also use the tools created by the trader community. In the bookmark Community you will find hundreds of different indicators that are available for free.
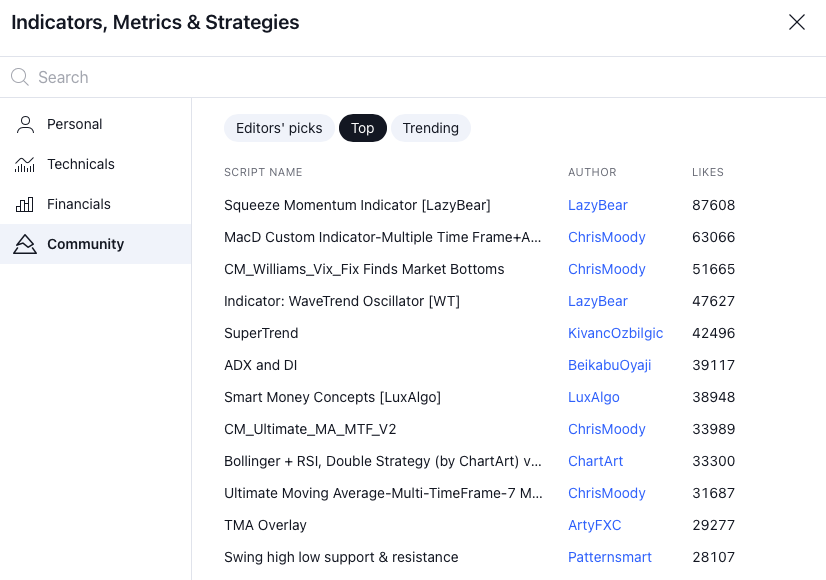
Tools provided by the platform community. Source: Trading View
Of course, this is not the end. Users also have a whole arsenal of charting tools at their disposal. In the left toolbar you will find functions such as 11 Fibonacci tools, 4 Gann tools, projections, various lines and sections, tools for neatly selecting elements on the chart, dozens of icons, brushes and objects. The biggest problem is finding your way around it all, but after a while and testing these functions, you will easily find your way around using them. And you won't regret it.
Length of historical data
It is worth mentioning how long historical data is available to users in a separate paragraph, because it is truly impressive. While MetaTrader 4 users are often looking for high-quality historical data, because the standard data available on the platform is often desperately short, on Trading View we have, for example, access to BTC quotations from the very beginning, i.e. since 2010, Nasdaq since 1985, USDJPY since 1971 or McDonald's shares since 1968.
Market scanners
It is true that the scanners are not part of the platform itself and are available directly on the website, but they are worth mentioning. This is a tool (available under the tab Products), which allows you to efficiently filter a mass of assets at one time. They are divided into: stocks, ETFs, currencies and cryptocurrencies. Their greatest usefulness certainly concerns the first two. If you are looking for e.g. ETF, which has exposure to copper, just select from the tab Center -> copper and that's it! Looking for the largest Asia-Pacific ETF? You choose Region and again – you get the result. ETF with a dividend yield greater than 5%? No problem - two clicks and you're done. Googling is not necessary. It's really super comfortable.
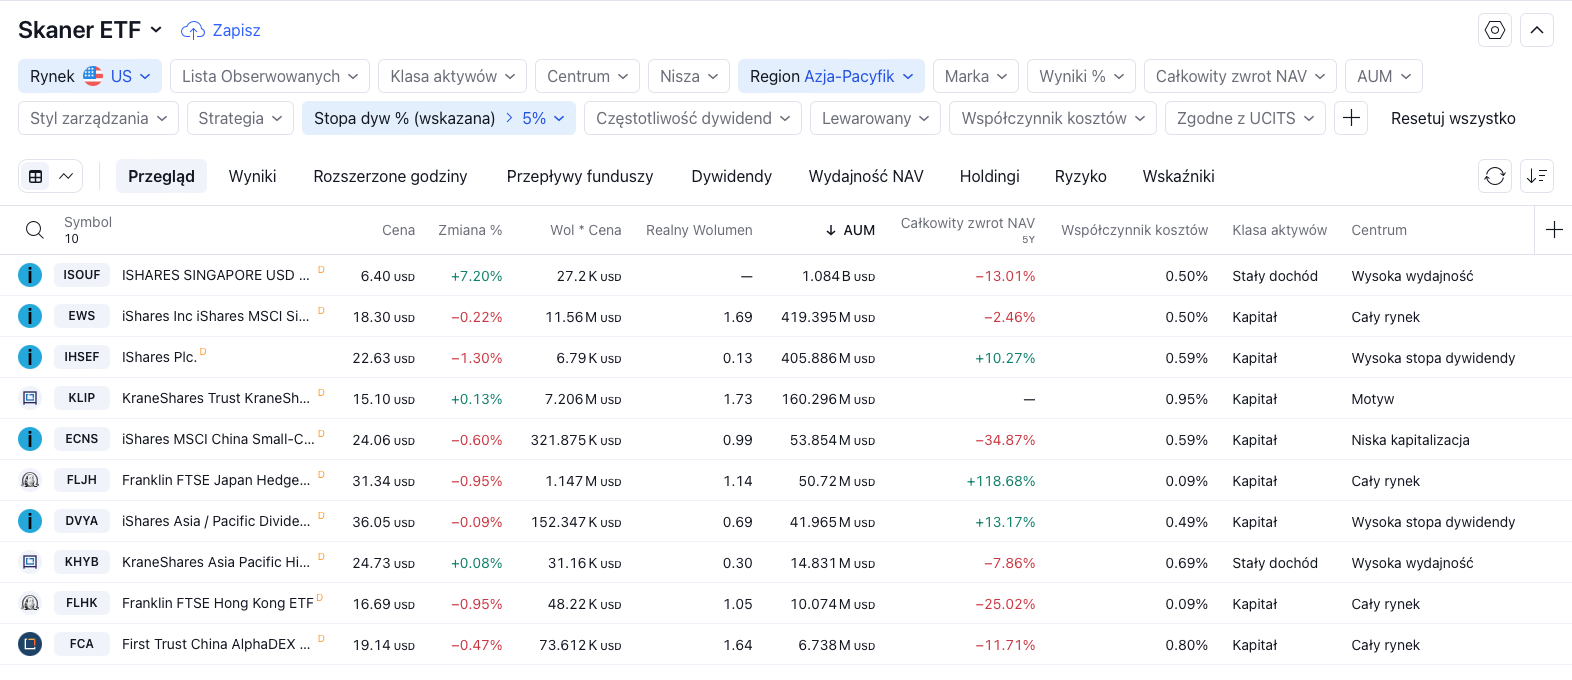
ETFs with dividends above 5%. ETF scanner. Source: Trading View
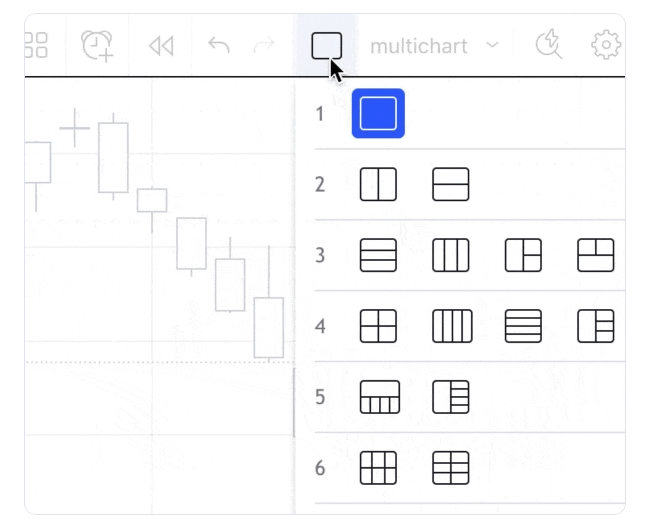
Multi-chart mode
A very convenient option for quickly arranging charts in the platform window. It seems like an obvious option, which most platforms have (even MT4 :)), but it must be admitted that it was simply done better here and as a result we have a lot of interesting configurations to choose from. Unfortunately, this option is only available in the paid plan.
Playing candles
An option that you may have already seen in other applications (e.g. Forex Test). Candlestick replay allows us to go back in time and recreate the market at any pace so we can test our ideas and analyze our strategies. You can define it as a kind of trading simulator. Useful, especially for beginner traders. It is available on the top toolbar under the entry "Replay".
Comparing charts
More than one instrument on the chart? Yes. But it's possible even on the old MetaTrader 4 (of course, after downloading a dedicated indicator 😀 ). So why is this worth mentioning? Well, because we can express the comparison of the instruments we choose in another currency, e.g. Chilean peso, Polish zloty or... cryptocurrency (even a niche one). Thanks to this, we can take into account the changing purchasing power of given instruments. Simply brilliant.
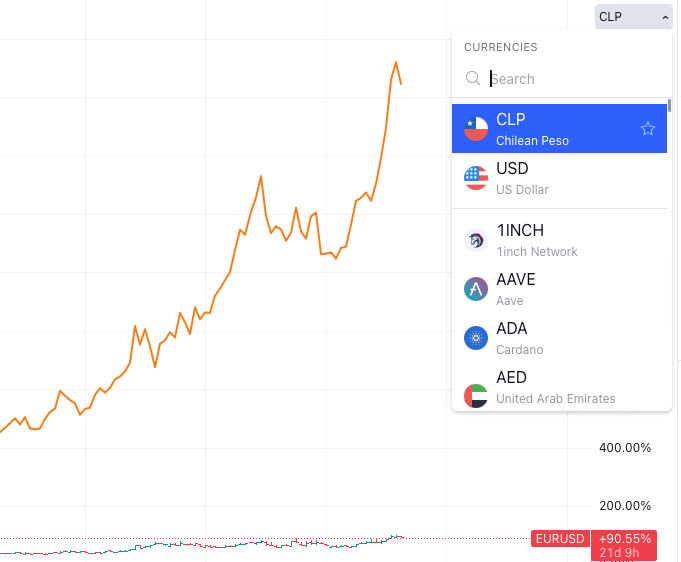
Comparison of charts expressed in the currency (or cryptocurrency) of our choice. Source: Trading View
Concluding orders
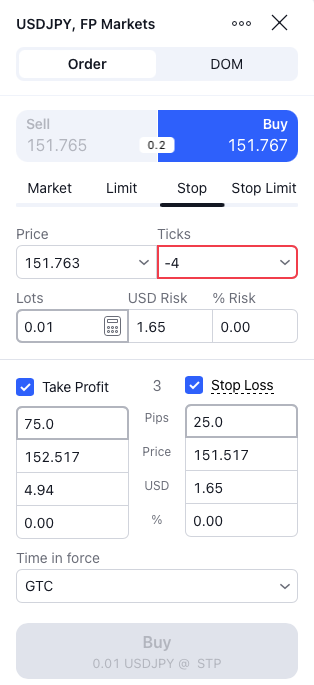
Module for placing orders. Source: Trading View
There are no spectacular options here, but they are not needed either. However, there is transparency, order and intuitive operation with calculated basic values (pips, price, profit in USD and account %). Watch and learn MetaQuotes! 😉
World News
Again, a module that is available directly on the TV website and deserves your attention. News is a tab where we can find aggregated news from the world in our language, divided into many categories. This allows you to quickly find information about a given region or market, without having to browse many websites on the Internet. The news comes from several leading contributors, mainly Reuters. Access is free for everyone.
timelines
In December 2020, TradingView launched Timelines, which maps the history of public companies to their share price in the market. This is a very nice presentation of the most important events from a given company on its chart. For example, for Tesla the places when a new car model entered the market, when the CTO was fired or the moment of publication of quarterly results are marked. Thanks to this, traders can easily see what impact a given piece of information had on the price of a given asset. Once again – bravo! Unfortunately, this option is only available in the paid plan, but you can see what it looks like in the video from Trading View here.
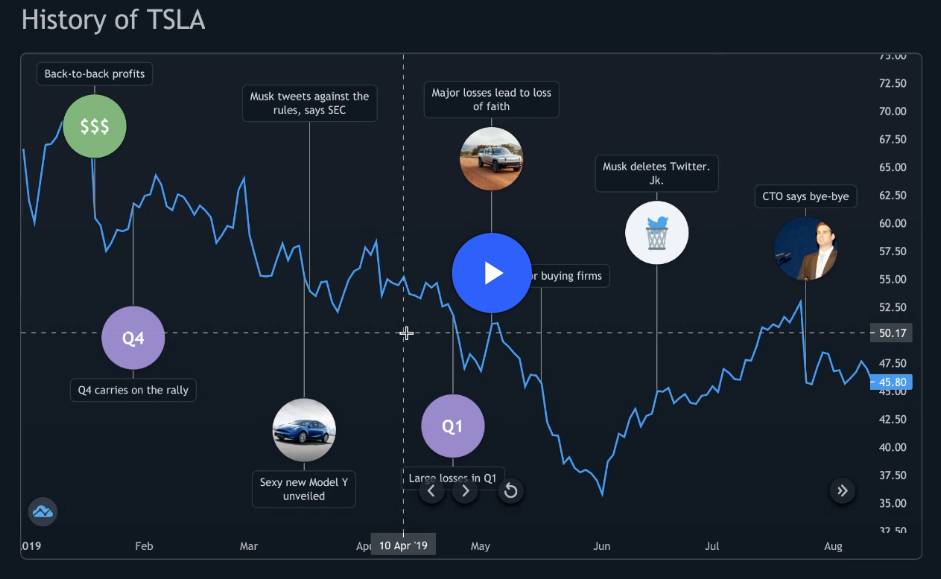
Timelines based on the example of Tesla shares. Source: Trading View
Trader community
The exchange of trading ideas and investment strategies has been a core pillar of Trading View from the very beginning. It was the social element that was supposed to distinguish this platform from other charting applications. But it all went further than we expected. Currently, users can communicate via Live Chat and create thematic groups there. They can also share their ideas (with the possibility of updating them later depending on the development of the situation) and draw inspiration from other investors. But that's not the end. There's even an option available Live Streaming, which allows users to view market analysis, ideas and charts in real time along with other users of the platform. Additionally, traders can share theirs here educational content, proprietary indicators, scripts, ready-made strategies, and even libraries (for developers). The programming language used is PineScript.
Little? Don't worry, this isn't the end. They are organized periodically konkursy with cash prizes, e.g. The Leap regarding the so-called paper trading with a main prize of PLN 10. USD.
It is not our place to judge the substantive level of the analyses, discussions or live shows, but the possibility of choosing and establishing relationships with traders from all over the world within the trading platform is truly amazing.
Paid subscription as an option
Trading View comes in several versions. Basic is free but obviously, it has access to limited features and ads are displayed on it. This can be considered a disadvantage, especially since the Forex platform market has accustomed us to their "free" nature. But let's remember that TV is more than just that Forex i CFD. These are also cryptocurrencies and the Futures market, where in the case of futures contracts, access to advanced platforms is usually paid.
In addition to the basic version, there are also Essential, Plus and Premium versions available, the price of which ranges from $180 to even approximately $700 per year in the version for "non-professionals". A lot of? Little? It depends on how you look at it, but you can certainly grab a bargain and reduce the cost of your subscription by up to -70%, making a purchase during the promotion period (e.g. Black Friday, Easter, Christmas), especially if we decide to pay the entire amount in advance. Of course, in the free version you can still trade freely and analyze charts, although your options are limited (e.g. there are not so many types of charts, indicators or access to interesting tools).
Access to data without delays also involves fees, although this is a result of the policies of specific exchanges (unless access to data is not provided by our broker). For example, for access to shares on NASDAQ, NYSE or WSE we will have to pay $36 per year (you can take advantage of a resident discount in the case of a stock exchange in our country). In total, we have as many as 70 stock markets + 24 futures markets.
Payments can be made using a credit/debit card, Apple Pay, PayPal or cryptocurrencies (there are as many as 9 to choose from).
Summary: The competition is left behind
Above I described only the most important functionalities of the platform, because it is impossible to discuss all of them. Therefore, I strongly encourage you to check the TV yourself with its full trading capabilities (e.g. on the FP Markets demo account). TradingView is a comprehensive platform suitable for both market analysis and investing. It looks great, works very well and offers a whole lot of useful functions. It does not discriminate against its users based on their browser or operating system. In addition, it constantly focuses on dynamic development, thanks to which users receive new options and possibilities. In addition, a great added value of the platform is its community, thanks to which we can gain knowledge and ideas from other traders, as well as exchange our own thoughts and strategies with them.
But it is not everything. Trading View is constantly developing. New options, tools, markets and opportunities are added regularly. Comparing the dynamic development of this platform with market leaders such as MetaTrader or cTrader, I immodestly believe that TV has long left them behind, and the only drawback is the small base of brokers supporting trading with its participation. And this is slowly changing too... Disadvantages? Practically only two. The paid versions can be relatively expensive for some, and the basic one doesn't deliver the numbers you need "groundbreaking" options. Additionally, if we want to trade on Trading View, it is very likely that our broker does not support this platform and the choice is narrowing. But this is slowly changing and this trend is likely to continue. My rating is 9/10.
| Advantages | Disadvantages |
| Available in web and desktop versions (Windows, Mac, Linux) | Access to all features is available only in paid plans |
| Very clear interface | Relatively few brokers to choose from |
| Brilliant market scanner (primarily for stocks and ETFs) | The number of functions may be overwhelming at first |
| Huge number of chart drawing tools | Timelines only available on paid plan |
| A community that influences the development of the platform | |
| Impressive length of historical chart data |
Your Partner in Education
![]()
Investments in OTC market instruments, including currency exchange rate (CFD) contracts, due to the use of the leverage mechanism, entail the possibility of incurring losses exceeding the value of the deposit. It is not possible to make a profit on transactions on OTC instruments, including currency exchange contracts (CFDs) without risking a loss, therefore contracts for exchange differences (CFDs) may not be suitable for all investors.


Leave a Response