


Ichimoku's backstage strategy - Grzegorz Moskwa

Ichimoku's strategy of recent times has become very popular among traders, which clearly testifies to its effectiveness. However, not many people know that what we know as Ichimoku is only part of the overall strategy developed by Goichi Hosoda.
Be sure to read: Fundamentals of Ichimoku strategy
In non-Spanish literature, virtually no one mentions it. Therefore, based on Japanese e-books, webinars and, above all, on the book of Mr. Hidenob Sasaka, I would like to introduce these elements to Polish traders.
Ichimoku's strategy according to Grzegorz Moskwa
Ichimoku lines, i.e. tenkan, kijun, chinkou span, senkou span a and senkou span b, are the direct signal giver. Therefore, a correct interpretation of the indicator itself may turn out to be very profitable with larger trends. Many traders, however, complain about losses in a sideways trend and are looking for solutions to add other indicators that could help them avoid these types of entries. Unfortunately, these are short-term solutions, often unproven with longer tests, and quickly lead to a loss of interest in the Hosoda strategy. Unfortunately, no one knows that by using the "whole strategy" the trader's efficiency increases. What is happening on the market becomes clear and predictable. Of course, this is not a glass ball but only technical analysis assumptions that perfectly describe the market.

Hosoda, in addition to five lines, also created three theories-principles of market behavior. It is a theory of waves, wave range and cyclicality, and time on the market. It is important to understand that these theories are not direct signal givers, but serve "only" to write out possible scenarios of events. If we take into account that these theories were created for charts with daily candles and they work great on these charts, then for people who usually work on H4 or H1 intervals, this is very good news. This will allow us to have an overall picture of the market situation and outlined possible price behavior scenarios. According to these scenarios, searching for signals on shorter time intervals becomes easy and effective.
Wave theory
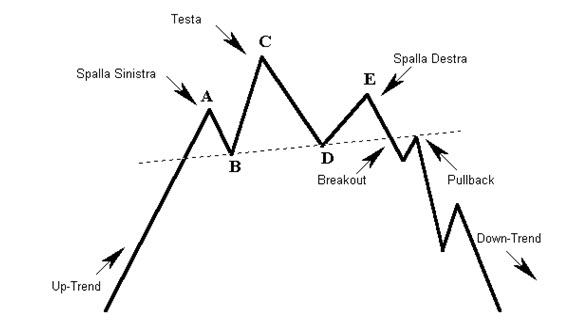
Hosoda noted, and was very proud of it, that all price movements can be "explained" by five price patterns (not to be confused with candlestick formations). For example, in Western technical analysis we have formations such as RGR:
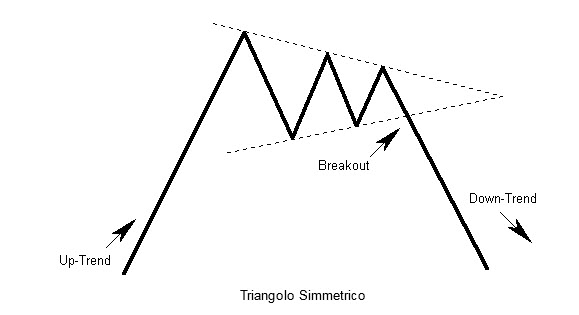
Or the price pattern of a symmetrical triangle:
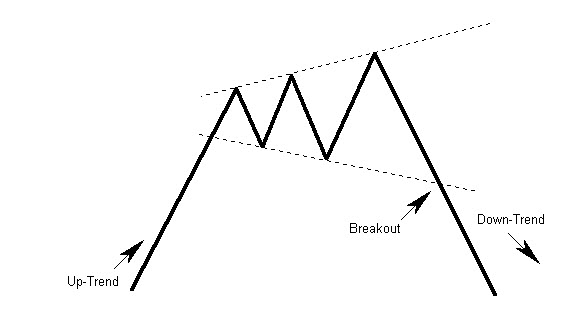
Does the expanding triangle:
Two of these formations are identical to the Hosoda wave theory:
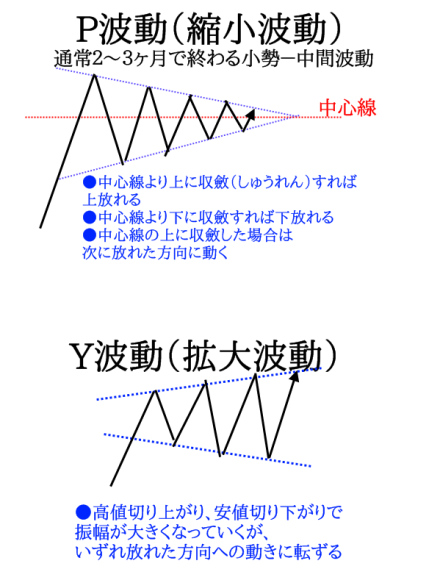
Here is a wave P and wave Y. In the theory of Hosoda waves we still have waves Iwaves N and waves V. The very theory of waves would be uninteresting, not to say banal, because the price of zigzags of various things can be seen, if not for the next two theories, the range of waves and cyclicality.
Wave range
As before, also in the technical analysis of the West we can meet with attempts to calculate the so-called "target price", eg in Elliott wave theory or based on Fibonacci levels, in the ichimoku strategy it is much simpler and indeed at the first glance (you have to practice a bit first) you can see "what is shining" and calculate with incredible precision where the price should arrive:
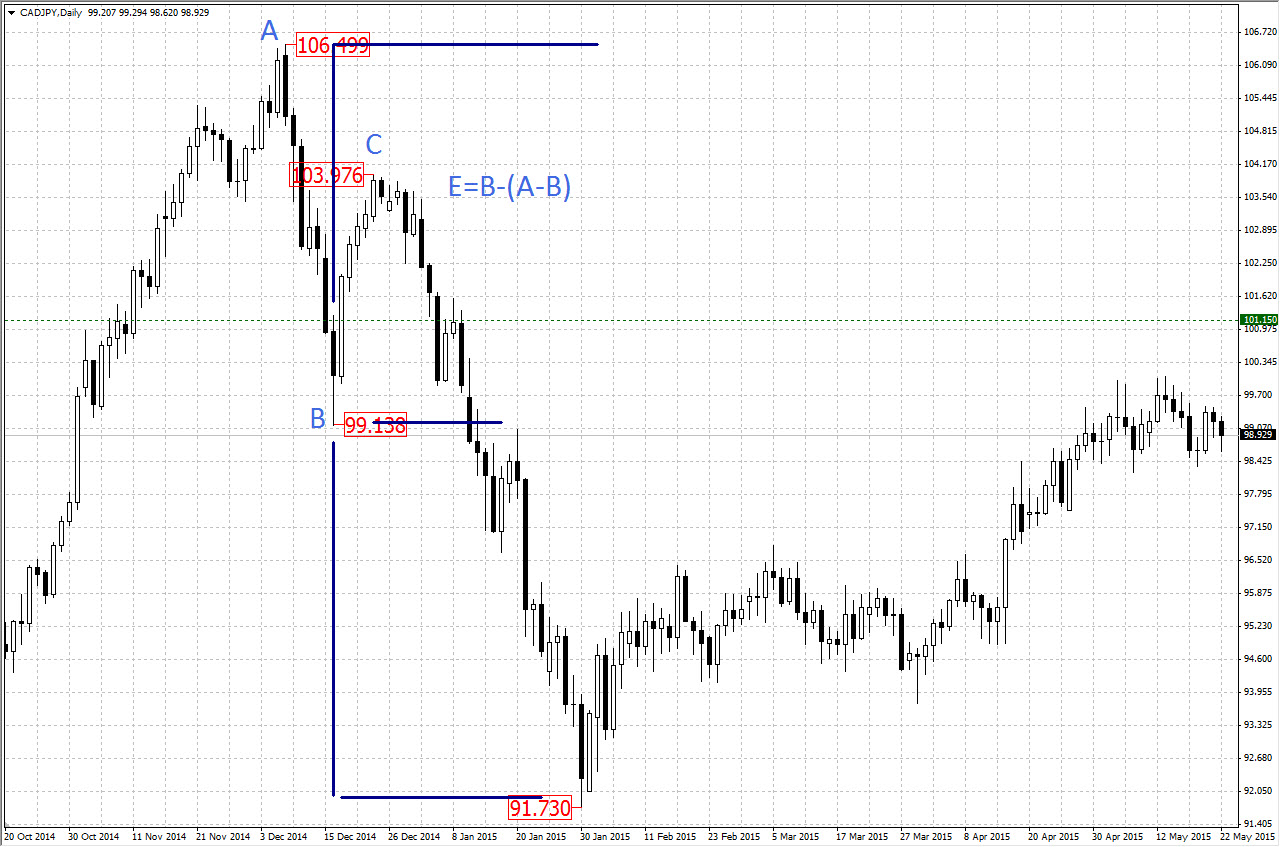
If I add to that cyclical theories (time), i.e. assumption when it should happen.
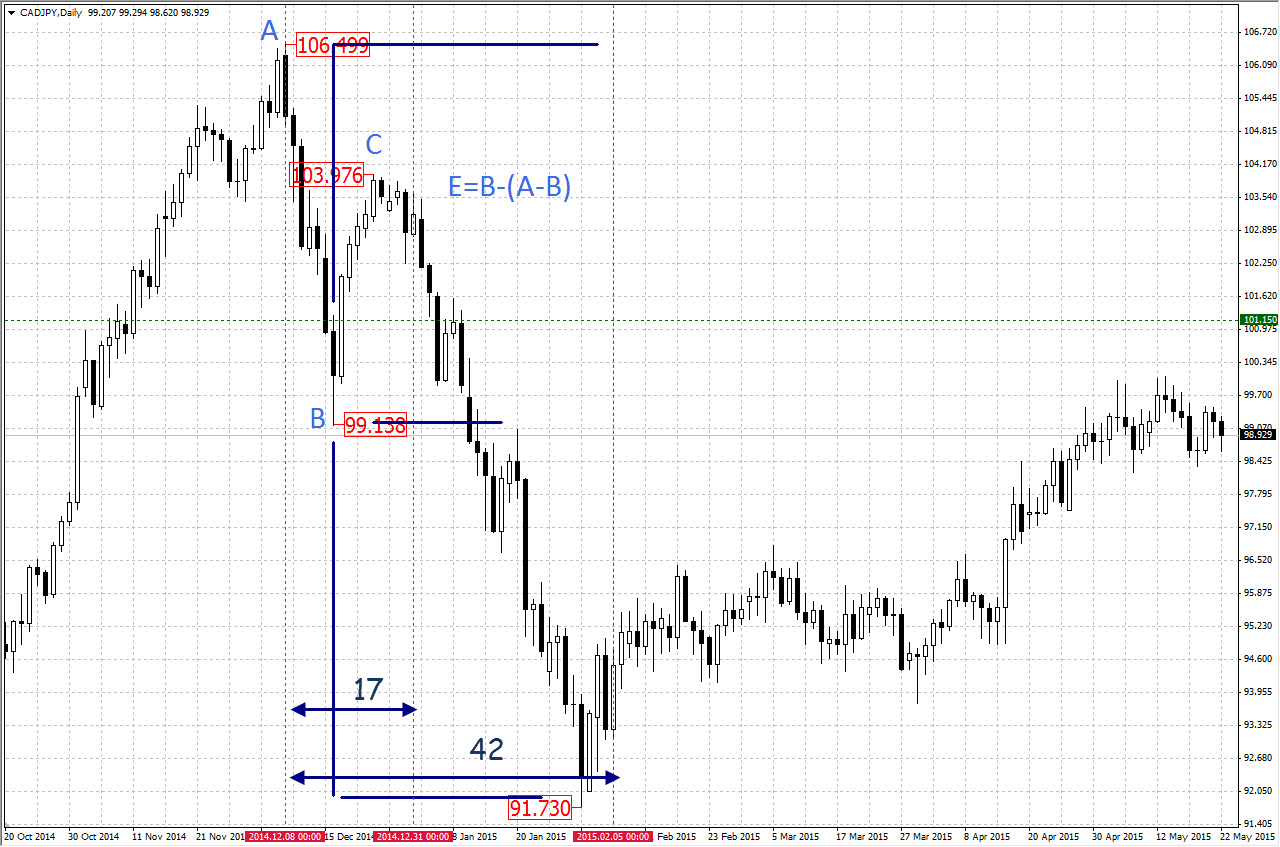
What more could you want?
Of course, these are possible scenarios for the development of the situation. There are more of them and you have to be aware of what is happening on the chart and realize which of the possible scenarios is being "implemented". And this, always bearing in mind that the final giver of the signal are the ichimoku lines.

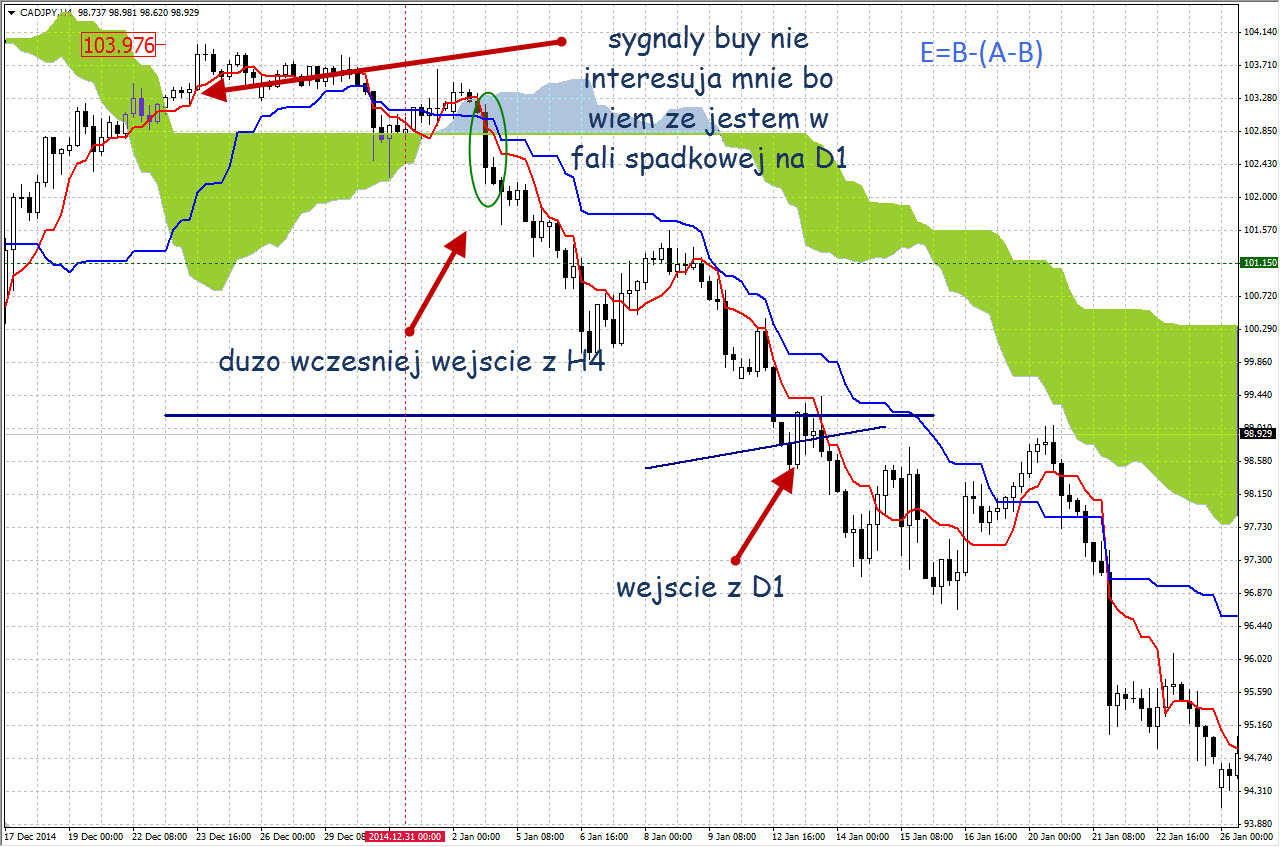
We are looking for signals on H4, which allows you to always earn several pips more:
Not to mention the possibilities it gives pyramidalhaving such instruments. Here is an example of a pair analysis EUR / GBP. There is a signal on H4, meaning a dead (a bit bad) cross under the cloud:
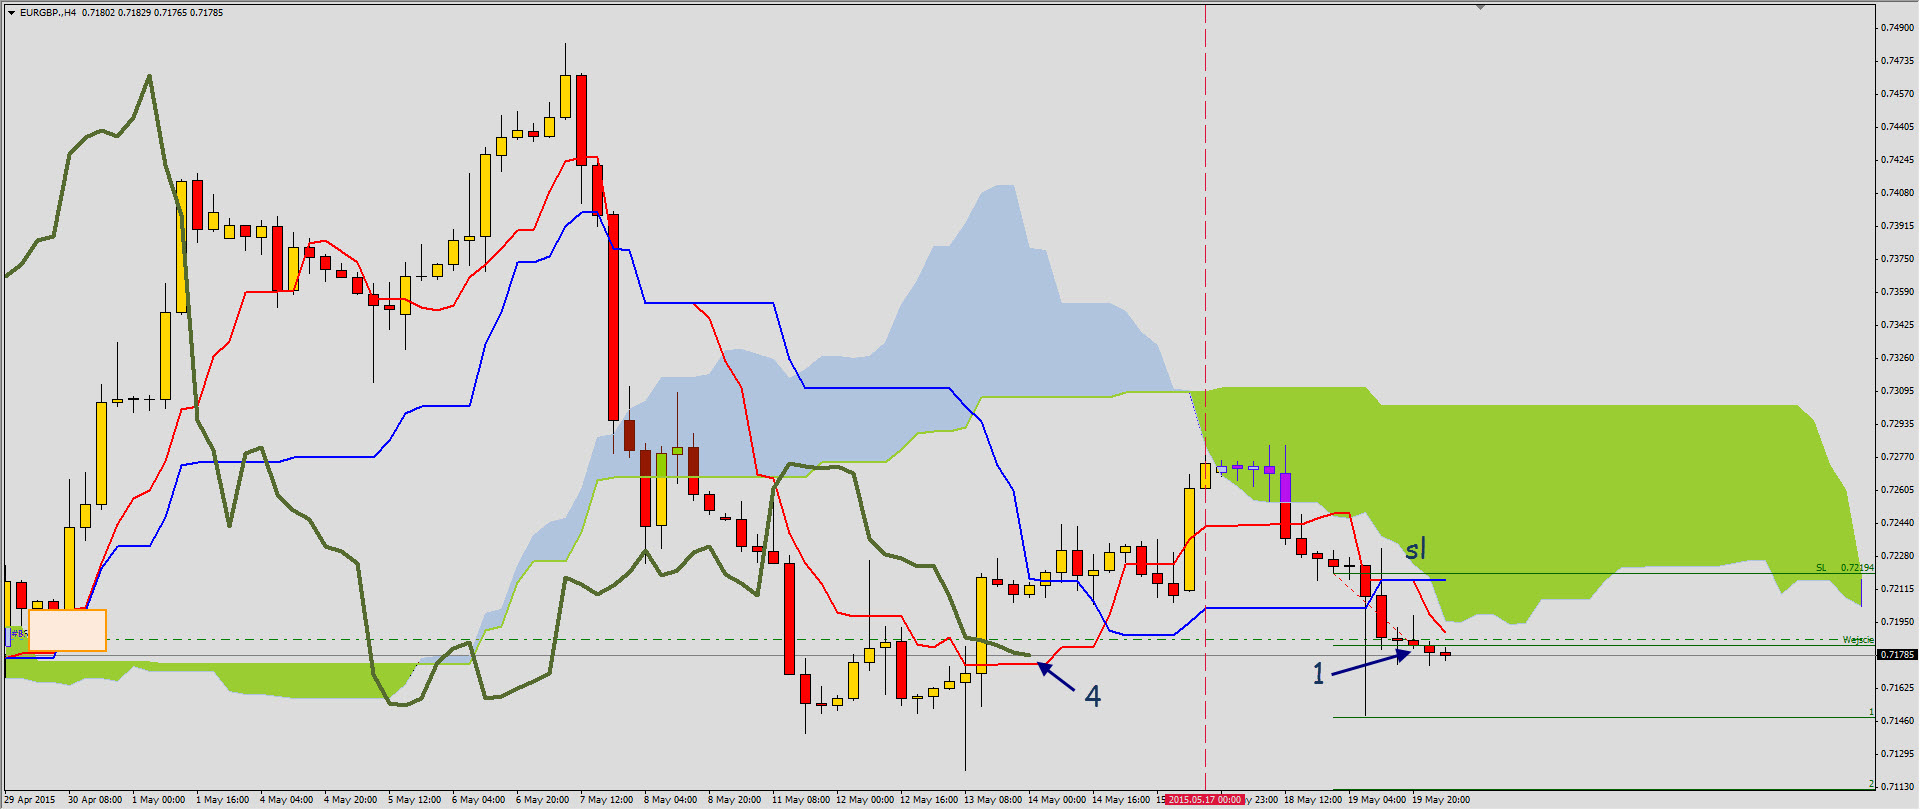
The sensible SL in this case is the closure of the candle over the stickun line. What is the situation on D1?
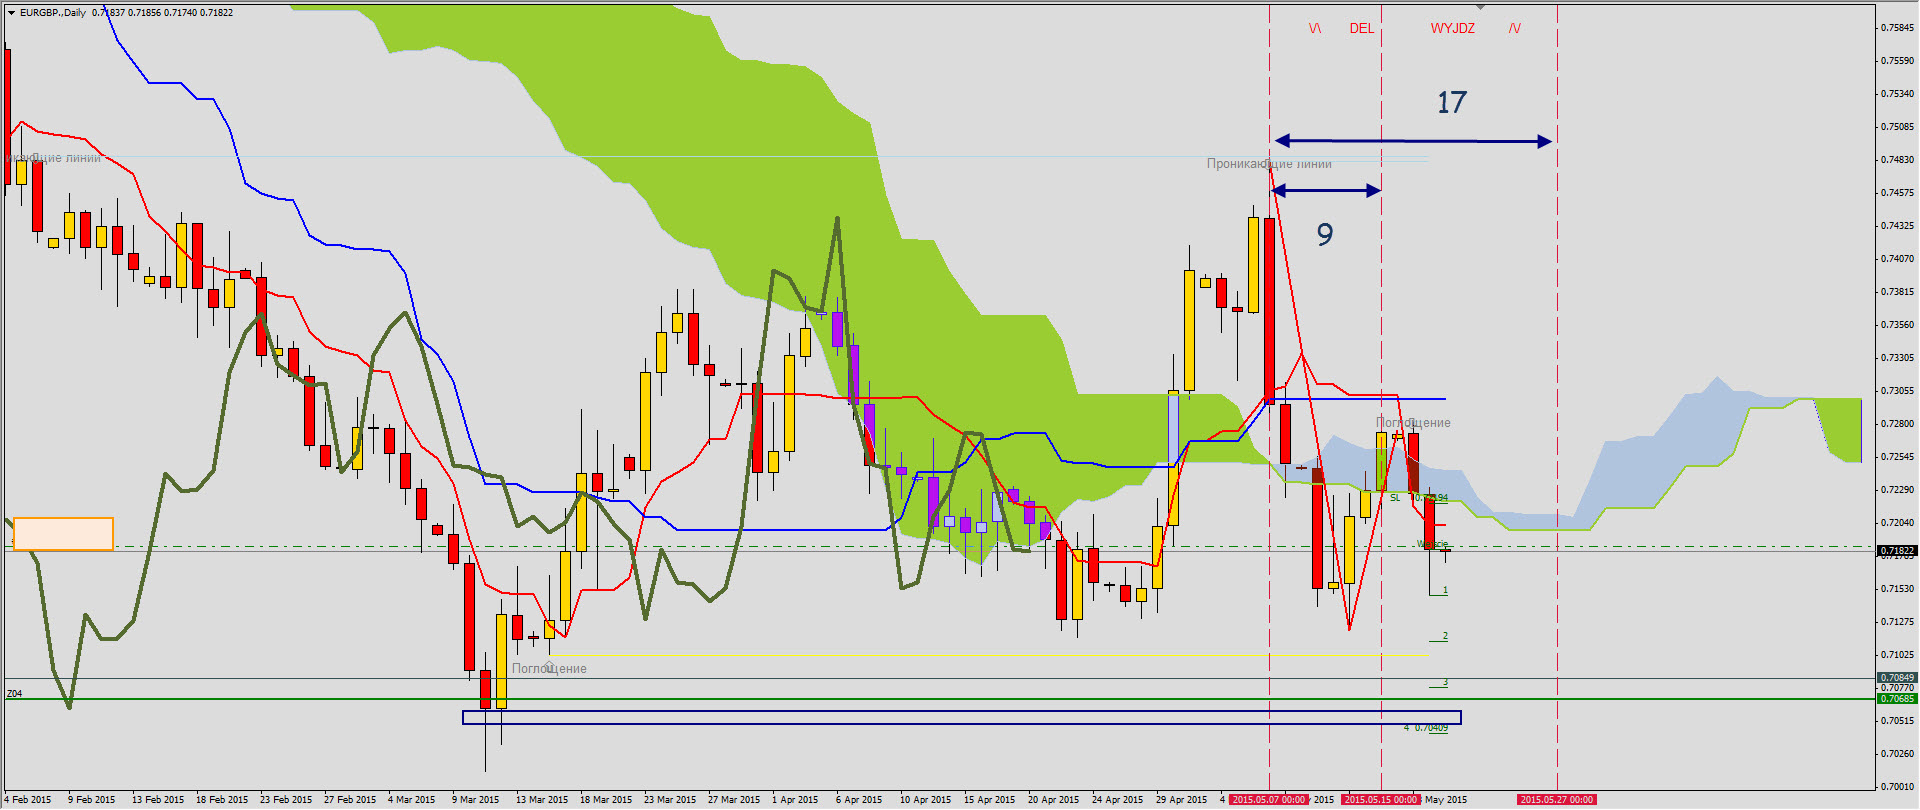
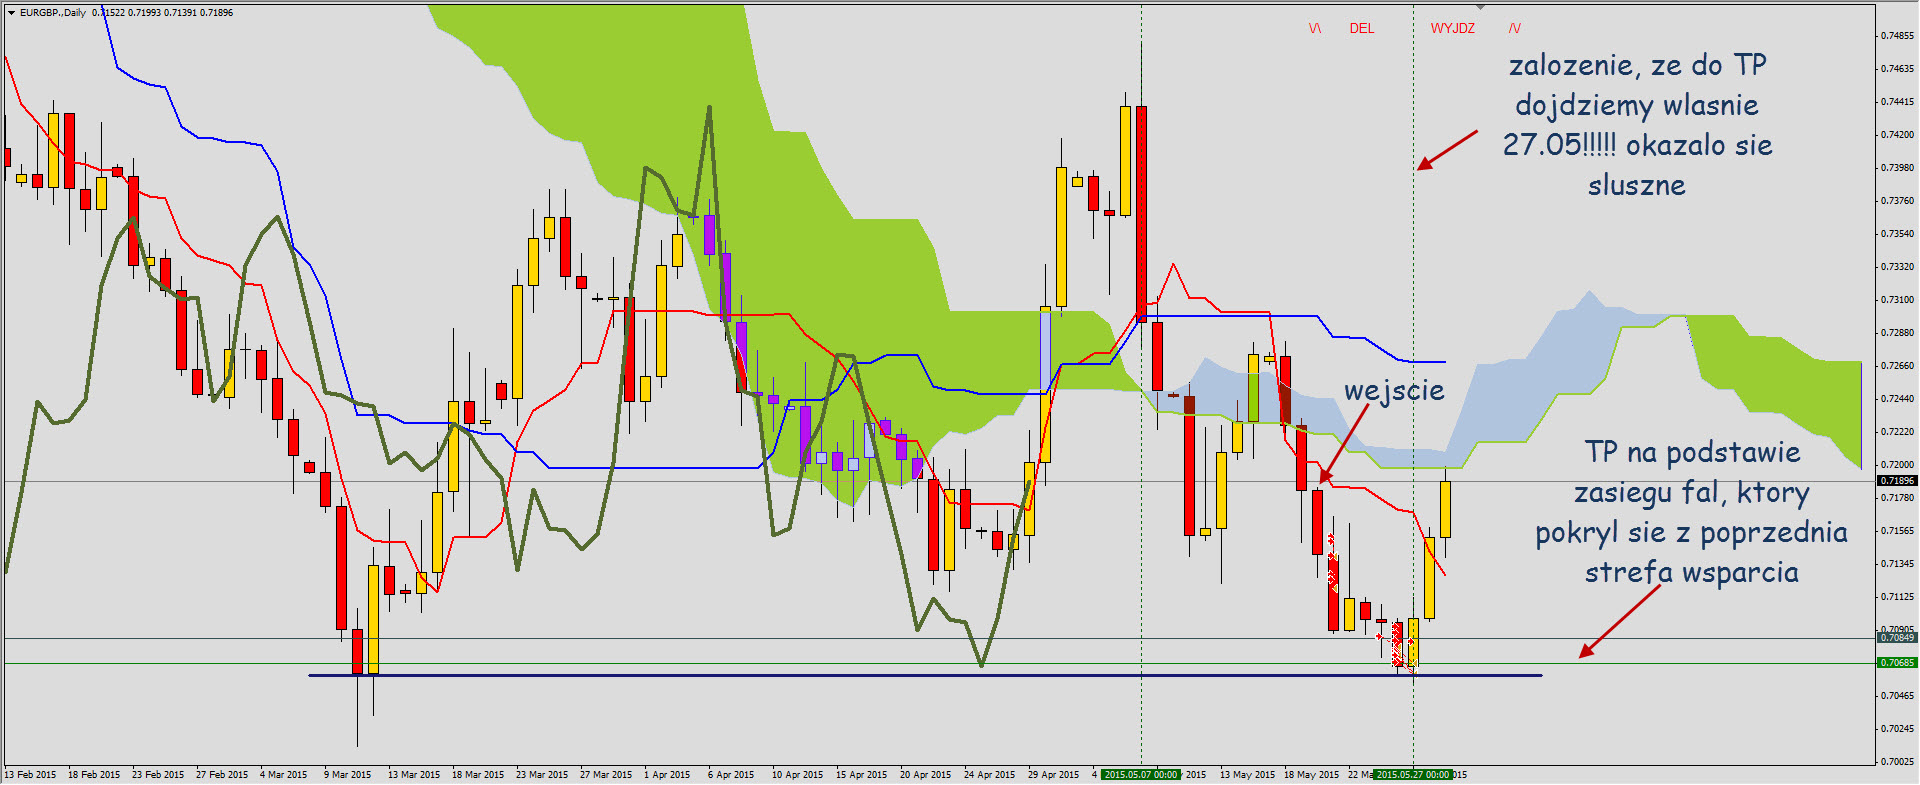
Based on the theory of the wave range we have TP (green horizontal line), based on the cycles we have a day in which we should reach TP, or 27.05, and on the basis of the ichimoku line, the chosen direction, ie the south.
And this is the situation today:
Ichimoku strategy - Summary
As you can see, knowing the whole ichimoku strategy can help a lot in "picking" the best signals, setting TP very precisely, and training patience. If I know where and when the price is to come, I am waiting calmly, observing the candles that follow the previously assumed scenario.
Author Gregory Moscow (YouTube)


Leave a Response