


 – this cryptocurrency increased in price 2024 times in 20")
 are recording the largest daily outflow of funds in history")

EUR / USD Weekly S / R - a safe and proven Forex system

The Forex system that we want to present to you today - EUR / USD Weekly S / R - is recommended, among others, by Piotr Mleczko, a trader with over 12 years of experience. In the following years of his adventure with FOREX he has already tested dozens of different strategies in real trading. Since June 2012, he has been focusing on playing the system described below - so far the title Forex system has brought him 60% profit, at a risk level of only 1% and a capital reduction of up to 6%.
How does EUR / USD Weekly S / R work?
A weekly chart for a good start. Two neighboring worlds are treated here as a system. Their size does not matter much. The most important thing is that one should be the "continuation" of the previous candle. By this we mean that the second must close above / below the level of closing the previous candle.
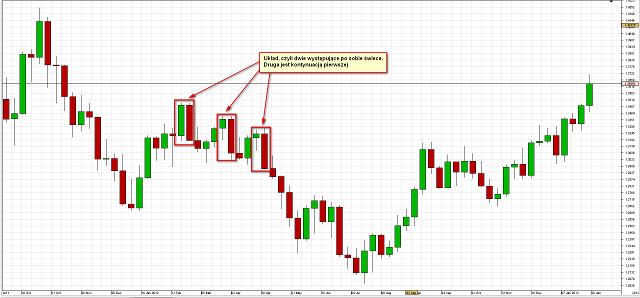
On the created in this way, I draw lines, which when adding the 20 pips buffer will constitute the area of our entry into the position. In case the number one candle has a small koprus and a long wick, the lines are put on the wick and the body of the first candle.
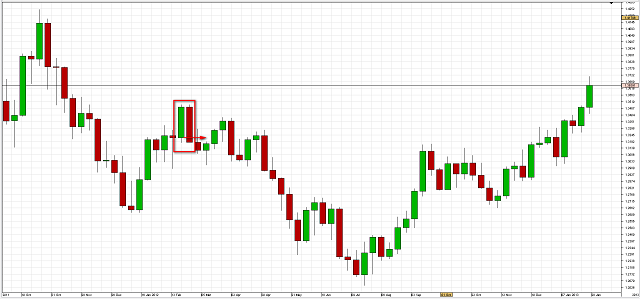
If the body and shadow of the first one is small, we put the lines on its body and in the middle of the second candle.
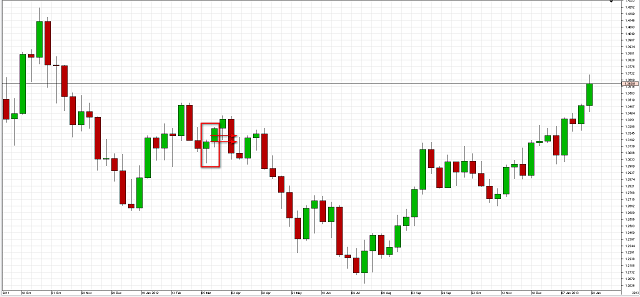
When the two candles penetrate - the size of their body is similar - the lines are put only on the body of the first one.
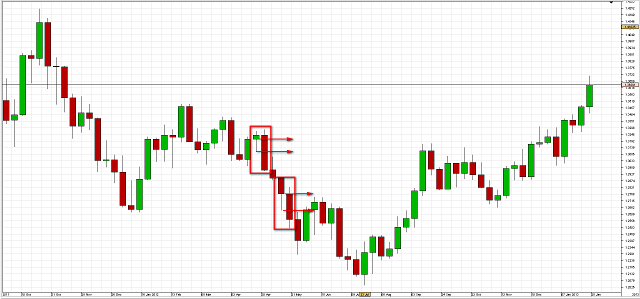
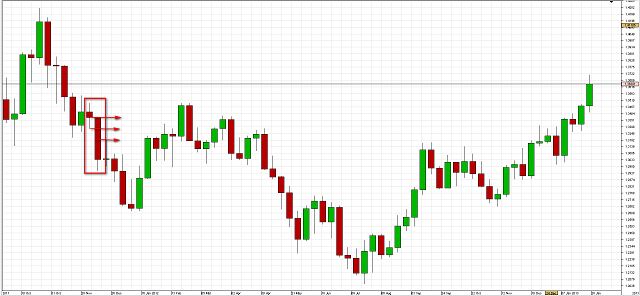
If the second candle has a long body, three lines are put. One on the body of the first candle. The second one on the shadow of the first one, of course if it exists. Third in the middle of the second candle.
Signal valid until further notice
As I mentioned before, we need to add a buffer of about 20 pips to the lines thus determined. Thanks to this, we obtain the area in which we are looking for entry into the transaction. The arrangement of two candles remains valid until it is negated. Negation takes place at the moment when one of the weekly candles closes in a downward pattern above the maximum, and in a growth system below the minimum.

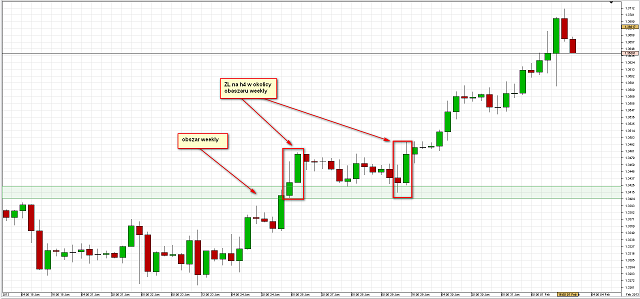
After determining the zones on the weekly chart, we switch to the four-hour chart. In the created areas - or in their vicinity - we are looking for typical systems, where the body of the second candle is at least twice as large as the previous one. The lines in these patterns are set in the same way as in weekly patterns.
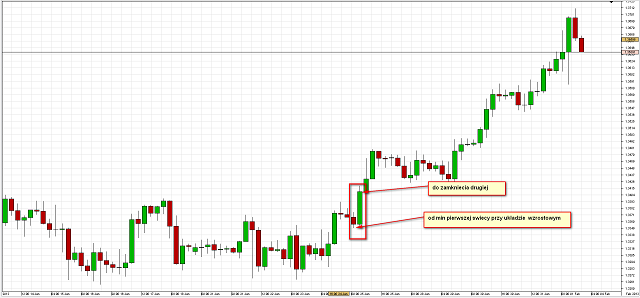
The layout on the H4 chart must have at least 30 pips. This quantity is calculated as in the following screen:
The layout on a four-hour chart is valid for about a month, unless it is previously negated. Negation looks exactly the same as in the case of weekly charts.
Position management
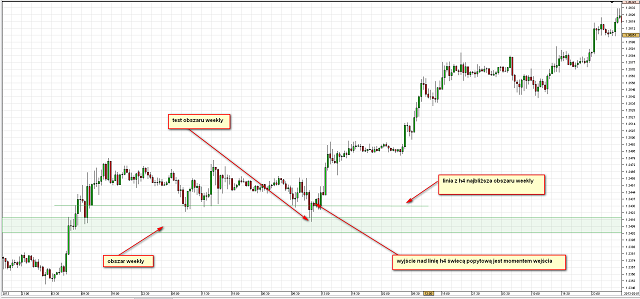
We already have a designated area for the weekly, we have a ZL system for H4. The input takes place at the 30-minute interval after the weekly zone test and the breakdown of the ZL line to the H4 demand or supply side. We always play the test and breakdown of the H4 line closest to the weekly area. The rule is that everything that is closest and the most recent has the highest priority.
Stop Loss (SL) is rigid every time and amounts to 25 pips. In the case of BE, we switch it after 50 pips. As for the moments of exit from the transaction, we can use three different solutions:
-
Take Profit (TP) constants of 250 pips.
-
The graph reaches the next weekly area - contrary to our present position.
-
If the graph stops at such BE in waves, we are in this wave and it is clear on it divergence we also close the position.
Forex EUR / USD Weekly S / R - FAQ
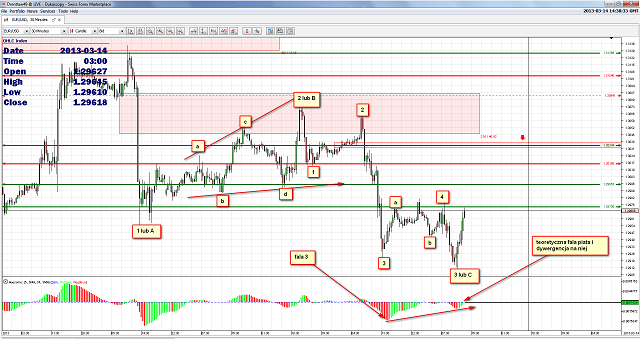
In the area of the minimum TP on the M30 chart, we mark waves. Focusing not on the exact designation but on determining the third wave. It is really simple and with a little practice it will not cause any problems to anyone.
Third waves are visible immediately. Their power is noticeable at first glance. If there are problems with their identification, it is worth looking at the AO or EO oscillators and their greatest deflection is the third wave. Then we are looking for divergence on the next wave. This can be seen in the chart below
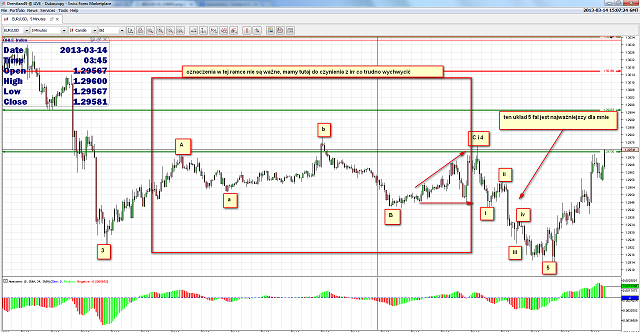
After finding the wave, we go down to the lower interval and mark the waves on the hypothetical fifth. If we observe five such waves, we close the trade (chart two).
Author Comparic.pl


Leave a Response