


Technical analysis and its predictions. The concept of convergence of candlestick chart signals.

Technical analysis of candle charts, so necessarily the analysis of individual candles is a transactional tool. We can therefore examine its effectiveness and combine it with various forms of AT (or not). It has often happened that by using several concepts or strategies based on at least 3 indicators, some generated sales signals and some generated buy signals. Contradiction and possible (desirable) convergence is the main premise of the concept of our strategy. So how do we deal with the fact that our plan for entering a position is contradictory? Why is technical analysis largely treated as a self-fulfilling prophecy? Is it worth looking for the main confirmation of our analyzes only on a "clean" chart?
Be sure to read: How to protect your deposit with a broker - Useful tips
What too much ...
This saying takes on a new meaning in the context of too many oscillators, indicators or trend lines. Often, novices wanting to test the effectiveness of all possible technical analysis methods read on the internet add what they can to the chart, hoping for increased chances of finding a good position. At first glance, there is a certain cognitive dissonance. Some say buy, some say sell, and other drawn geometrical figures indicate that we are in consolidation and it is better to wait with our order. Therefore, the question arises, what is the best way to use it to analyze a chart well and effectively? In my opinion, the chart should be primarily readable for the recipient. If we narrower our eyes colloquially speaking, trying to find 40, a drawn trend line among the other lines, you can not talk about readability. "What to use" is already a very individual matter, and the best advice that can be used here is to know the indicator that we want to add to the chart.
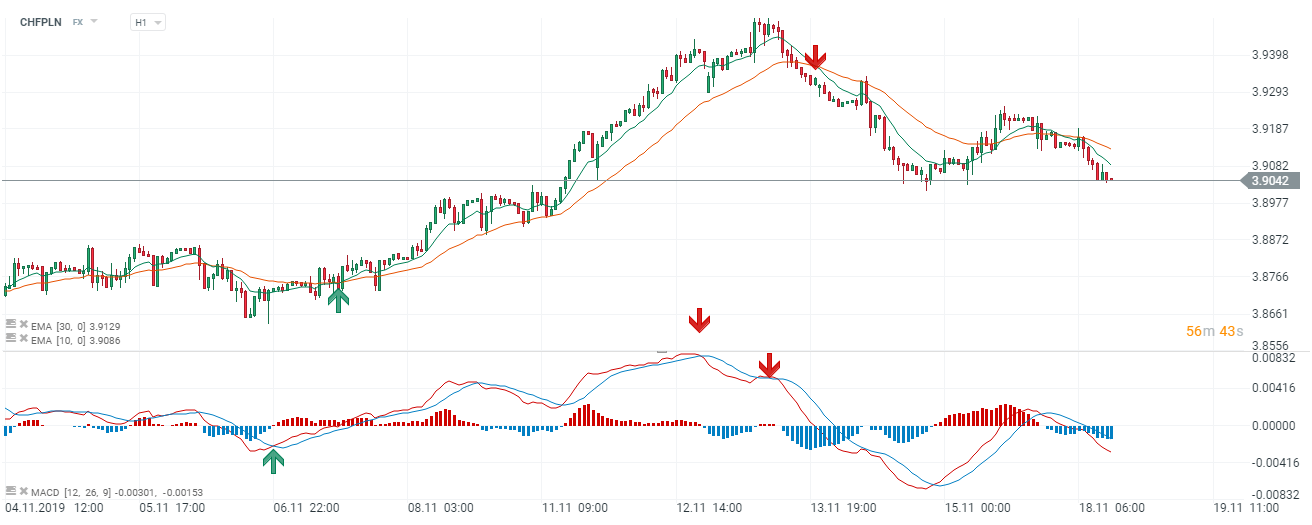
CHF / PLN chart, H1 interval. Source: xNUMX XTB xStation
An excellent example is the use of e.g. moving averages with MACD. This indicator (MACD) is actually based on averages. Therefore, it will generate the same signals (faster or delayed depending on the settings). It is completely senseless to "blur" the chart with another addition that is actually already on it. On replacing moving averages we wrote the MACD indicator in TYM article. It is worth noting that MACD generates (also depending on the average settings and the oscillator itself) a greater number of signals than the average added on the chart.
Eastern candles, western technical analysis
Bearing in mind that the candles came to us from Japan, mainly due to Nison, the approach of eastern and western chart analysis is slightly different. Reading a lot of publications in this topic shows the difference between both approaches. The Japanese are largely focused on the analysis of the candles themselves and clean charts. Steve Nison in his extensive publication on candles, he indicates that he does not recommend ignoring the tools of classical technical analysis in this kind of charts (it should be borne in mind that earlier in Western analysis they were used on bar charts).
Technical analysis of charts is primarily a tool, not a system. Observing the candles and their behavior at key moments for the market, it is better to look for confirmation of the signal generated from the classic AT than to analyze them separately, despite the use of indicators. We are based here on a simple relationship talking about obtaining greater efficiency from previous analysis.
Analyzing candles and the signals that flow from them is primarily useful for finding early signals that a trend may be reversed. They are not intended to indicate target levels to which an open order may reach.
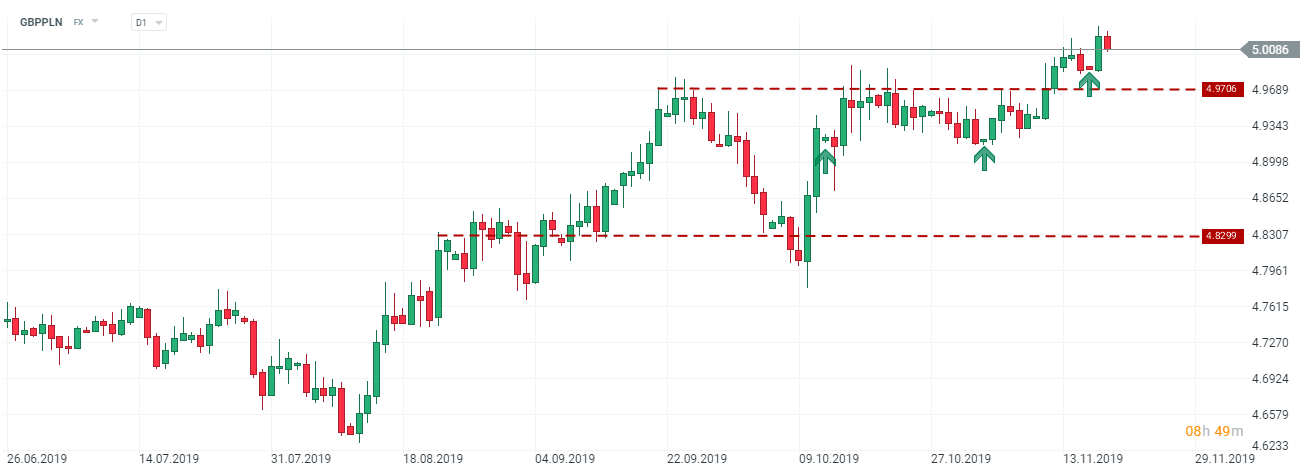
GBP / PLN chart, D1 interval. Source: xNUMX XTB xStation
Often, support and resistance are used to "measure" a range of a given trend. Candles are extremely helpful here when analyzing price behavior that is approaching a certain level. We can determine the chances and the probability of exceeding it already in advance. Therefore, candles can make a given support / resistance area credible. In the chart above, we can easily find even pin bars, which largely herald not only the "uncertainty" of the market, but more intense supply / demand movements.
Competition also benefits
I think that every reader is aware that the market and its participants are our competition. The desire to earn motivates to take actions, i.e. all kinds of analyzes. It is worth remembering (and this is no secret) that a large proportion of traders and analysts use technical analysis. How does it affect the market? To a large extent, this is a self-fulfilling prophecy. Why? Given the use of techniques that generate similar or similar signals over a given period of time, necessarily "Playing mass" concludes similar transactions that pushes the market specific direction and meets our assumptions. Of course, I'm not talking about the fact that thousands of traders with low capital control the listing. I care more about showing that large institutions with a high degree of influence on the market are also aware of what we use, which we often hear in the subject of manipulation.
Combining candle indications
The key issue in this section will be the answer to the question whether it is possible to find such a strategy that will not be "Biting itself" with other indications from the technical analysis? Such a strategy exists and relies heavily on two main issues. First, we rely on one specific oscillator / indicator / method and use the candle light to confirm. Thanks to this, we can focus on developing effectiveness, entry / exit levels and not look for common "Holes all over"when some element of our analysis is against us. The second way (if we use several different elements) is to determine priority indicators or methods. Let's designate the main area of analysis, e.g. support and resistance, and look for confirmations of an ongoing trend or upcoming correction, e.g. in average or MACD indications. In this type of strategy and candles and an additional element will be only confirmation of probability. Even if they do not form a coherent signal, support and resistance levels still remain a decisive element.


Leave a Response