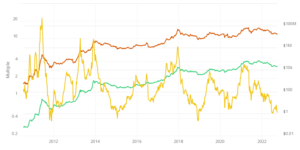
What is the Puella multiplier and how do I apply it?
The Puella multiplier is an indicator designed to analyze bitcoin's long-term market cycles based on miners' profits. The indicator is calculated as the ratio of the dollar value of the daily bitcoin emission to the 365-day moving average of the daily bitcoin emission, denominated in US dollars.
The main risk related to the use of the Puella multiplier in trade decisions is misinterpretation of miners' behavior and estimation of the profitability of mining.
Who and when created the indicator?
A multiplier based on the profitability of bitcoin miners was proposed in 2019 by David Puella, the creator of another popular onchain indicator called MVRV. The popularity of the tool, however, came after the publication of one of the cryptocurrency enthusiasts in which he described the usefulness of the indicator.
Instead of a metric such as the network hash rate, as in the case of the Hash Ribbons Index, Puell used the Mining Profitability Index. It is reflected in the daily and average annual dollar value of newly mined bitcoins. According to Puella, this created a simple and accurate way to find bitcoin's market cycles.
The multiplier is based on the assumption that miners shape market cycles bitcoin. Since they incur various costs (electricity, hardware depreciation, etc.) in "producing" bitcoins, they have to cover these costs by selling the first cryptocurrency on the market. The optimal time for this is calculated by miners based on a hypothetical break-even point - the selling price should be higher than the costs.
How is the Puella multiplier calculated?
David Puella's multiplier formula has two variants.
The first one only covers bitcoin issuance. It is calculated as the ratio of the daily dollar value of newly mined bitcoins to the 365-day moving average of the daily dollar value of newly mined bitcoins. This version of the calculation has proven to be the most popular in the cryptocurrency community and onchain data analysis services.
The second option takes into account not only bitcoin issuance, but also transaction fees. As the share of commission in miners' revenues will increase in the long run due to the halving which gradually reduces the amount of prizes per block, it is suggested that the dollar value of commissions received by miners should also be included in the calculation of the multiplier.
In this variant, the dollar value of mined bitcoins is added to the amount of commission paid in the network cryptocurrency. The result is the total miners 'income for the computation day divided by the 365-day moving average of all miners' daily income. This variant must be calculated manually.
What is the Puella multiplier for?
The Puella multiplier was conceived as a way to determine the highs and lows of bitcoin's market cycles based on the profitability of mining.
It is assumed that the drop in profitability of mining results only in "forced" sale by miners to cover the costs. And the increase in the multiplier plot, i.e. the increase in the profitability of miners, encourages miners to sell the excess bitcoin mined. This is the logic of operation and analysis of market cycles using the Puella multiplier.
Bitcoin price cycles analysis using the Puella multiplier
Based on historical data, different services and other cryptocurrency market participants allocate different levels of multipliers to determine the top or bottom of the bitcoin market cycle:
Top of the cycle - Blockchain Glassnode and CryptoQuant analytical services have identified peak of the cycle, conditional sell signal for bitcoin, in the area in which the multiplier is above 4. Lookintobitcoin has a similar indicator above 3,5.
Minimal cycle - Glassnode, Lookintobitcoin and CryptoQuant blockchain all have cycle low, i.e. a conditional buy signal for bitcoin, under 0,5.
These levels are only limited by analysts' views and their interpretation of historical data. These levels may change over time. For example, the two previous local peaks formed in March 2021 and July 2019 were below the values of 4 and 3,5 defined as cycle peaks.


![Forex Club – Tax 9 – Settle tax on a foreign broker [Download the Application] Forex Club - Tax 9](https://forexclub.pl/wp-content/uploads/2024/02/Forex-Club-Podatek-9-184x120.jpg?v=1709046278)
![Trading View platform – solutions tailored to the needs of traders [Review] trading view review](https://forexclub.pl/wp-content/uploads/2024/03/trading-view-recenzja-184x120.jpg?v=1709558918)
![How to connect your FP Markets account to the Trading View platform [Guide] fp markets trading view](https://forexclub.pl/wp-content/uploads/2024/02/fp-markets-trading-view-184x120.jpg?v=1708677291)
![How to invest in ChatGPT and AI? Stocks and ETFs [Guide] how to invest in chatgpt and artificial intelligence](https://forexclub.pl/wp-content/uploads/2023/02/jak-inwestowac-w-chatgpt-i-sztuczna-inteligencje-184x120.jpg?v=1676364263)


![Izabela Górecka – “Success on the market depends not only on knowledge, but also on emotional stability” [Interview] Izabela Górecka - interview](https://forexclub.pl/wp-content/uploads/2024/04/Izabela-Gorecka-wywiad-184x120.jpg?v=1713870578)
![WeWork – the anatomy of the collapse of a company valued at $47 billion [WeWork, part II] wework bankruptcy story](https://forexclub.pl/wp-content/uploads/2024/04/wework-bankructwo-historia-184x120.jpg?v=1711729561)
![Adam Neumann – the man who screwed up Softbank [WeWork, part AND] adam neumann wework](https://forexclub.pl/wp-content/uploads/2024/04/adam-neumann-wework-184x120.jpg?v=1711728724)


![The most common mistakes of a beginner trader - Mr Yogi [VIDEO] Scalping - The most common mistakes of a beginner trader - VIDEO](https://forexclub.pl/wp-content/uploads/2024/03/Scalping-Najczestsze-bledy-poczatkujacego-tradera-VIDEO-184x120.jpg?v=1711601376)
![Learning patience: No position is also a position - Mr Yogi [VIDEO] Scalping - Learning patience - No position is also a position - VIDEO](https://forexclub.pl/wp-content/uploads/2024/03/Scalping-Nauka-cierpliwosci-Brak-pozycji-to-tez-pozycja-VIDEO-184x120.jpg?v=1710999249)
![When to exit a position and how to minimize losses - Mr Yogi [VIDEO] Scalping - When to exit a position and how to minimize losses - VIDEO](https://forexclub.pl/wp-content/uploads/2024/03/Scalping-Kiedy-wyjsc-z-pozycji-i-jak-minimalizowac-straty-VIDEO-184x120.jpg?v=1710336731)


Leave a Response