


Dovish interest rate hike in the US, continuation of "risk-on" in the markets...

The past week on the financial markets was probably one of the most exciting this year. Not only have we experienced three dramatic twists and turns, but there has also been a change of leadership in the stock markets.
American first FED was supposed to be hawkish and turned out to be dovish (which was strongly reflected in price movements on the markets). The next day he was lifting his feet ECB, was also supposed to be hawkish, but also turned out to be dovish (e.g. the eurodollar exchange rate immediately gave back all the increases from the previous day, which followed the dovish surprise in the US). And on the next day, when investors were waiting for a "dovish" report on employment in the US, it turned out that the labor market is very "hawkish".
On the other hand, in the case of stock markets, in the past week, “technology” industries and countries moved to the lead in 2023 at the expense of the current leader, i.e. Chinese stock indices.
Dovish interest rate hike in the US
The most important event of the past week was J. Powell's press conference immediately after the US FED raised interest rates by another 25 basis points. The market expected a hawkish message, but in the style of "all bark no bite". Meanwhile, it turned out that the message was only hawkish at times, and without conviction. Therefore, it can be summed up as so dovish that the markets began to continue their growth without much resistance.
Why did investors expect a hawkish message? Mainly because of looser financial conditions – higher bond and equity prices, tighter credit spreads and a cheaper dollar. Easier financial conditions offset to some extent interest rate hikes by the FED. Looser financial conditions were the reason for numerous hawkish speeches in 2022 by many FOMC members, as well as Powell himself (for example, the famous speech in Jackson Hole).
Members are clearly concerned FOMC unjustified easing of financial conditions can be found in the minutes from the FOMC meeting of December 12-13, 2022:
"Participants noted that, because monetary policy worked importantly through financial markets, an unwarranted easing in financial conditions, especially if driven by a misperception by the public of the Committee's reaction function, would complicate the Committee's effort to restore price stability. "
And when asked during the press conference about financial conditions whether unjustified easing of financial conditions is still important for FOMC members, Powell de facto replied that financial conditions are no longer as important to the Fed (as they were in December). The market could not get any better and interpreted such a message as a green light for further increases in share prices. It can only be said that Powell, when selecting the message and communication, is based on some other criteria than those formally communicated by the FED in terms of benign financial conditions (what was important for the FED for the last six months suddenly is no longer - and in a situation when financial conditions in the markets are at their softest since the Fed raised interest rates).
Many different explanations / options / motivations have appeared among investors in recent days - why Powell changed his approach to loose financial conditions so much, but even the informal FED spokesman, Wall Street Journal journalist Nick Timiraos is not entirely sure of the reasons for such a change / statement Powell.
How does the market forecast the next rate hikes in this cycle? The first chart below shows the probability distribution at subsequent FED meetings regarding the interest rate level (data from February 3.02.2023, 10.00 at 25:20 am, i.e. before the publication of employment data). The last increase was supposed to be in March this year. by 25 bps According to the probability distribution, after the March hike, we had no change until the FOMC meeting on September 1 this year. The first cut by 13 bps was to take place on November XNUMX this year, the next cut on December XNUMX this year.
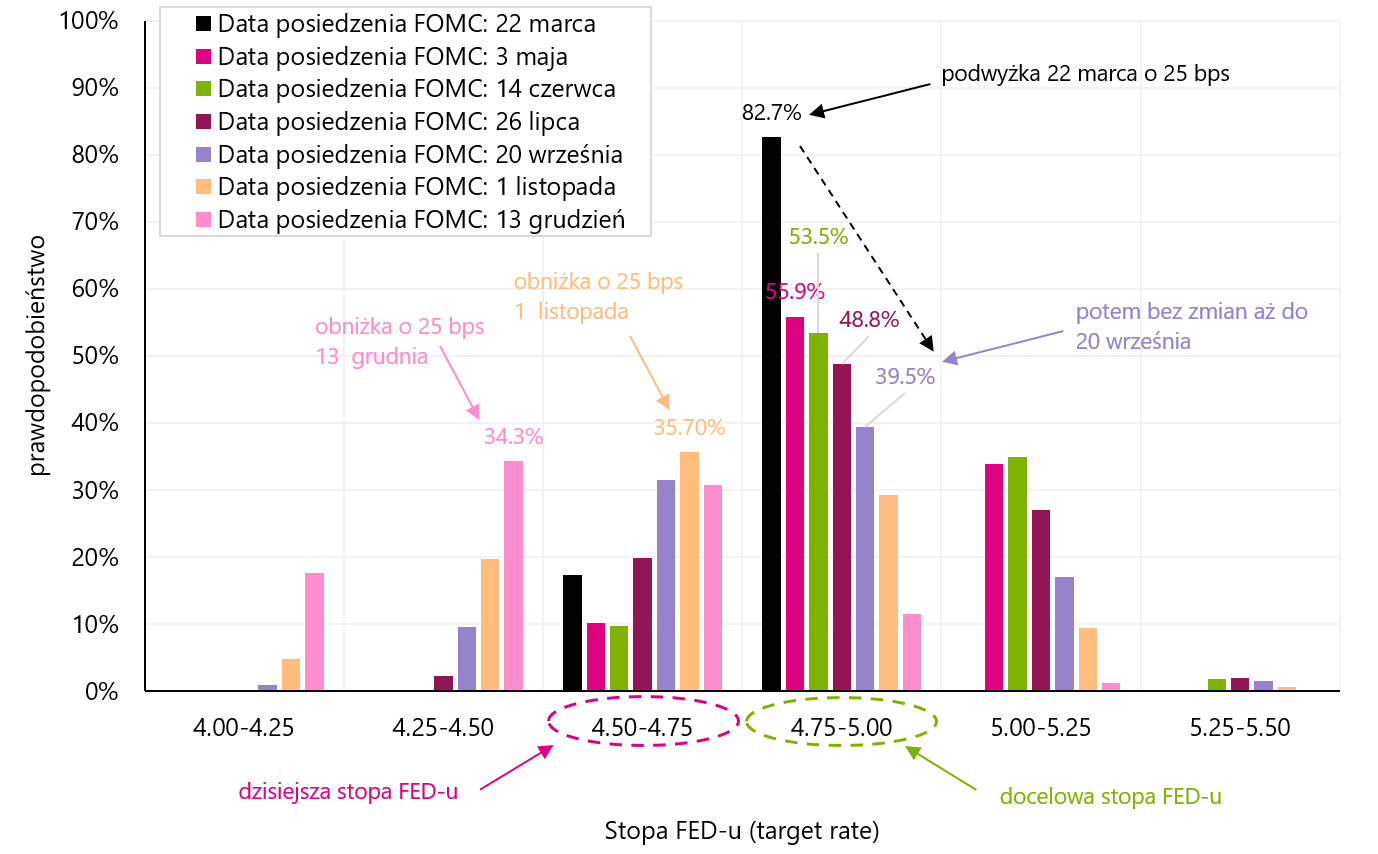
W. 1 Probability distribution at subsequent FED meetings regarding the interest rate level (data from February 3.02.2023, 10.00 at XNUMX am, i.e. before the publication of the employment report). Source: own study, cmegroup.com
Nevertheless after the publication of the employment data, everything changed. The next chart below shows the probability distribution at subsequent FED meetings regarding the interest rate level (data from February 3.02.2023, XNUMX from the market close, i.e. after the publication of employment data). Now the market is pricing in two hikes of 25 bps. The last one would be in May. According to the probability distribution, after the May hike, we had no change until the FOMC meeting on September 20 this year. The first reduction by 25 bps on November 1 this year. (but from "one" level higher), another reduction on December 13 this year. up to 4,50-4,75%. It is evident how hawkish the employment report was (we write more about this report later in this commentary).

W. 2 Probability distribution at subsequent FED meetings regarding the interest rate level (data from February 3.02.2023, XNUMX from the market closing, i.e. after the publication of the employment report). Source: own study, cmegroup.com
Let's also compare how the curve of contracts for the FED rate changed after the FOMC decision of February 1 this year, and after the publication of employment data on February 03.02.2023, 02.02 - which is presented in the chart below. While J. Powell provided the market with a dovish message (moving down the curve on February 31.01, compared to the curve on January XNUMX), the hawkish US employment report for January shifted the curve up drastically. Now the market sees two interest rate hikes instead of one. Had the FOMC meeting been held two days later, we would have likely seen a 50 bps hike (instead of "only" 25 bps).

W.3 Term curves 30-day Federal Funds contracts – comparison of the curve from January 31.01.2023, 02.02.2023, February 03.02.2023, XNUMX and February XNUMX, XNUMX. Source: own study, cmegroup.com
How the stock, bond and Eurodollar markets reacted to the dovish message of J. Powell and the hawkish employment report are presented in the charts below. In case of S & P500 (futures) the market reacted euphorically to Powell's "green light" for further increases in stock prices. Whereas The employment report shook the stock market slightly, but compared to other asset classes, the reaction was not too strong. The S&P500, despite falling on Friday, still remains about 1,8% above the levels before Powell's dovish press conference. In the traditional cycle of Fed rate hikes, the stock market tends to rise throughout the rate hike period because the economy is still in momentum, which means higher corporate earnings. The relatively less negative reaction of the stock market to the employment report could be interpreted in a similar way (a strong labor market means higher economic growth and higher corporate profits). Especially that other asset classes, as a result of the reaction to the employment report, more than gave up their gains after Powell's dovish speech.

W. 4 S&P500 Futures Index in the fifth week of 2023. Source: own study
In the case of the bond market, the employment report in the US increased the yield on 10-year Treasury bonds above the level before Powell's dovish press conference. We show this in the next chart.
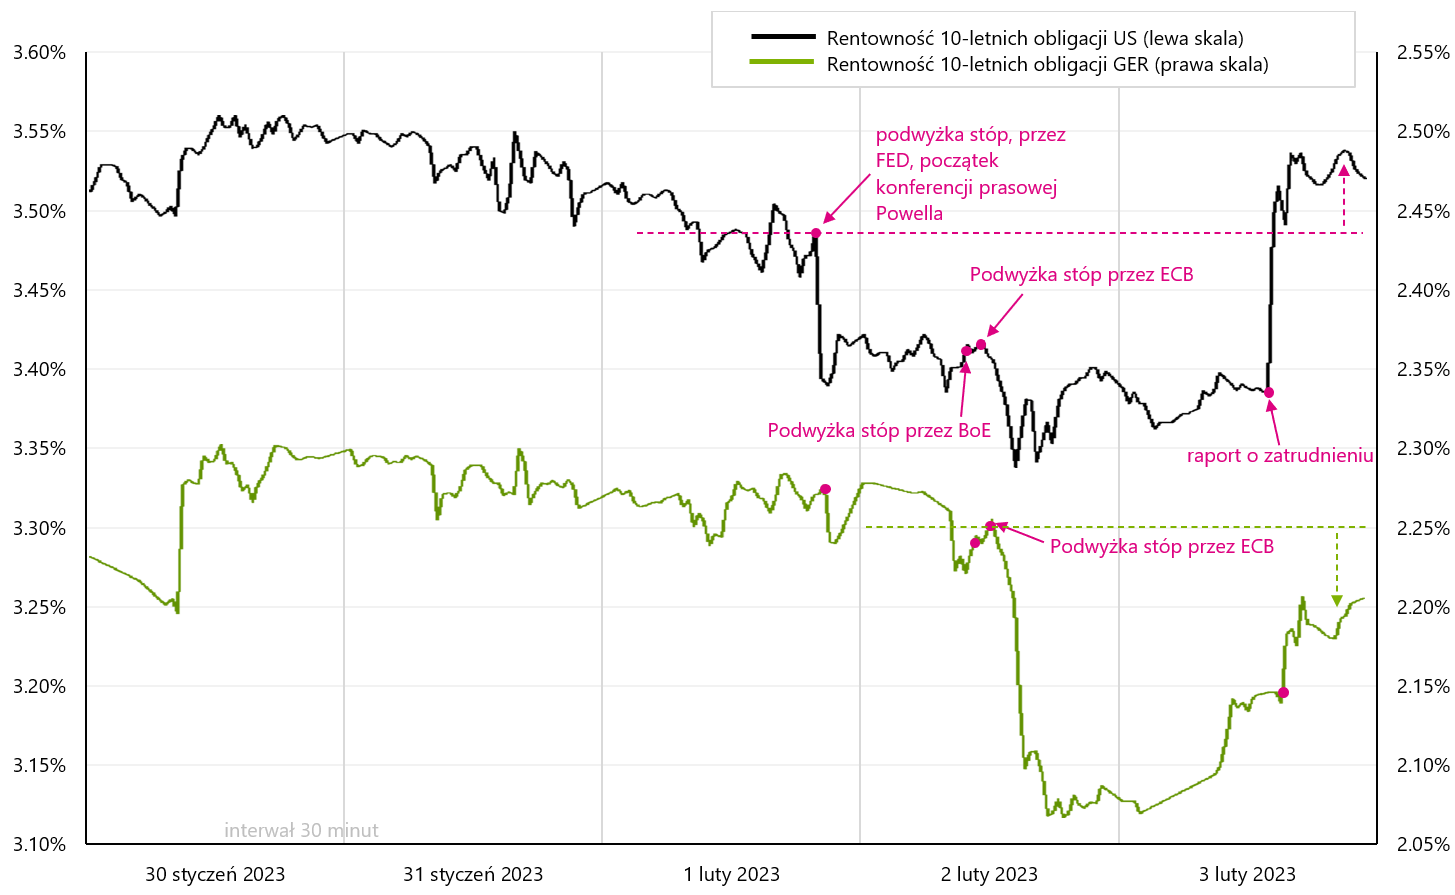
W. 5 Yields on 10-year treasury bonds (US and German) in the fifth week of 2023. Source: own study
While German government bonds also reacted to both the press conference Powell, as well as the US employment report - the dovish increase of the ECB was definitely more important. All in all, we ended the week with the yields of 10-year German bonds below the level from the moment of the ECB's announcement of a rate hike.
In the past week, the behavior of the eurodollar was also interesting (next chart). All gains after the dovish interest rate hike in the US were fully returned the next day, when a similarly dovish message was sent from the ECB on the occasion of the interest rate increase in Europe. It is possible that we are near the eurodollar hill - at least from the perspective of the inflation and the ECB's response in the form of rate hikes. Additionally, strong US employment report weakened the euro by over 1%. We close the week on the eurodollar at the lowest level since January 18 this year.

W. 6 Eurodollar exchange rate in the fifth week of 2023. Source: own study
Continuation of "risk-on" in the markets
In the past week, on the one hand, we had a continuation of good moods on the global equity markets, but on the other hand, there were significant revaluations in the leadership positions: technology vs. Emerging Markets and Energy Sector. The biggest returns last week were in technology-related countries and sectors (MSCI Taiwan +6,7%; S&P500 Communication Sector +5,3%; S&P500 Information Sector +3,7%; Nasdaq +3,4%). The biggest drops are MSCI China -5,8%, S&P500 Energy Sector -5,9%, MSCI Emerging Markets -2,2%. Details are presented in the table below (results are sorted by returns in the past week 5 of 2023).
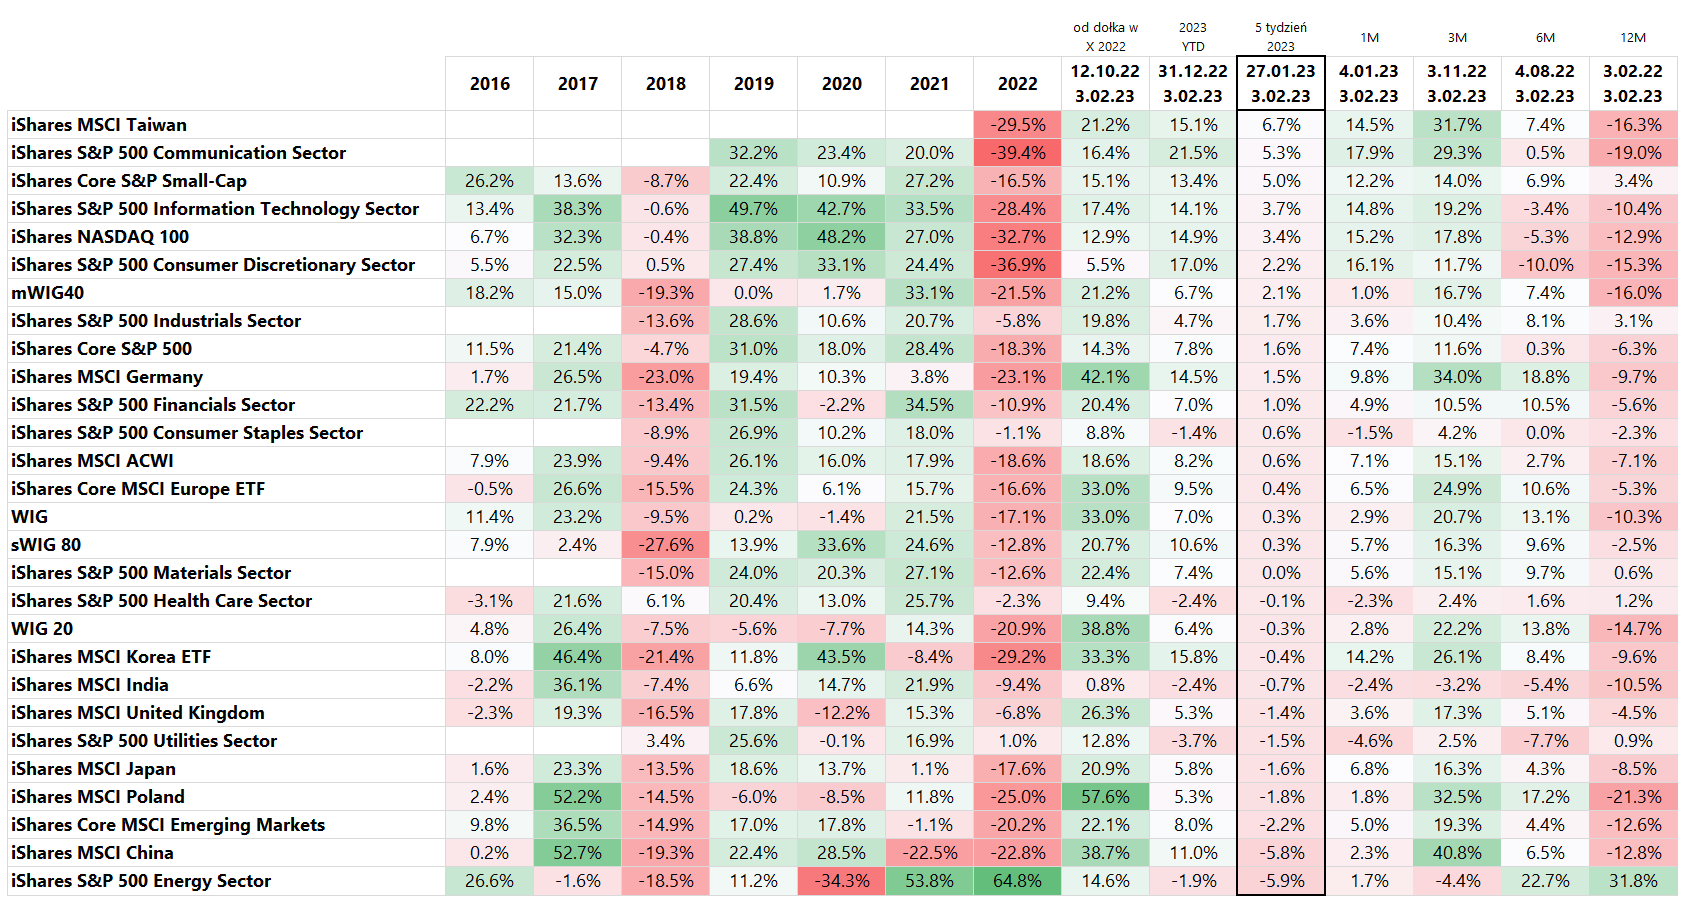
T.1 Global Stock Markets, MSCI, S&P 500 – rate of return: 2016 – 2022 and until February 3.02.2023, XNUMX Source: own study
Such differences in weekly returns must have caused significant reshuffling, also in the ranking of returns for 2023 (YTD). At the end of the 4th week, the 1st place belonged to China (playing towards the opening of the local economy), but already in the 5th week we "returned to the old game", i.e. to general technology companies (in the case of the S&P500 Communication sector, 49% of this index is Meta and Alphabet (aka Google)). Details are presented in the table below (results are sorted by returns in 2023).
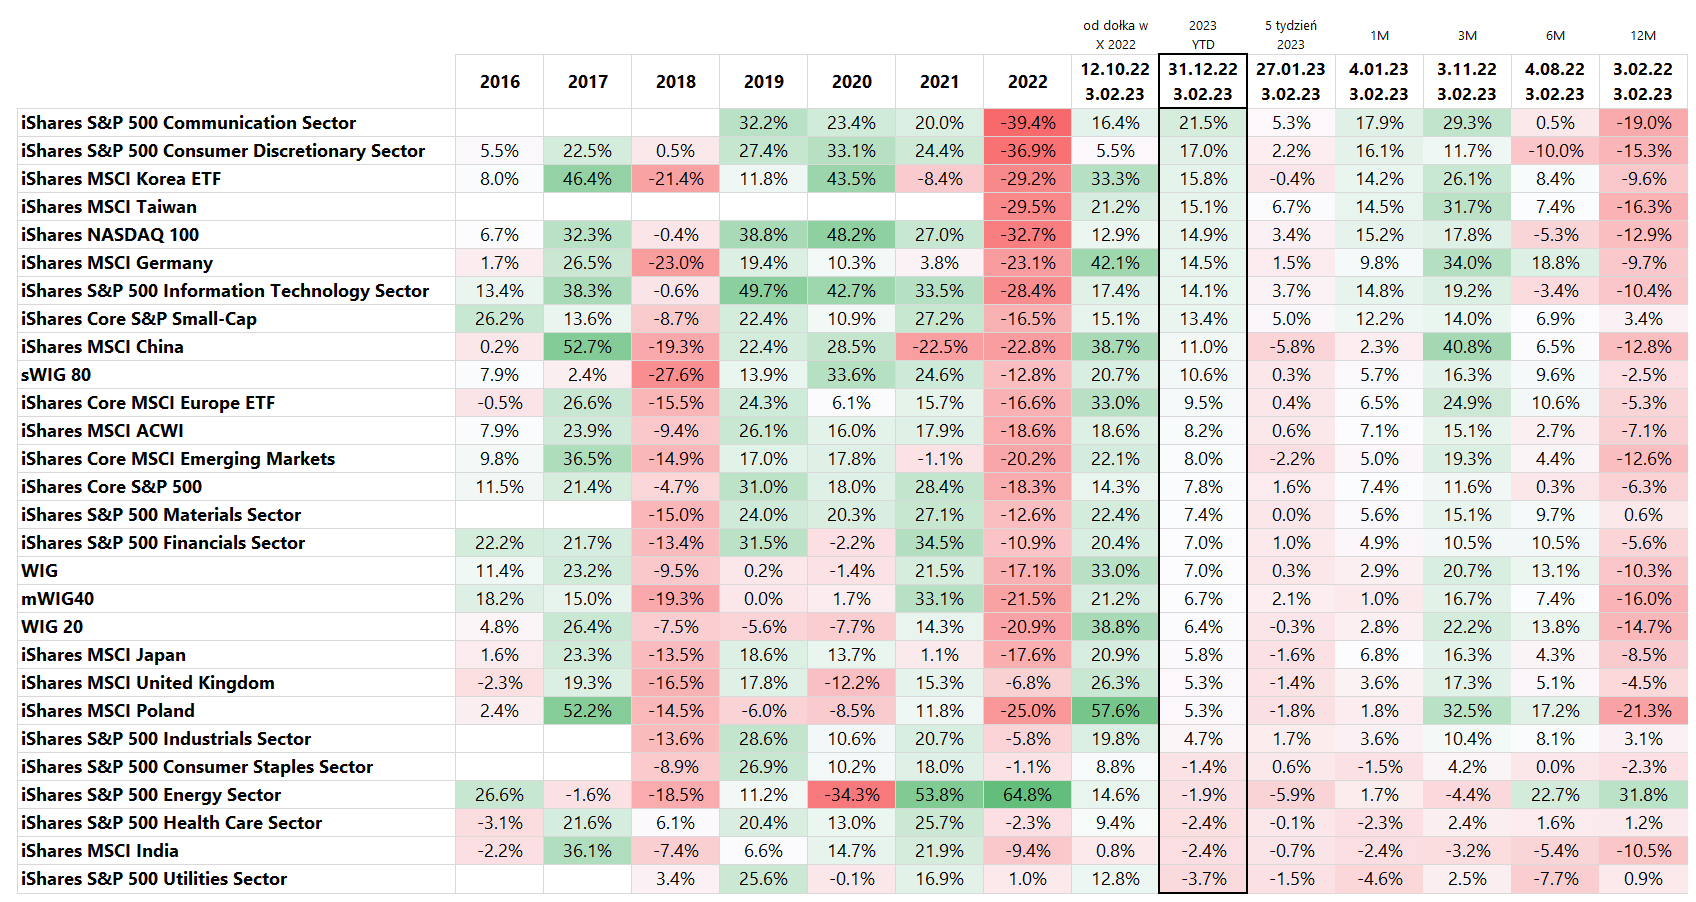
T.2 Global Stock Markets, MSCI, S&P 500 – rate of return: 2016 – 2022 and until February 3.02.2023, XNUMX Source: own study
The chart below compares returns between the IT, Energy and Nasdaq100 sectors - but from a slightly longer perspective. While 2022 belonged unquestionably to the Energy sector, in 2023 it is the other way around. Which doesn't change much if we compare ourselves from the beginning of 2022.
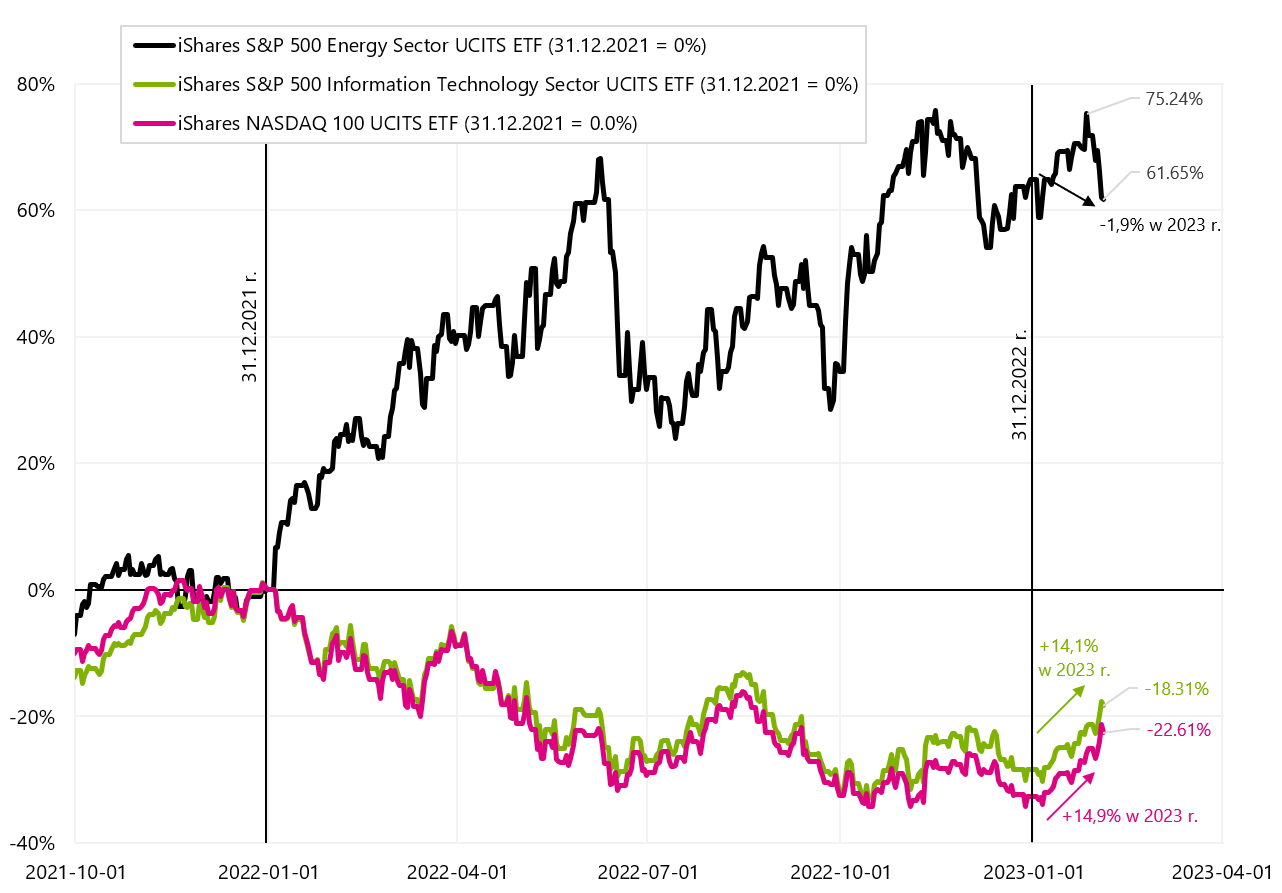
W. 7 iShares S&P500 Energy, iShares S&P500 Information Technology, and iShares Nasdaq 100 ETF until January 03.02.2023, XNUMX. Source: own study, ishares.com
In the next chart, we compare the rates of return from three MSCI indices for Poland, China and Germany (i.e. for countries that, especially this year, are "riding in a common cart"). Since the beginning of the year, MSCI China has increased +11,0%, MSCI Poland +5,3% and MSCI Germany +14,5%.
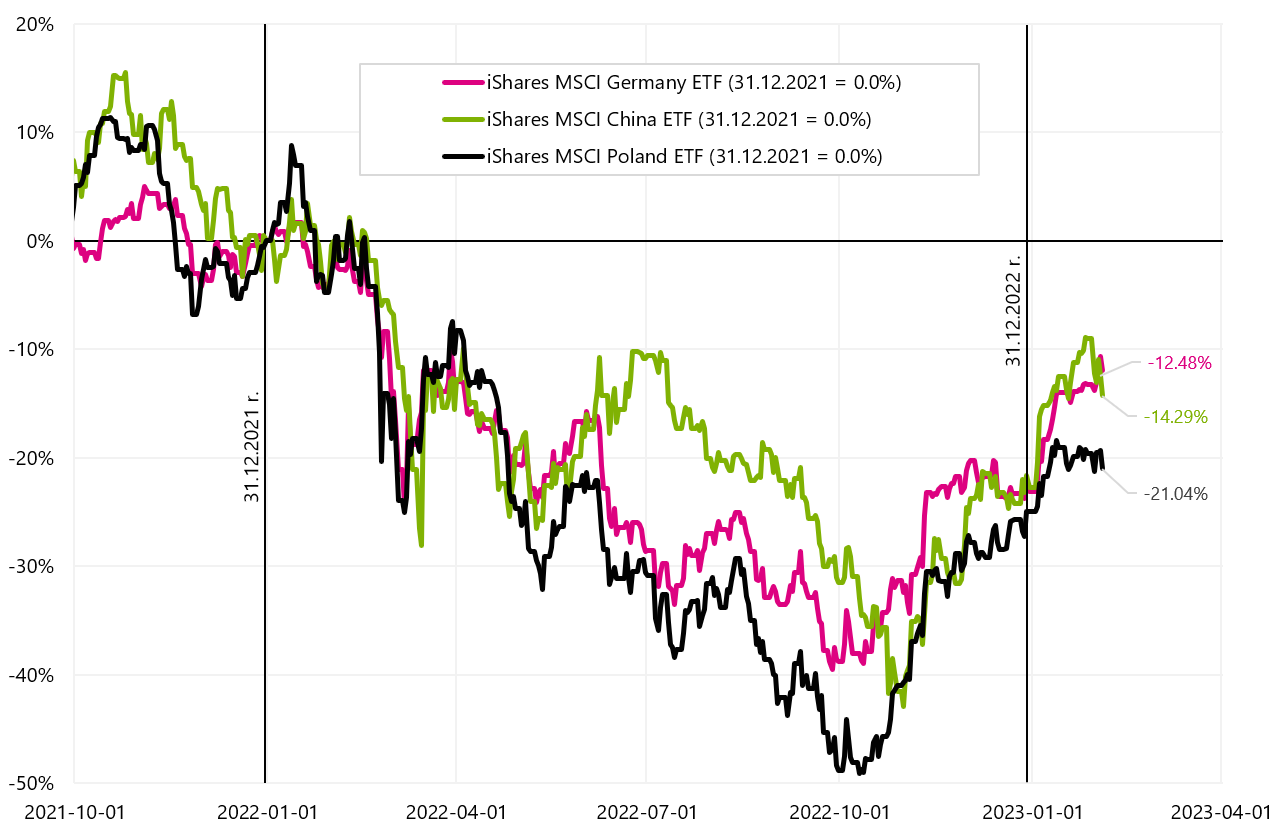
W. 8 MSCI China Indexes, Poland i Germany until January 03.02.2023, XNUMX. Source: own study, isahres.com
Let's compare how debt ETFs behaved last week. The highest rates of return were provided by European and American High Yield funds, i.e. high-yield corporate bonds (+1,1% and +1,3%). However, since the beginning of the year, the highest rates of return have been recorded on long-term US and European treasury bonds (+7,6% iShares 20+ Year Treasury Bond and +6,8% iShares Euro Govt Bond 15-30yr). The Polish treasury bond index (Treasury BondSpot Index) earned 4,8% this year. The table below details the major global debt ETFs (both government and corporate).

T.3 Major global debt ETFs: 2016 - 2022 and until February 3.02.2023, XNUMX. Source: own study
In the next chart, we present the rates of return on selected debt ETFs from the beginning of 2023.
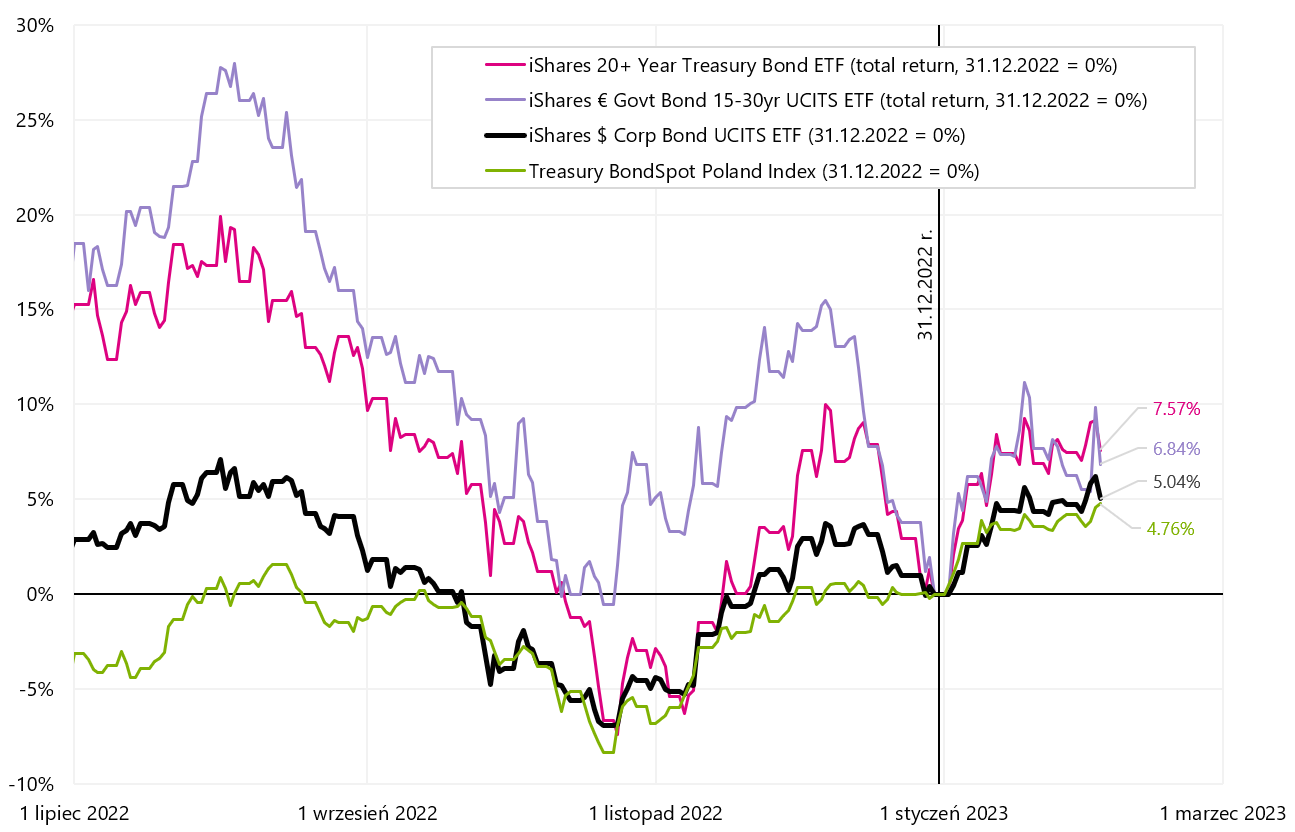
V.9 Selected Debt ETYs until December 03.02.2023, XNUMX. Source: own study, stooq.pl
Hawk employment report
The January employment report in the US economy was indeed very hawkish. The increase in employment amounted to +514 thousand. FTE (establishment survey), plus an additional +71 as revisions for December and November 2022. Could J. Powell be right (for months talking about a strong labor market) - only the markets did not want to listen. According to the "household survey", the number of working people increased by 894 in January. people (in December +717 thousand, so in two months we have an increase of +1,611 million people!). Of course such a strong labor market means higher interest rates and is intuitively incompatible with a permanent decline in wage growth or the inflation target of 2% (Again, Powell was right.)
The strength of the labor market in January is also underlined by the increase in the average weekly number of working hours (from 34,4 to 34,7 hours in the private sector), as well as the increase in the average number of overtime hours (from 3,0 to 3,1 hours). In addition, the fall in the unemployment rate (to 3,4%) should be mentioned, which is in line with the recent decline in the number of unemployment benefits.
Jerome Powell, in his speech at the Brookings Institution in 2022, clearly indicated what he mainly looks at when analyzing the labor market:
- labor market supply/demand,
- 3-month average job change, and of course
- increase in the hourly wage rate.
Supply vs. demand is presented in the chart below. The supply of employees is the size of the labor force, while the demand on the labor market is the sum of job openings and the level of employment. What is important from the Fed's point of view, the imbalance in the labor market worsened in January. Currently, demand exceeds supply by 5,3 million people - while in December it was much less, i.e. 4,7 million people.
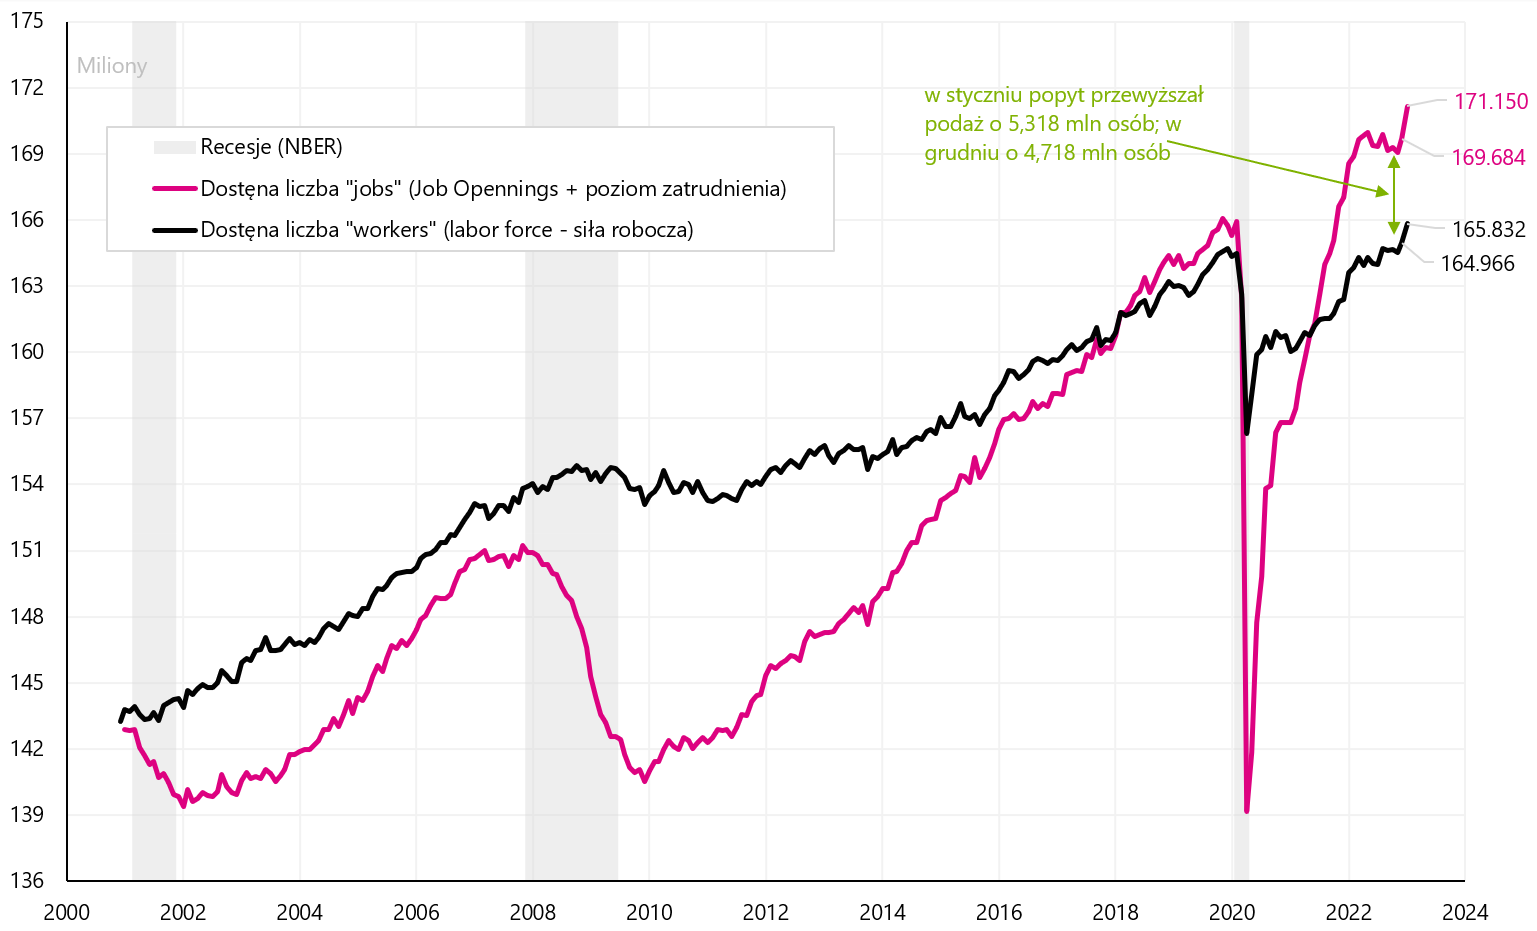
W. 10 Supply and demand in the US labor market (series looked at by J. Powell). Source: own study, FRED
Similarly, in January we have an increase in 3-month averages concerning changes in employment. This applies to both employment data based on the "establishment survey" and the "household survey". Details are shown in the next two charts.
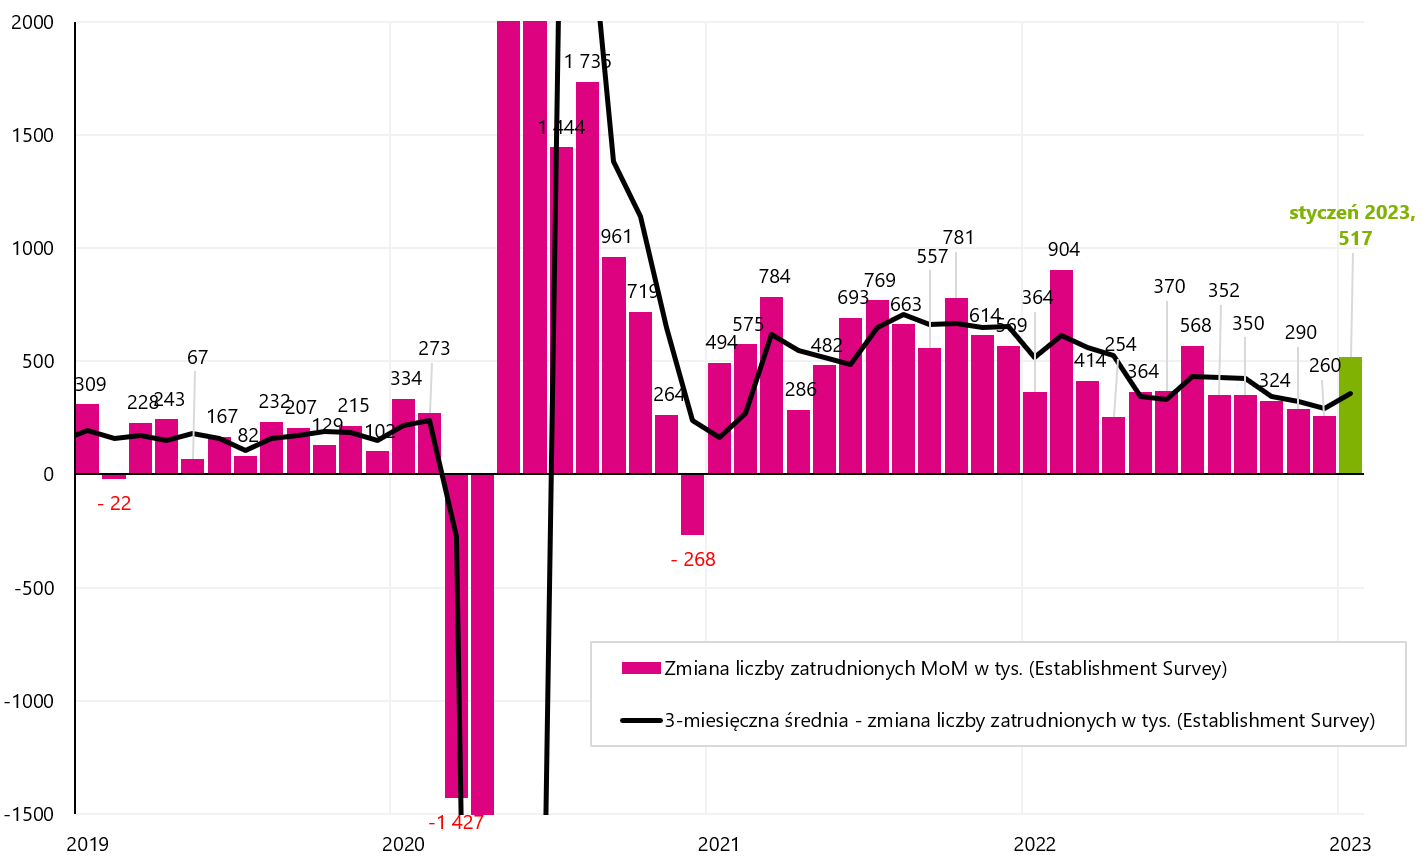
W. 11 Monthly employment change according to the Establishment Survey (and 3-month rolling average change). Source: own study, FRED

W. 12 Monthly change in employment according to the Household Survey (and 3-month rolling average change). Source: own study, FRED
In the case of wage growth, the average hourly wage increased by 0,3% in January, which allowed the annual growth rate to drop to 4,43% (YoY). Below we present 3 series of salary growth that J. Powell is "looking at" (this is the chart presented by Powell in his presentation at the Brookings Institution).
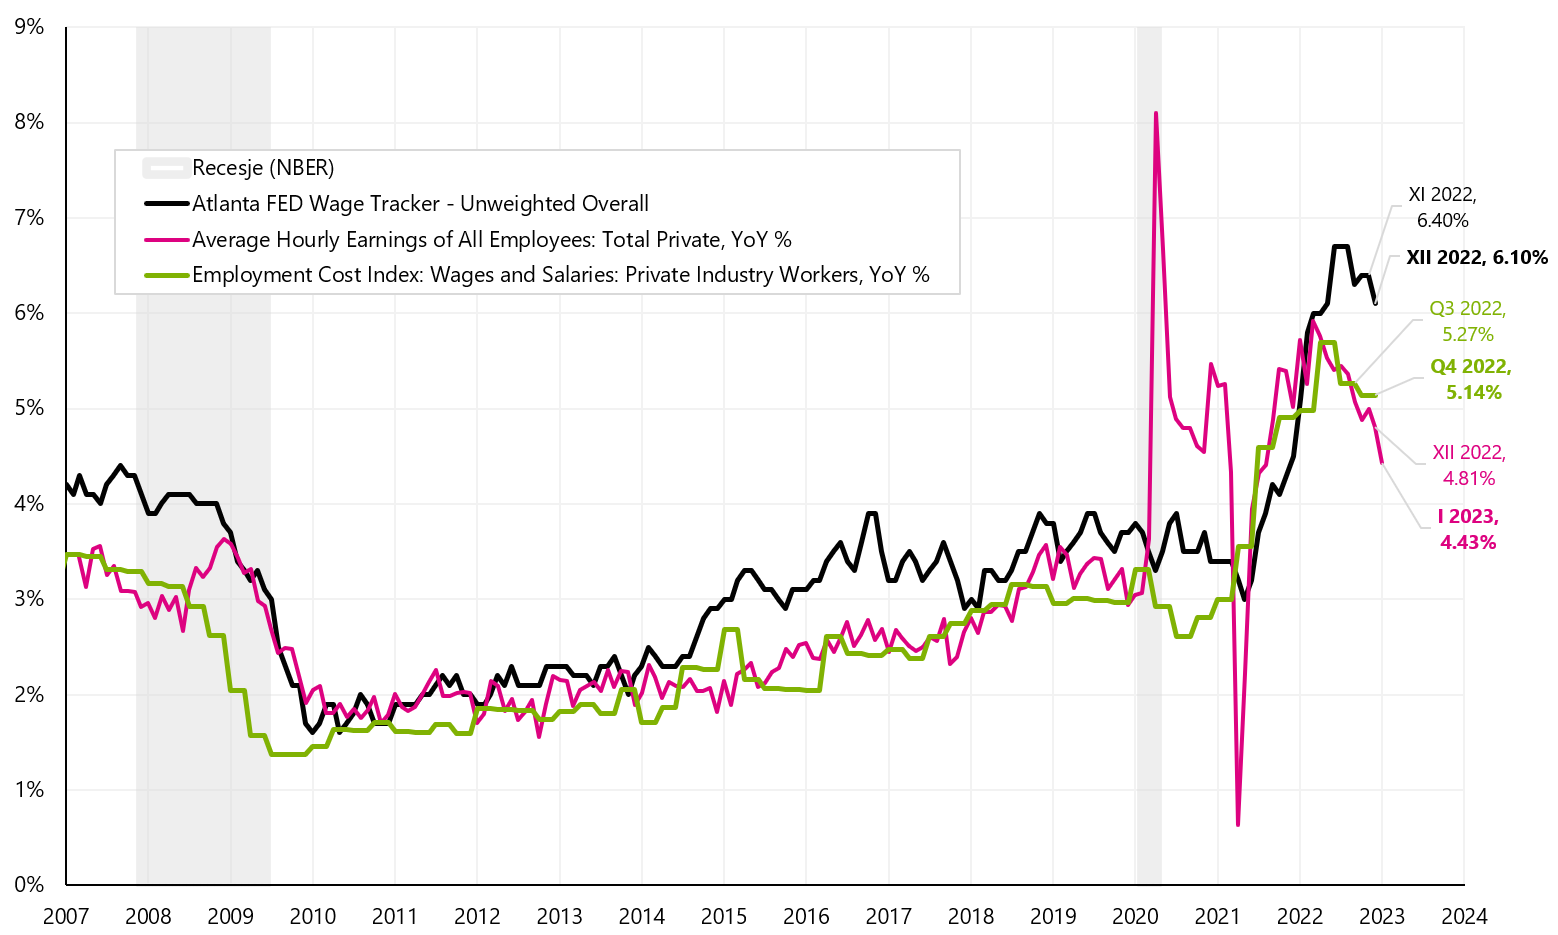
W. 13 Three different US salary series (so-called "Powell chart"). Source: own study, FRED
While the annual wage dynamics trend remains downward, it is still difficult to say (especially with such a strong labor market) that we are heading permanently towards pre-pandemic levels.
Summation
Last week we got to know the dovish face of central banks (both FED and ECB). Ale we also got to know the “hawkish” face of the US labor market, which has nothing to do with the interest rate hikes so far. As a result, the market is practically pricing in one more interest rate hike in the US than before.
The key to the further behavior of the markets in the near future may turn out to be the American inflation for January 2023 (published on February 14), which, if it surprises the markets with a higher reading, may have a negative impact on the narrative that has been built on the markets for many weeks, that inflation can easily and fast way to the goal of central banks.
Equity markets continue their gains, although in the past week industries and countries traditionally regarded as tech have taken the lead. The highest rate of return in 2023 was delivered by the US communications sector so far (iShares S&P500 Communication Sector, +21,5%), while the current leader, MSCI China, fell by as much as 5,8% last week, resulting in a rate of return in 2023 decreased to 11.0%.
About the Author
 Jaroslaw Jamka - Experienced fund management expert, professionally associated with the capital market for over 25 years. He holds a PhD in economics, a license of an investment advisor and a securities broker. He personally managed equity, bond, mutli-asset and global macro cross-asset funds. For many years, he managed the largest Polish pension fund with assets over PLN 30 billion. As an investment director, he managed the work of many management teams. He gained experience as: Member of the Management Board of ING PTE, Vice-President and President of the Management Board of ING TUnŻ, Vice-President of the Management Board of Money Makers SA, Vice-President of the Management Board of Ipopema TFI, Vice-President of the Management Board of Quercus TFI, Member of the Management Board of Skarbiec TFI, as well as Member of Supervisory Boards of ING PTE and AXA PTE. For 12 years he has specialized in managing global macro cross-asset classes.
Disclaimer
This document is only informative material for use by the recipient. It should not be understood as an advisory material or as a basis for making investment decisions. Nor should it be understood as an investment recommendation. All opinions and forecasts presented in this study are only the expression of the author's opinion on the date of publication and are subject to change without notice. The author is not responsible for any investment decisions made on the basis of this study. Historical investment results do not guarantee that similar results will be achieved in the future.


Leave a Response