


Moody's - one of the largest credit rating agencies in the world

The credit rating agency market is very concentrated. The "big three", which control most of the market, play the first fiddle. BIG 3 includes entities such as S&P, Fitch and Moody's. In today's article, we will summarize the activities of the latter company.
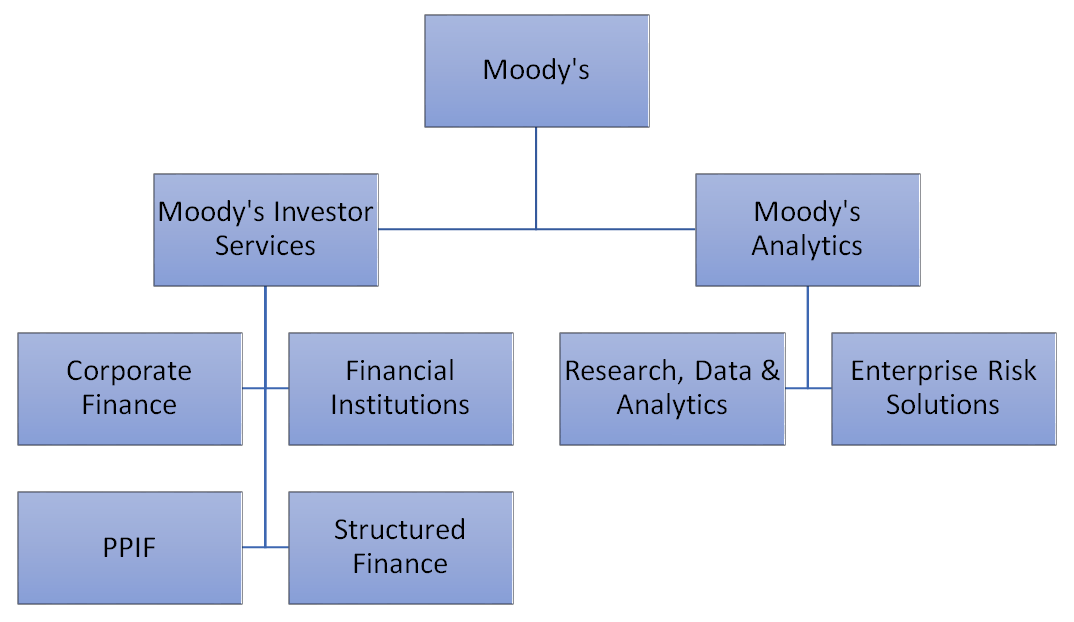
Moody's is a company that owns one of the most recognizable brands in the financial world. It is a company known primarily for publishing credit ratings from both private companies and governments. The rating market is really huge. However, this company is definitely more. In addition to assigning ratings, Moody's also offers analytical solutions as well as market and economic research. Moody's has divided its services into two main areas of activity: MIS and MA.
Source: own study based on the annual report
Moody's Investors Service (MIS)
This is Moody's largest segment. In Q2021 69, he was responsible for approximately XNUMX% of the company's revenues. Of course, the services for investors are very broad. The company divides the business areas of Moody's Investors Service into the following segments:
- Corporate Finance (CFG)
- Financial Institutions (FIGs)
- Public, project and infrastructure finance (PPIF)
- Structured Finance (SFG)
However, the mentioned segments are also divided into smaller subgroups. This is to add more transparency to company reports. Why do companies prefer to use Moody's services than the offer of cheaper, but less recognizable customers? The company suggests that this is because a customer rated Moody's could save up to 40 basis points in interest cost.

Source: company presentation for Q2021 XNUMX
The MIS department employs over 1000 analysts from over 40 countries and regions. In the whole of 2020, there are over 35 customers served and structured offers.
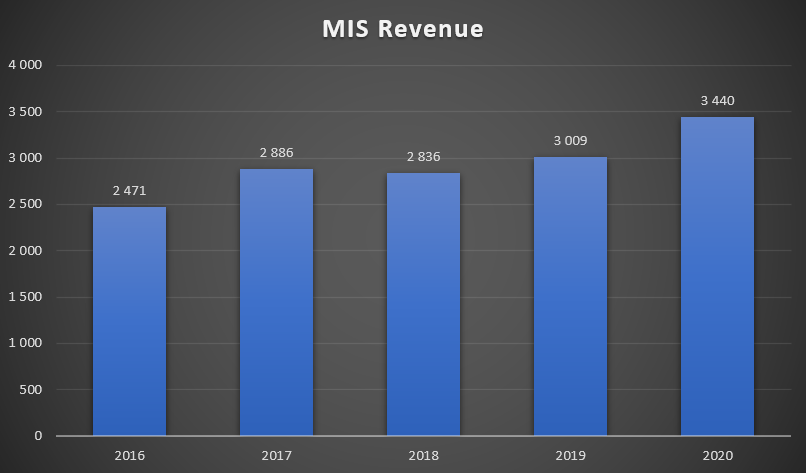
It is worth adding that Moody's Investors Service's revenues are mostly generated in the United States, which accounts for 61% of MIS revenues. Moreover, transaction revenues dominate (68% of MIS revenues). The low rate of recurring revenues means that the company is more sensitive to the situation on the debt financing market. The pandemic period caused a significant increase in the demand for Moody's services. Investors needed reliable information on the financial condition of indebted enterprises. The segment's revenues increased by $ 2020 million in 431, i.e. 14,3% y / y.
Source: own study based on the company's annual reports
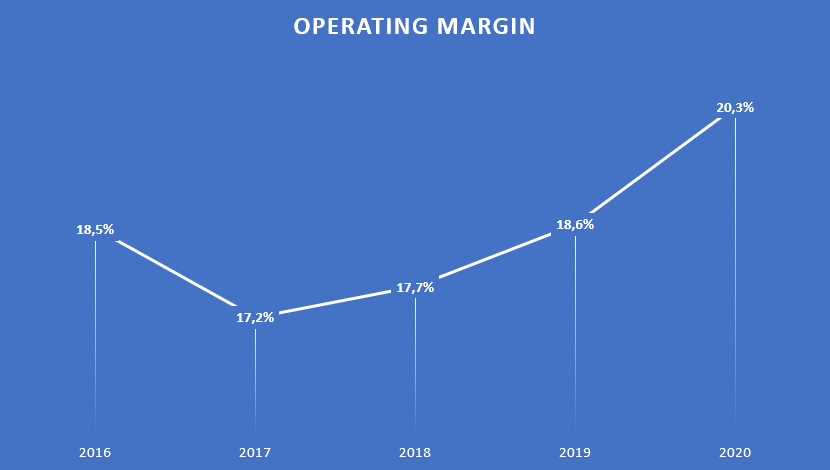
The aforementioned area of the company's operation is very profitable. An operating profitability of more than 50% is not unusual.

Source: own study based on the company's annual reports
The low margin in 2016 was due to penalties and settlements that Moody's had to pay in 2016.
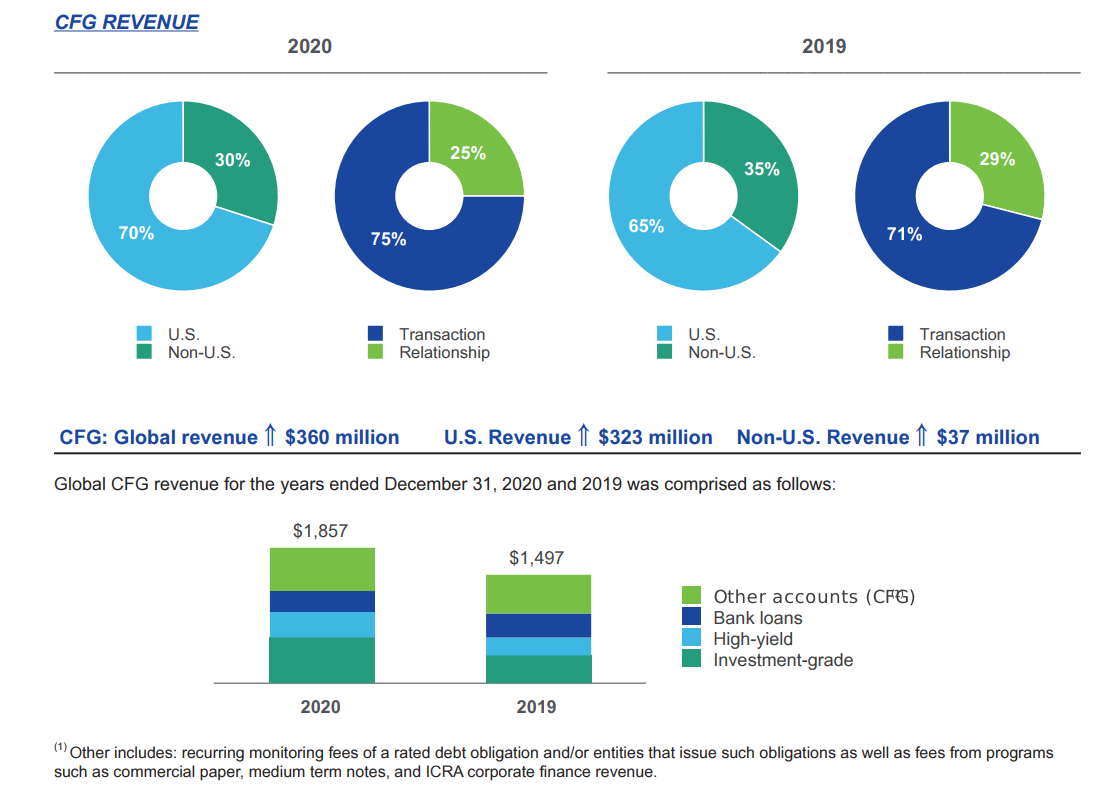
CFG
It is the largest segment belonging to Moody's Investor Service. It is responsible for about half of MIS revenues. The CFG segment has been divided into:
- Investment-grade
- High-yield
- Bank loans
- Other
Corporate Finance is mostly transactional, with only 25% of revenues being classified as recurring. This is the weakest result of all Moody's Investors Service segments. Revenues in the United States increased in 2020. The reason was the increased demand of American companies for Moody's services due to the significant increase in the level of corporate debt. A particularly large increase in revenues was related to investment grade debt.
Source: 2020 annual report
The company's revenues in this segment increased by $ 360 million. This meant a very high increase in revenues, which amounted to + 24% y / y. The company's sales increased much faster than the average annual revenue growth rate, which in 2016-2020 amounted to + 13,4%.
| CFG | 2016 | 2017 | 2018 | 2019 | 2020 |
| revenues | $ 1 million | $ 1 million | $ 1 million | $ 1 million | $ 1 million |
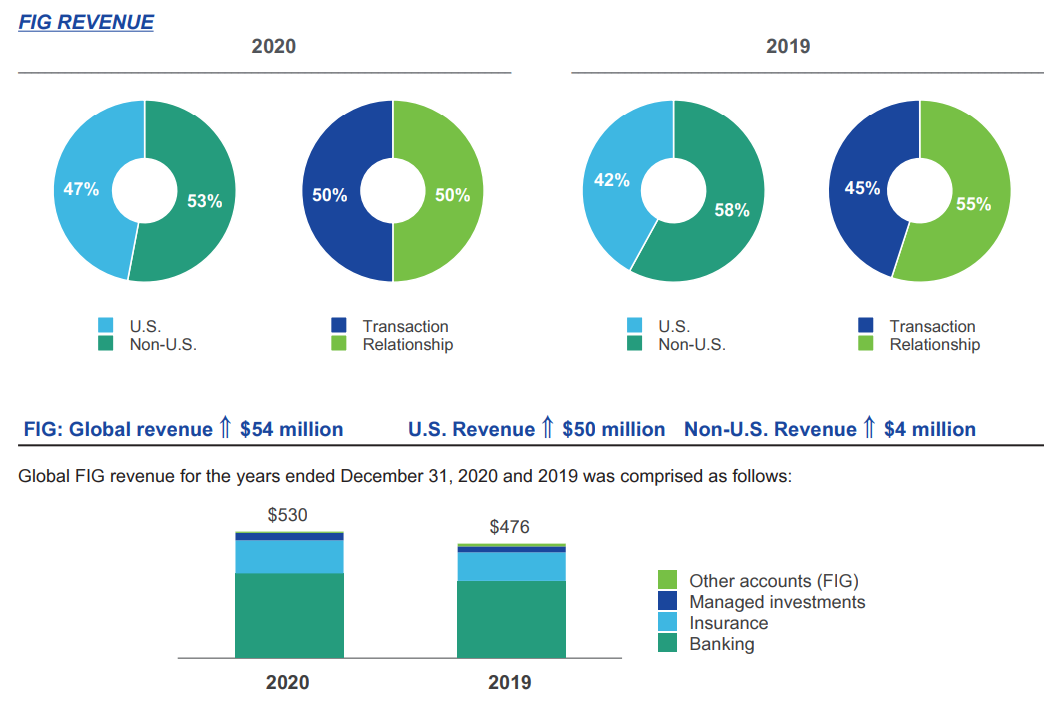
FIG
It is the second largest MIS segment. In Q2021 15,8, he was responsible for XNUMX% of Moody's Investors Service's revenues. About half of the revenues in this segment are recurring.
The FIG segment has been subdivided into:
- Banking
- Insurance
- Investment management
- Other
Source: 2020 annual report
In 2020, revenues in the United States increased, reaching 47% of total sales. The banking market, which accounted for most of the growth, performed particularly well.
The company's revenues in this segment increased by $ 54 million. This meant an increase in revenues by + 11,3% y / y. The company's sales increased much faster than the average annual revenue growth rate, which in 2016-2020 amounted to + 9,5%.
| FIG | 2016 | 2017 | 2018 | 2019 | 2020 |
| revenues | $ 369 million | $ 436 million | $ 442 million | $ 476 million | $ 530 million |
SFG
In Q2021 14,8, the structured products segment accounted for approximately 40% of Moody's Investors Service's revenues. About XNUMX% of the company's revenues in this quarter are recurring. The segment has been divided according to the type of products:
- ABS (Asset-backed securities)
- RMBS
- CMBS
- Structured loan
- Other
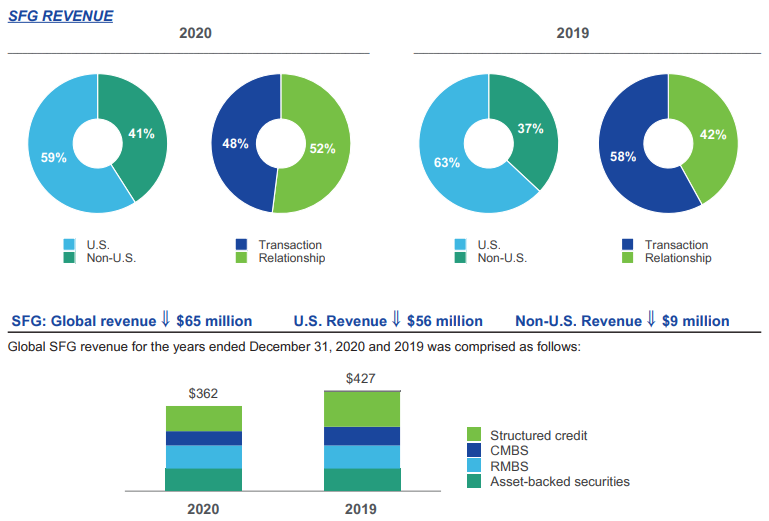
Source: 2020 annual report
2020 was a difficult year for this segment. Activity on the CLO market decreased significantly. However, the decline in activity concerned each of the components of this segment. Revenues fell by $ 2020 million in 65. This meant a decrease in revenues by 15,2%. The company's revenues on this market were the lowest in the analyzed period (2016-2020).
| SFG | 2016 | 2017 | 2018 | 2019 | 2020 |
| revenues | $ 437 million | $ 496 million | $ 527 million | $ 427 million | $ 362 million |
PPIF
In Q2021 13,4, the above-mentioned segment accounted for approximately 47% of Moody's Investors Service's revenues. Interestingly, this is the segment with the largest share of recurring revenues - as much as XNUMX%. The segment has been divided into:
- Public funding
- Infrastructure
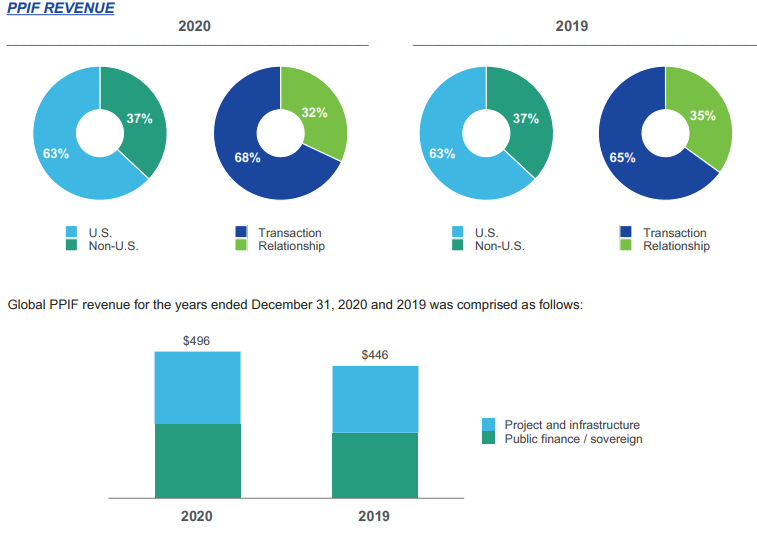
Source: 2020 annual report
The revenues related to the infrastructure sector, which wanted to increase financial liquidity by issuing debt, increased significantly. The increase in indebtedness was driven by increasing uncertainty about the spread of the COVID-19 pandemic.
It was a very good year for this segment. The company's revenues in this segment increased by $ 50 million. This meant an increase in revenues by + 11,2% y / y. The company's sales increased much faster than the average annual revenue growth rate, which in 2016-2020 amounted to + 4,7%.
| PPIF | 2016 | 2017 | 2018 | 2019 | 2020 |
| revenues | $ 412 million | $ 431 million | $ 391 million | $ 446 million | $ 496 million |
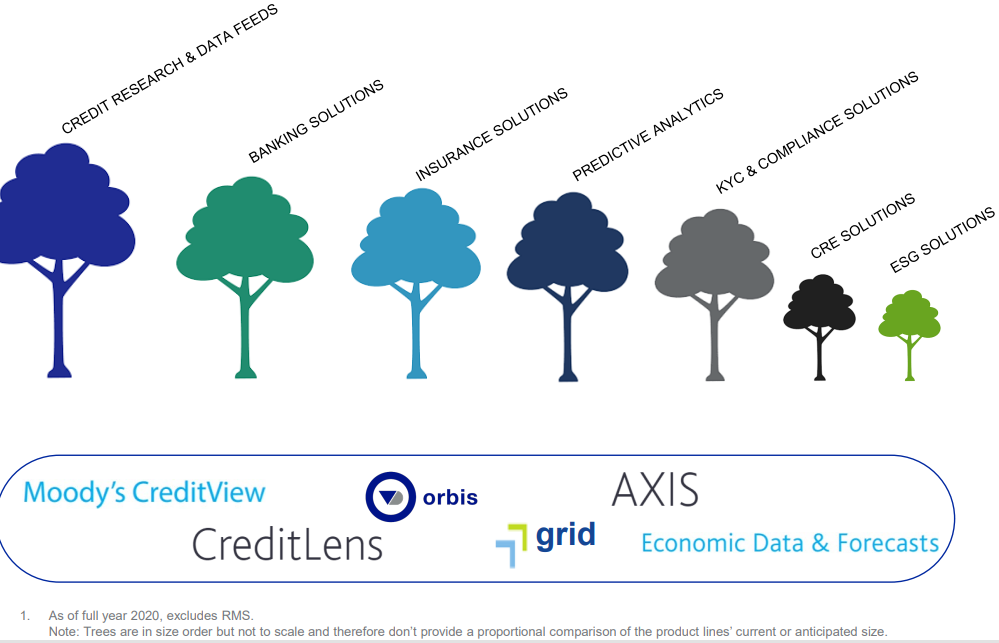
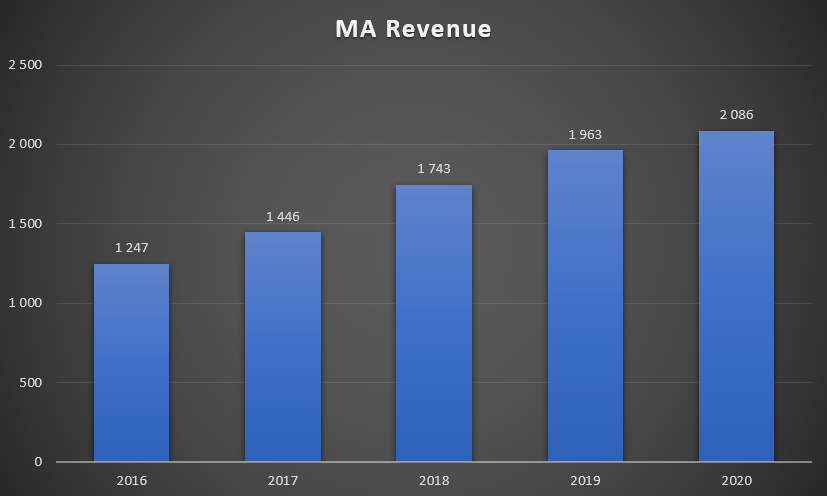
Moody's Analytics - MA
Moody's Analytics is the second area of the company's activity. In Q2021 31, he was responsible for 2007% of the revenues of the entire company. The analytical service itself was established in XNUMX. The company divides the business areas of Moody's Analiytics into the following segments:
- Research, Data & Analytics (RD&A)
- Enterprise Risk Solutions (ERS)
Moody's expanded its analytics department 15 years ago. He is slowly becoming the "other leg" of the Moody's business. During these years, the average annual rate of return was 12%. Most of the growth was organic (over 60%). However, some resulted from acquisitions of smaller competitors. The acquisitions were aimed at extending the company's offer and the potential for cross-selling.

Source: company presentation
In Q2021 94, customer retention (annual) was 7%, combined with a 1% increase in revenues from existing customers (price increase and upgrades) means that average revenue from customer retention is growing by 8%. The company still reports that new sales (existing and new customers) are growing by 8%. However, the company does not report how much of this XNUMX% growth comes from existing customers.
Source: company presentation
The company strives to ensure that the company's products help their customers make better business decisions. Moody's Analytics offers, among others portfolio monitoring tools, industry analyzes, economic modeling tools, and risk management tools. The company's services are used by over 3100 companies, 1500 asset managers, 2900 banks and 670 insurers.
The segment's revenues increased by $ 2020 million, i.e. 123% y / y in 6,3. 2020 was quite a difficult year for the company. Sales clearly slowed down. The revenue growth rate was significantly lower than the average annual rate of return in 2016-2020 (+ 13,7% CAGR).
Source: own study based on the company's annual reports
The mentioned area of the company's operation is less profitable than MIS. Operating profitability has improved steadily over the past three years.
Source: own study based on the company's annual reports
R, D & A
This is the most important segment of Moody's Analytics. He is responsible for over 72% of MA's revenues. Revenues increased by USD 241 million, i.e. 18,9% y / y. It should be noted that the growth in 2020 was lower than the average annual growth rate of the R, D & A segment in 2016-2020 (+ 22,7% CAGR). The increase was also due to the acquisitions of companies such as RDC, ABS Suite and Acquire Media.

Source: company's annual report
| R, D & A | 2016 | 2017 | 2018 | 2019 | 2020 |
| revenues | $ 668 million | $ 833 million | $ 1134 million | $ 1273 million | $ 1514 million |
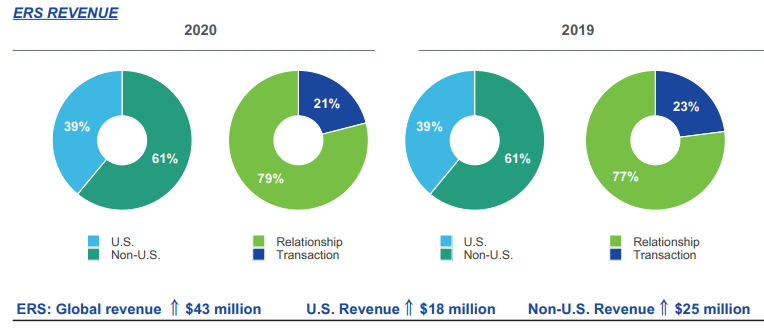
ERS
This segment is responsible for approximately 27% of Moody's Analytics revenues. Revenues increased by $ 43 million, i.e. 8,2% y / y. It should be noted that the growth in 2020 was slightly higher than the average annual growth rate of the R, D & A segment in 2016-2020 (+ 7,8% CAGR).
Source: company's annual report
| ERS | 2016 | 2017 | 2018 | 2019 | 2020 |
| revenues | $ 419 million | $ 449 million | $ 437 million | $ 522 million | $ 565 million |
Management
- Robert Fabuer - CEO of Moody's - he will be in the position soon, from January 2021. Robert Fabuer has been working at Moody's since 2005, so it's an internal promotion. Before being promoted to the position of CEO, he worked in the company as Chief Operating Officer. In the years 2016 - 2019 he was the president of the Moody's Investors Service (MIS) division. Previously, he was the head of the MIS product and service development division for three years. Prior to Moody's, he worked for many years at Citi in positions related to alternative investments and investment banking.
- Mark Kaye - CFO Moody's - has been CFO since August 2018. Prior to joining the company, Mar Kaye was Director of Financial Planning and Analysis for the Massachusetts Mutual Life Insurance Company. Between July 2015 and February 2016, he worked as a CFO in the same company.
- Stephen Tulenko - is the head of the Moody's Analytics (MA) department. He has been playing this role since November 2019. Sthephen Tulenko has been working at Moody's since 1990. Between 2013 and October 2019, he worked as a Director in the Enterprise Risk Solutions (ERS) segment. Previously, he worked for five years as the head of Sales and Marketing and Customer Service.
- michael west - is the head of the Moody's Investors Service (MIS) department. He has been working in this position since November 2019. Previously, he was responsible for the Ratings and Research department at MIS (June 2016 - October 2019). Between 2014 and 2016, he worked at Moody's as the head of Structured Finance. Michael West has been working at Moody's since 1998.
Shareholding structure
Moody's like S&P Global Inc. does not have a concentrated shareholding structure. It is dominated by financial institutions and investment vehicles. The largest shareholder is Berkshire Hathaway, the investment vehicle of the legendary investor - Warrenn Buffett. It is also worth mentioning that the shareholding structure includes such well-known funds as Akre Capital or Baillie Gifford & Company.
| Shareholder | % of shares |
| Berkshire Hathaway Inc. | 13,27% |
| Vanguard group | 7,25% |
| Blackrock | 6,01% |
| State Street | 3,87% |
| TCI Fund Management | 3,53% |
Fundamental analysis
Financial results
Moody's, like its competitor S&P Global Inc. is a very stable and profitable company. Having a very strong market position in the rating segment means that the company has a very strong moat which is its reputation. At the same time, the market itself is characterized by high entry barriers (legal, reputation, scale of operation), so that the newly emerging competition is not yet able to threaten the big three of the ratings market. The company, due to its reputation and the industries in which it operates, can achieve very good margins on operating activities. It is also worth mentioning that the company manages its capital very effectively, which can be seen in the very high return on equity. It is also worth mentioning that the return on invested capital (ROIC) fluctuated between 19% -22%. This is less than in the case of S&P Global (approx. 28%). Moody's has very little equity due to generous profit sharing with shareholders and numerous acquisitions. However, due to the business model, the risk of liquidity loss in the short and medium term is low.
| $ Million | 2017 | 2018 | 2019 | 2020 |
| net income | 4 204 | 4 443 | 4 829 | 5 371 |
| operational profit | 1 832 | 1 916 | 2 071 | 2 459 |
| operating margin | 43,58% | 43,12% | 42,89% | 45,78% |
| net profit | 1 001 | 1 310 | 1 422 | 1 778 |
| equity capital | -115 | 656 | 837 | 1 763 |
| ROE | - | 199,70% | 169,89% | 100,85% |
| earnings per share (EPS) | 5,15$ | 6,74$ | 7,42$ | 9,39$ |
Source: own study based on the company's annual reports
Cash generated
The company generously shares the generated cash with shareholders. Over the past 4 years (2017-2020), Moody's generated just over $ 5,6 billion in free cash (cash generated from operating activities less capital expenditure). The generated cash was used for acquisitions, dividends and share purchases.
Within four years, the company has allocated to:
- acquisitions of $ 4 million,
- dividends of $ 1 million
- stock purchases of $ 2 million
| $ Million | 2017 | 2018 | 2019 | 2020 |
| OCF | 755 | 1 461 | 1 675 | 2 146 |
| CAPEX | - 91 | - 91 | - 69 | - 103 |
| FCF | 664 | 1 370 | 1 606 | 2 043 |
| acquisitions | - 3 511 | - 289 | - 162 | - 897 |
| dividend (-) | - 290 | - 337 | - 378 | - 420 |
| share buyback (-) | - 249 | - 265 | - 1 068 | - 607 |
Source: own study based on the company's annual reports
Debt structure
At the end of 2020, Moody's had $ 6 million of long-term interest debt and $ 422 million of short-term interest debt. The company's liquidity position in the coming years is very good. Below is a list of potential liability payments:
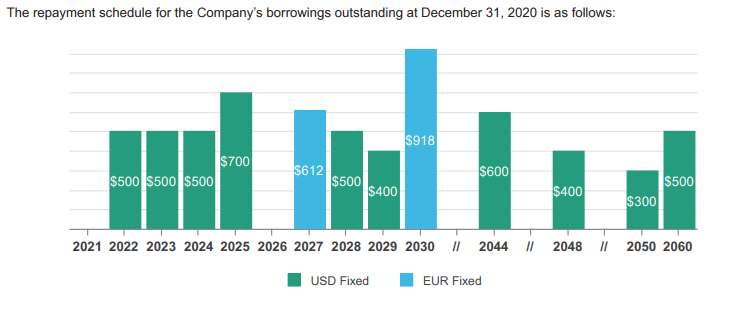
Source: company's annual report for 2020
Moody's has no problems with debt management. It is also worth comparing the ratio of nominal net debt to EBITDA in recent years has been falling and is at a safe level.
| $ Million | 2017 | 2018 | 2019 | 2020 |
| net debt * | 4 361 | 3 863 | 4 225 | 4 248 |
| EBITDA | 1 990 | 2 108 | 2 271 | 2 679 |
| debt / EBITDA | 2,19 | 1,83 | 1,86 | 1,59 |
Source: own study based on the company's annual reports * net debt also includes financial liabilities to former employees before tax.
Competition
Due to the fact that the company has a very diversified activity, it has a lot of competition that competes with the company in individual segments. For example, S&P Global competes with Moody's in the segment of ratings and analytical tools. Below is a brief summary of selected competitors listed on the public market.
S&P Global Inc.
The company's history dates back to 1888 when James H. McGraw acquired the American Journal of Railway Appliances. In turn, the origins of the credit rating agency itself date back to 1860. S&P Global (SPGI) is the company's largest competitor. SPGI operates on the rating market (one of the Big Three members), index providers (also a leading company) and analytical tools. The S&P Global is one of the components of the S&P 500 index.
| $ Million | 2017 | 2018 | 2019 | 2020 |
| revenues | 6 063 | 6 258 | 6 699 | 7 442 |
| operational profit | 2 751 | 2 961 | 3 159 | 3 867 |
| operating margin | 45,37% | 47,32% | 47,16% | 51,96% |
| net profit | 1 496 | 1 958 | 2 123 | 2 339 |
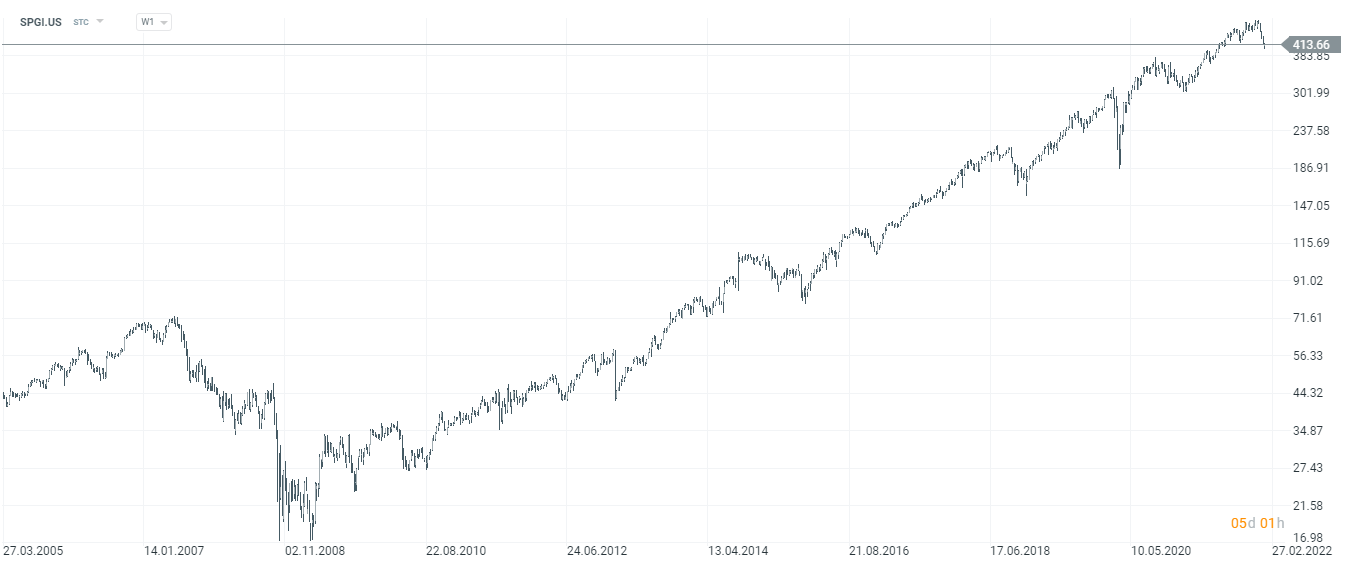
SP GIobal chart, interval W1. Source: xNUMX XTB.
factset
It is one of the companies providing tools for professional investors operating on the capital market. The company's solutions are used by sell-side and buy-side analysts and managers of investment funds and hedge funds. FactSet competes with companies such as Bloomberg, S&P Global and Thomson Reuters. All the mentioned companies try to provide extensive market information. The company tries to take over smaller suppliers of market data in order to expand the product offer. The current capitalization of the company is $ 18 billion.
| $ Million | 2018FY | 2019FY | 2020FY | 2021FY |
| revenues | 1 350,1 | 1 435,4 | 1 494,1 | 1 591,4 |
| operational profit | 371,1 | 438,0 | 439,7 | 474,0 |
| operating margin | 27,49% | 30,51% | 29,43% | 29,79% |
| net profit | 267,1 | 352,8 | 372,9 | 399,6 |

FactSet Chart, Interval W1. Source: xNUMX XTB.
Verisk Analytics
The company was founded in 1971. It is one of the components of the S&P 500 index. The company provides data analysis and risk management services. The company's clients include companies operating in the insurance, mining and other financial sectors. The Verisk company serially takes over smaller competitors, which increases its market offer. For example, in 2015, Verisk acquired Wood Mackenzie, which provided data for companies from the chemical, mining and metallurgical industries, for $ 2,8 billion. Verisk's current capitalization is approximately $ 36 billion.
| $ Million | 2017 | 2018 | 2019 | 2020 |
| revenues | 2 145,2 | 2 395,1 | 2 607,1 | 2 784,6 |
| operational profit | 808,0 | 835,6 | 831,1 | 1 020,9 |
| operating margin | 37,67% | 34,89% | 31,88% | 36,66% |
| net profit | 555,1 | 598,7 | 449,9 | 712,7 |

Verisk plot, interval W1. Source: xNUMX XTB.
Summation
In fact, the rating market is controlled by three companies, including the listed S&P Global. Due to the fact that the largest companies take over most of the market orders, they can pay their employees more (effect - better quality of staff) and maintain a really healthy operating margin. At the same time, in the coming years it is difficult to take seriously the appearance of a disruptor who will drastically change the rules of the game. One of the great strengths of Moody's and S&P is the so-called social consensus. In short, it means that "a rating from Moody's or S&P is worth more than a credit rating given by anyone else." For this reason, if a company needs a credit rating, it will most likely choose someone in the big three. Not because the ratings are the best in terms of content. The main reason is completely different. The rating awarded by agencies with such a great reputation are treated more seriously in the financial market than those carried out by an "unknown institution", as a result the cost of debt may be lower.
However, it should be borne in mind that the so-called The "brand" is very dependent on the company's reputation. This in turn can theoretically be quite easily destroyed. If Moody's misjudges the health of a business, which in turn leads to a major bankruptcy, there is a chance that "brand stability" may be impaired. It is worth recalling that the scandal that broke out in Enron led to the disappearance of the "unsinkable" institution such as Arthur Andersen from the market. The biggest threat to the rating industry occurred in the years 2007-2009. At that time, many structured financial instruments were assigned a high rating (so-called investment), despite the fact that the quality of assets on which these instruments were based was of questionable quality. During this period, even Moody's main shareholder, Berkshire Hathaway, raised concerns about the potential loss of reputation by leading rating agencies. However, the dark scenario did not materialize and none of the Big Three lost their license. As a result, the Moody's brand survived the turmoil. Shareholders benefited from this, earning over 10% over the past 1000 years thanks to their investment in the company's shares. The reason for such a high rate of return was the increase in the scale of business, effective capital management and regular return of excess cash to shareholders. Past performance is no guarantee of obtaining similar results in the future, however, Moody's business model is characterized by very high profitability, low capital requirements (asset light business) and operates in a growing market. Each year, new bonds are issued and new debt is incurred. This gives the company room for development. It is also worth bearing in mind that the company tries to generate recurring revenues that ensure greater stability than transactional revenues.
It is also worth mentioning that the company's development potential is still large. The Chinese and Indian markets seem particularly attractive. Currently, the Chinese debt market is one of the largest in the world.
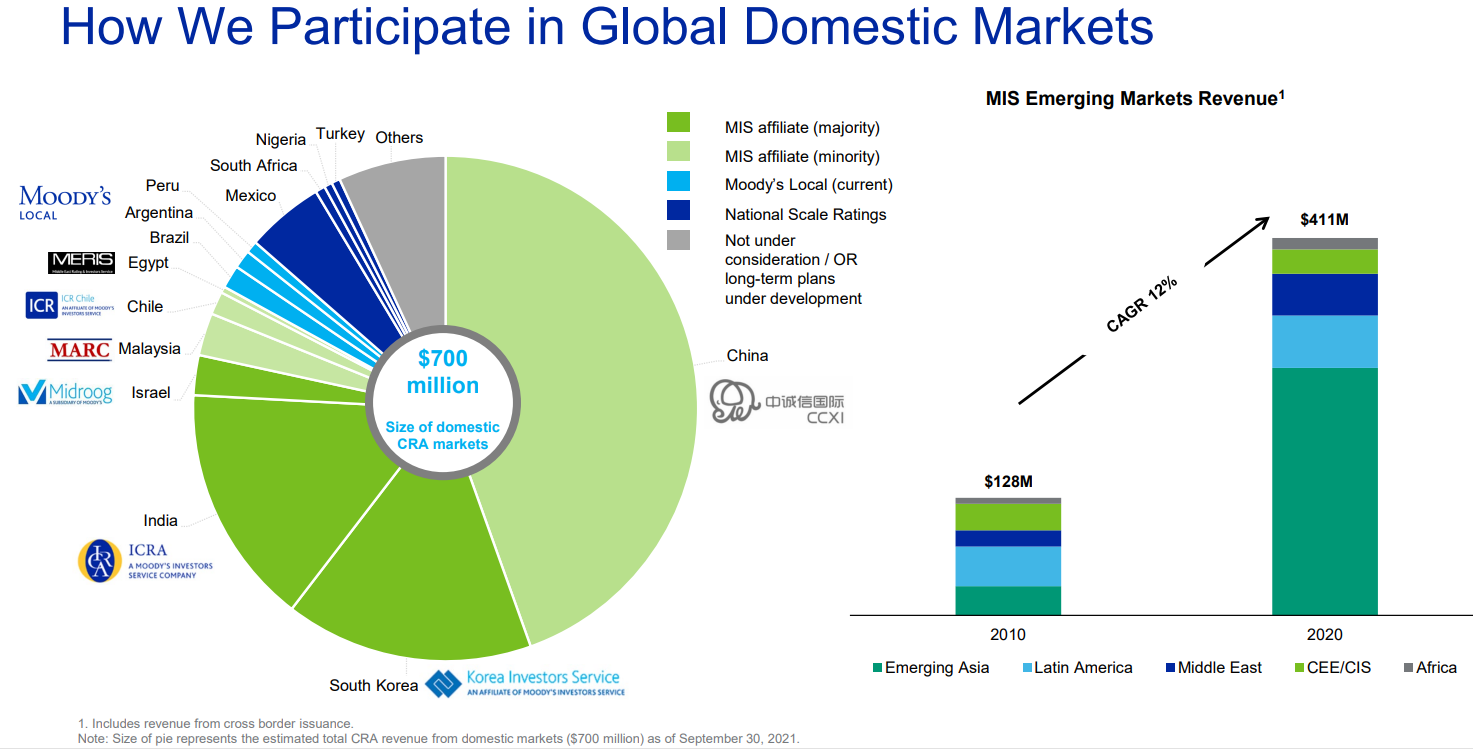
Source: company presentation
Moody's owns a 30% stake in the Chinese entity CCXI, which specializes in assigning ratings to Chinese debt that is targeted at foreign investors. Currently, China is the second largest onshore bond market in the world. The market grew by an average of 2012% in the years 2020 - 20 and its value is estimated at around 17 trillion dollars.
The high quality of the company is noticed by investors. Moody's current capitalization is in excess of $ 63 billion. This means that the entire company is currently valued at around 28 times next year's profits.


Leave a Response