


Multi Trend Signal - as many as 9 indicators in one [MT4]

A clear and orderly chart is a great help for the trader, which is why today we will focus our attention on the Multi Trend Signal indicator. It is a tool that perfectly fits into a solution that is to be readable, useful and easy to interpret, but also effective.
Construction of the Multi Trend Signal indicator
As the name suggests, the Multi Trend Signal indicator consists of many others, namely nine indicators:
- MACD - convergence rate and divergence of moving averages. It is a type of oscillator and a trend tracker based on moving averages. Used to determine the momentum of a given market.
- ADX - trend indicator. Its task is to correctly identify the direction and strength of the trend prevailing on the market.
- RSI - provides information about the strength of the price movement on the chart.
- MOMENTUM - helpful in determining whether the market is in an overbought or oversold area.
- CCI - an oscillator that measures the force behind price changes. It allows us to easily assess whether there are bulls or bears on the market. It has strong similarities with the indicator Momentum.
- Eighth - MACD derivative. OsMA is an abbreviation of the term moving average oscillator (MA). OsMA is a technical indicator that shows the difference between an oscillator and its moving average over a given period of time.
- PARABOLIC SAR - it is primarily used to determine the trend prevailing on the market. It draws "dots" on the chart, which give a signal of an uptrend when they are below the current price and a downtrend when they are above the current price.
- WPR - differently Williams' Percent Range. Is a type of momentum indicator that moves between 0 and -100, measuring overbought and sell-out levels.
- AVINGAGE MOVING - moving average, one of the most popular indicators of technical analysis. It is the average price of a set number of candles backwards, the so-called periods.
Installation and operation
Multi Trend Signal is not a standard indicator on MT4, therefore it must be downloaded separately. As in any other case, the downloaded file must be moved to the directory Indicators. After restarting the platform, the indicator can be found in the tab Own.
Be sure to read: How to add custom tools to MetaTrader 4
The indicator works based and interestingly as the sum of all the above.
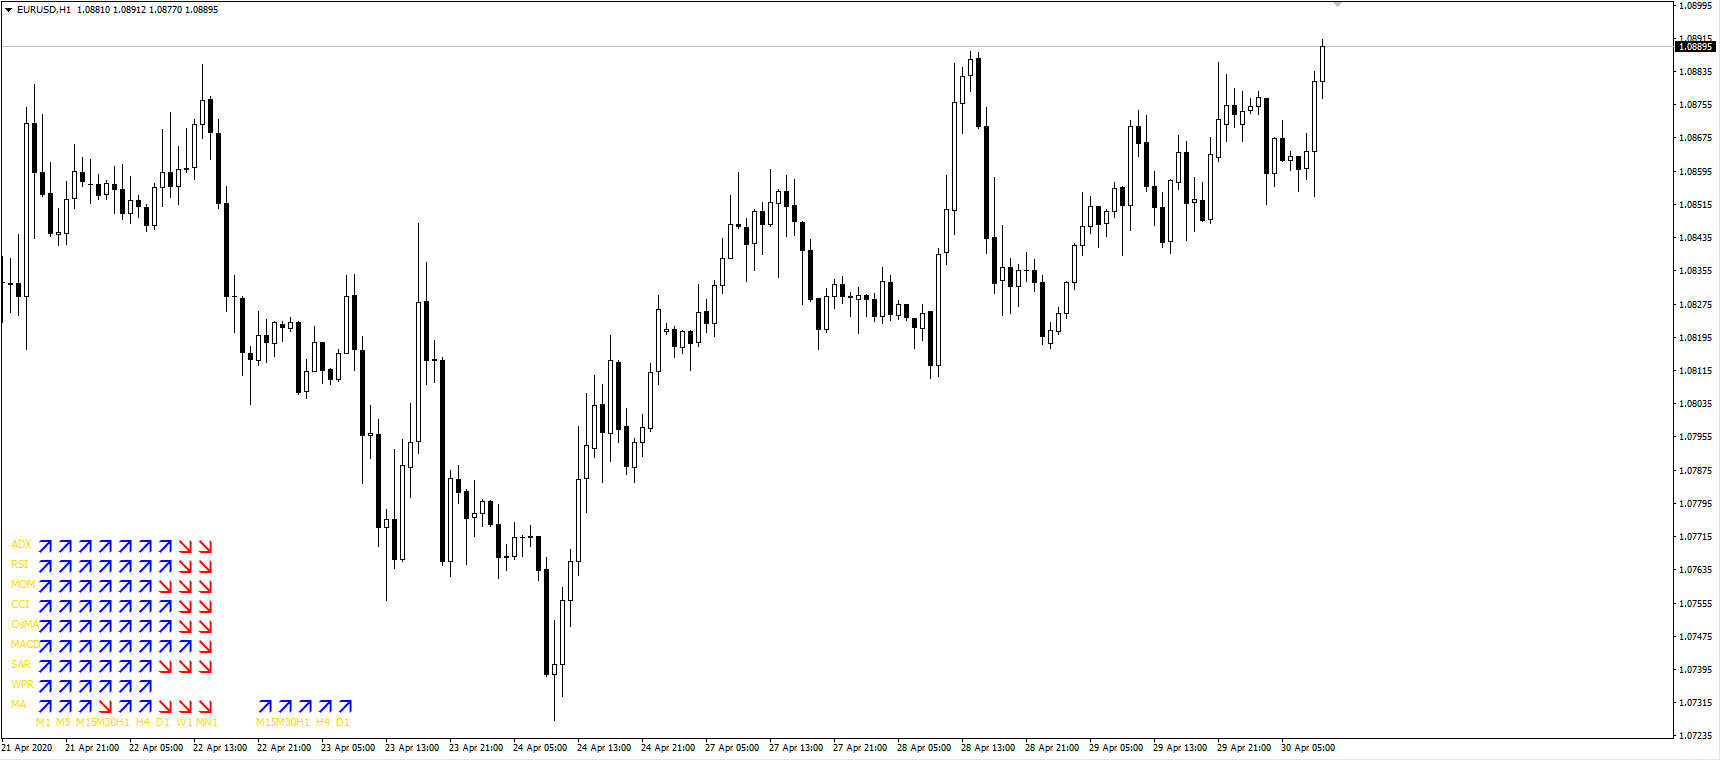
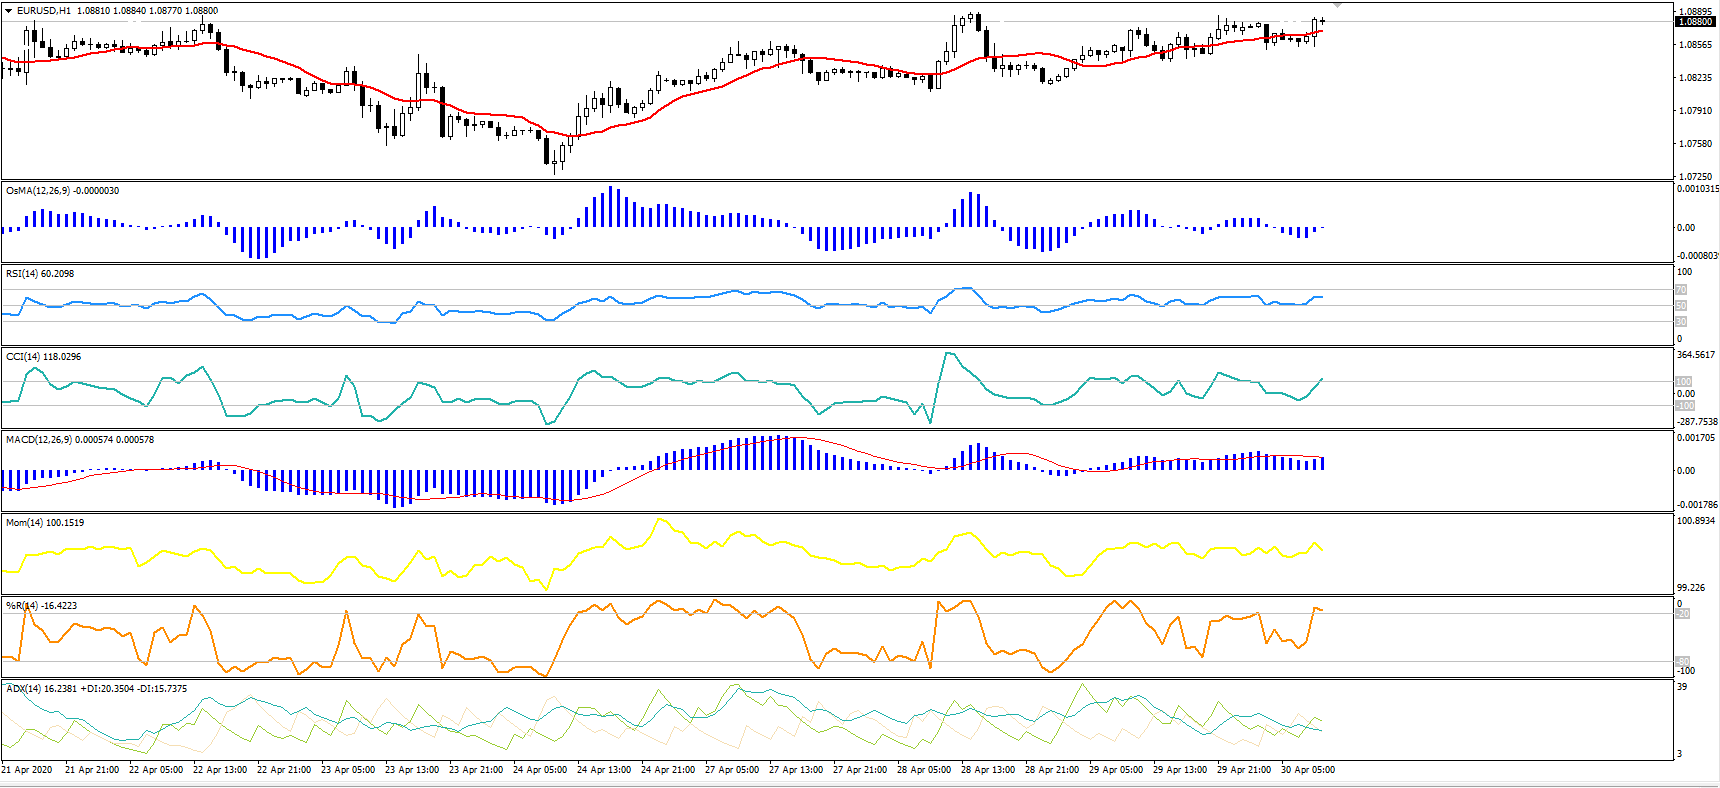
For comparison, this is the graph with all 9 indicators placed on it.
The indicator will always be visible in the bottom left corner of the chart. Unfortunately, it is not possible to move it and thus place it elsewhere. First, we see a summary of all 9 indicators from the interval M1 to MN1, while next to it we have a summary of the signals as the sum of all together. This, in turn, is only from the interval M15 to D1. Application the indicator can be used in two variants, dividing our trade as follows:
1. Conservative approach - high probability of success, but much less signals.
-
- ENTRY POINT: when all 9 indicators show movement in the same direction for a given time period -> we make a trade -> BUY / SELL
- STARTING POINT: when all 9 indicators point to the same time interval in the opposite direction, we close the transaction.
2. Aggressive approach - balanced probability of success, but also more frequent signals:
-
- ENTRY POINT: when 7 out of 9 indicators point in the same direction for a given time period -> we enter into a transaction -> BUY / SELL
- STARTING POINT: when 7 of the 9 indicators point in the opposite direction at the same time -> we close the trade
Conclusions and final assessment
Multi Trend Signal does not show us graphically what the situation looks like on individual indicators. Instead, we obtain information and signals simply and legibly based on their entire set of indications. It can serve as an additional tool for our trade due to the low invasiveness of the chart. An additional solution will be to set 9 indicators on the chart on an additional screen or window to view the situation on individual indicators.
Advantages:
- Works on every instrument
- It accurately shows the current trend,
- It doesn't take up much space on the chart,
- It's easy to interpret
- It can be used in many investment strategies using trend movements.
Disadvantages:
- Too late shows signals at low time intervals (M1 and M5),
- Rather not useful when scalping,
- With high variability, it is often late.


Hello,
Duplicating oscillators is pointless. Sorry but this is pointless as all oscillators almost show the same thing. Some (like ADX) are very delayed, so we introduce confusion in our own trading, it could end tragically ...
Regards,
Jim
Even to confirm the indications? Not all indicators are infallible, in my opinion it's better to look at a few. Trusting only one does not lead to anything good.
Hello,
In the eyes of appearances, looking at a few indicators especially indicating impetus introduces confusion. How will you behave when 2 of them show a signal and three do not? You should know one but from the ground up so that you become an expert. So that you will meet
all the nuances, wrong and good signals, when it works correctly and when it does not and
how he behaves in every situation. When you deal with several
pointers you have to do with each of them. This is a huge task. Believe
when it comes to making quick decisions, there is not much about it
indicators on the chart. Lack of experience in trading leads to "undercutting the branch we are sitting on" - observation of many indicators, especially from this
the group itself leads to total confusion, lack of certainty as to the signals
and I will not mention the introduction of fear when opening a position. The author of this
the article has no experience as a trader, hence he writes about something he does not understand.
Believe me, when you trade 5 lots you will not wonder if 9 indicators show correct indications or not.
Regards,
Jim
Regards,
Jim
Hello.
If only one shows the signal and three do not, then I do not open the position.
The pointer 🙂 can be moved
In the corner parameter, enter a value from 1 to 4 and then adjust the X and Y 🙂 coordinates
Why does this indicator remove my trend lines and R / S lines after changing the interval?
The reason for this is unknown, I tried to reinstall it, change the values, but the problem keeps repeating itself. The only solution is to set this indicator on a separate chart to keep a preview of it.