


Germany - Economy and demography [part AND]

The German economy is the largest in Europe. Reliability, precision and patience are words associated with our western neighbors. To this day, the brand "Made in Germany" is synonymous with quality. Germany also boasts a strong representation of Fortune 500 companies. In 2019, there were 28 companies. Among them, companies such as Volkswagen, Daimler, Siemens, Adidas and Bayer. However, it is not a country without problems. Some have been unsolved for over 30 years.
Check it out: Brokers offering trading on DAX 30 - Summary
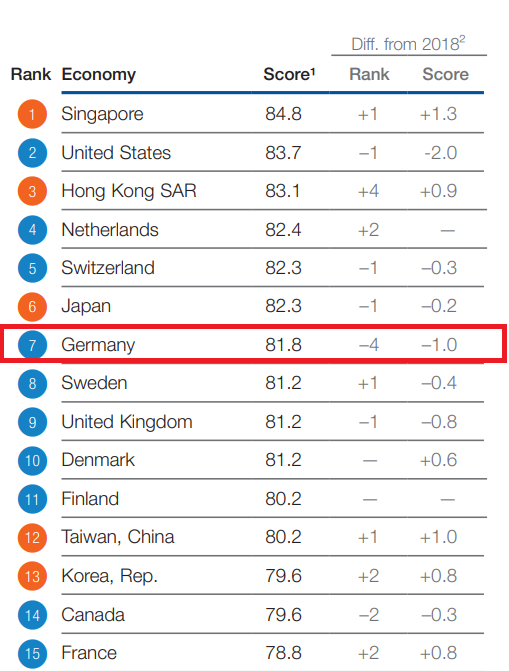
Germany is one of the most developed countries in the world. This is confirmed by numerous rankings. One of the most important is Global Competitiveness Index. The competitiveness index determines the country's development based on 12 variables:
- Institutions
- Infrastructure
- Stability of the macroeconomic environment
- Health and basic education
- Higher education
- Market efficiency
- Labor market efficiency
- Financial market
- Technological adaptability
- Market size
- Advancement of the production process
- Innovation
Source: Global Competitiveness Index
Poland ranks 37th in the aforementioned ranking, behind Malaysia, China, Chile and Portugal
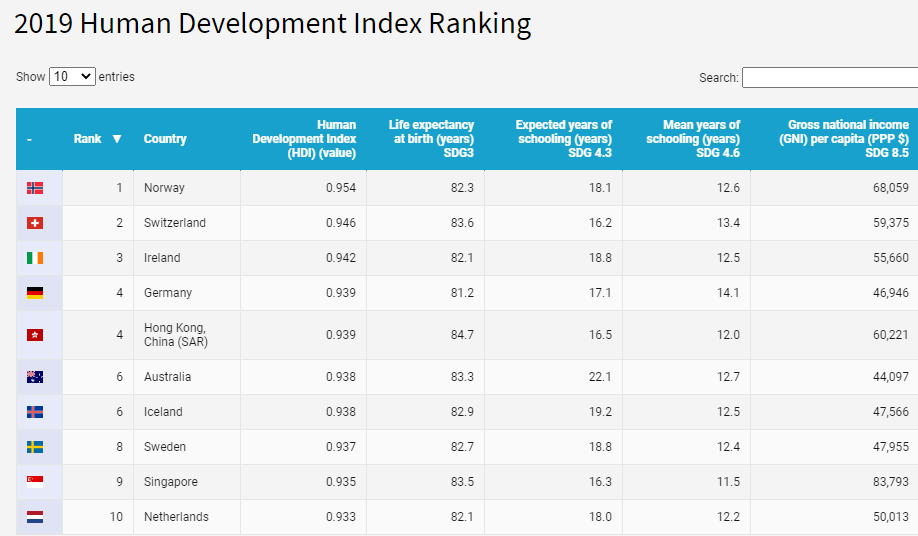
Another index confirming the high development of Germany is the human development index (Human Development Index, HDI). The index assesses countries in terms of: expected quality of life, quality of education, and national income per person. Below is a summary from 2019:
Source: UN Developmet Program
Germany ranks 4th in the world. The United States is 16th, Poland is 32nd.
Germany also performs well in the ranking Corruption Perceptions Index (Corruption Perception Index) prepared by Transparency International. The higher the position in the ranking, the more law-abiding the country is. The lower the position in the ranking, the higher the level of corruption. Germany is 9th in this ranking, the United States is 23rd, while Poland is 41st.
Economic development over the years
The German economy is the driving force of the European Union. As the largest economy in continental Europe, it is the main partner of many smaller European economies. According to data from the World Bank, in 2019 the German economy was the 4th largest in the world ($ 3 billion). This meant 845% of the global GDP. In terms of purchasing power parity, Germany ranks 4,4th (behind China, the USA, India and Japan).
Over the past 28 years, Germany's economic growth has been decent. Between 1991 and 2019, GDP growth in purchasing power parity increased by 3,71% annually. As the world grew faster, Germany's share of the world's GDP fell significantly. Below is a compilation of the World Bank.
|
GDP (PPP) |
1991 |
2005 |
2010 |
2019 |
|
Germany |
$ 1 billion |
$ 2 billion |
$ 3 billion |
$ 4 billion |
|
World |
$ 30 billion |
$ 66 billion |
$ 89 billion |
$ 135 billion |
|
% share of world GDP |
5,43% |
3,96% |
3,57% |
3,43% |
Germany is one of the most developed economies in the world. Below is a World Bank summary:
|
GDP (PPP) per person |
1991 |
2005 |
2010 |
2019 |
|
Germany |
$ 20 |
$ 31 |
$ 38 |
$ 56 |
|
USA |
$ 24 |
$ 44 |
$ 48 |
$ 65 |
|
World |
$ 5 |
$ 10 |
$ 12 |
$ 17 |
|
% US |
86,09% |
72,07% |
80,42% |
86,08% |
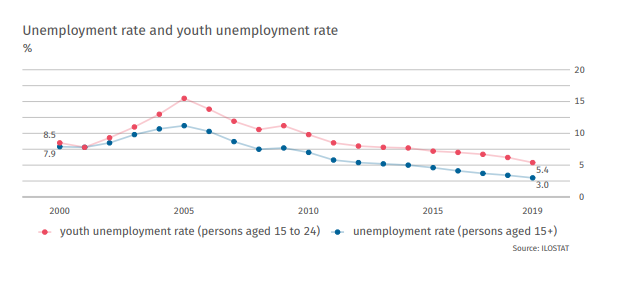
Economic growth led to a decline in unemployment, which is one of the lowest in the entire European Union. According to ILOSTAT, the current unemployment rate of people aged 15-24 in 2019 was only 5,4%. The overall unemployment rate is 3%.
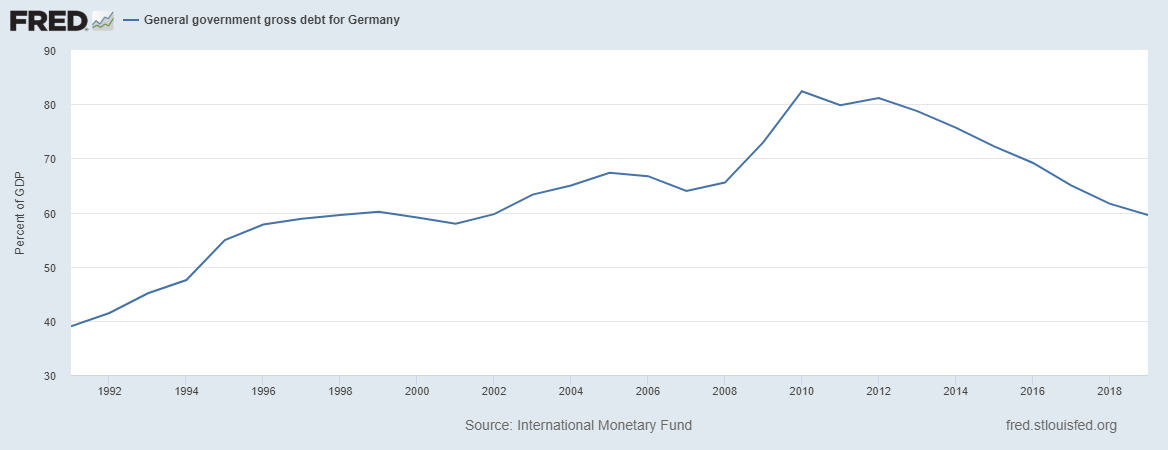
Good economic situation and conservative fiscal policy of the government led to the generation of a budget surplus.
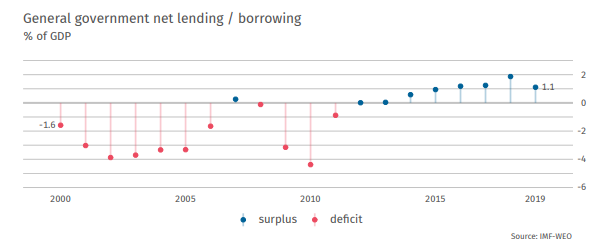 This led to a significant decline in the debt-to-GDP ratio, which fell below 2019% in 60. Government aid for the economy carried out in 2020 will lead to an increase in the debt-to-GDP ratio to around 77% at the end of 2020.
Economic forecasts 2050
According to a 2017 PwC report, the German economy will drop from 5th to 9th in terms of GDP after purchasing power parity. Germany is to outrun, among others Mexico and Indonesia. According to forecasts, GDP will grow by 1,1-1,4% annually. In turn, GDP per capita is expected to increase to $ 82,7 thousand by the end of 2050. It is to constitute 94% of the level achieved by the USA.
Banking sector
Due to the low interest rate environment and the economic problems faced by Germany's trading partners, the results of German banks were under pressure. This is especially true of flagship banks such as Deutsche Bank (DBK) and Commerzbank (CBK). Deutsche Bak is running a restructuring program to reduce employment by 18 by 000. In turn, Commerzbank tried to find a buyer for its "pearl in the crown", i.e. the Polish mBank. After the unsuccessful sale, the brand still belongs to CBK. At the same time, the company announced that it would reduce employment by 2022 employees and close about 7 branches in Germany.
World Trade
The German economy is export-oriented. For this reason, Germany values its partners' openness to markets and low customs duties. Below is a comparison of selected countries:
|
Exports of goods and services as% of GDP |
1991 |
2005 |
2010 |
2019 |
|
Germany |
23,67% |
38,06% |
42,56% |
46,97% |
|
USA |
9,66% |
10,01% |
12,32% |
11,72% |
|
China |
14,49% |
33,83% |
27,18% |
18,42% |
|
Poland |
N/A |
34,61% |
40,05% |
55,75% |
|
World |
19,20% |
28,59% |
28,92% |
30,62% |
Source: World Bank
A good term for the openness of the German economy is the trade openness index, which defines the relationship between trade (exports and imports) and a country's GDP. The higher the index, the greater the role of international trade in the country's economy.
|
Trade as% of GDP |
1991 |
2005 |
2010 |
2019 |
|
Germany |
47,82% |
70,92% |
79,87% |
88,09% |
|
USA |
19,79% |
25,56% |
28,06% |
26,39% |
|
China |
25,95% |
62,21% |
50,72% |
35,69% |
|
Poland |
N/A |
70,28% |
82,11% |
106,24% |
|
World |
38,53% |
56,09% |
57,03% |
60,40% |
Source: World Bank
Germany is a trading tycoon. According to data from the World Trade Organization, in 2019 Germany was the 3rd largest exporter and importer in the world (behind the United States and China). Germany had a 7,9% share in world exports and a 6,4% share in world imports. Since 1993, Germany has generated a surplus in international trade every year. Its level "shot up" since 2002. This coincided with the introduction of the euro.
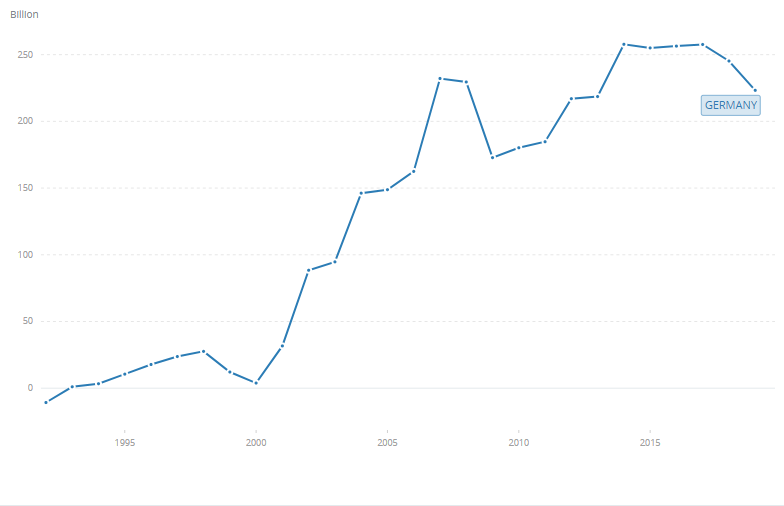
Source: World Bank
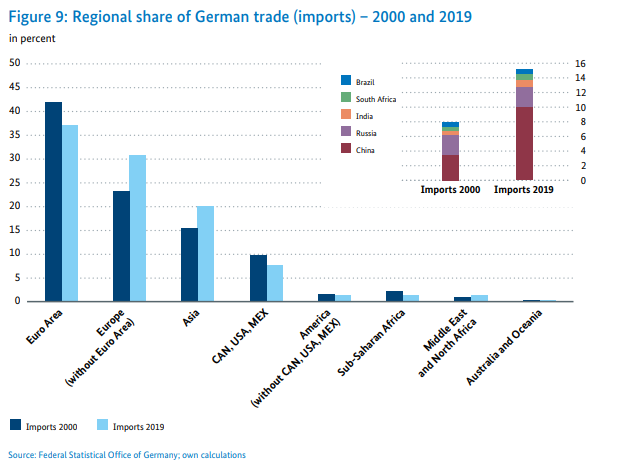
German trade remains concentrated in Europe. According to data from the Federal Ministry of Economy and Energy (BMWI), about 68,2% of exports go to Europe, while imports from Europe account for as much as 68,8% of total imports.
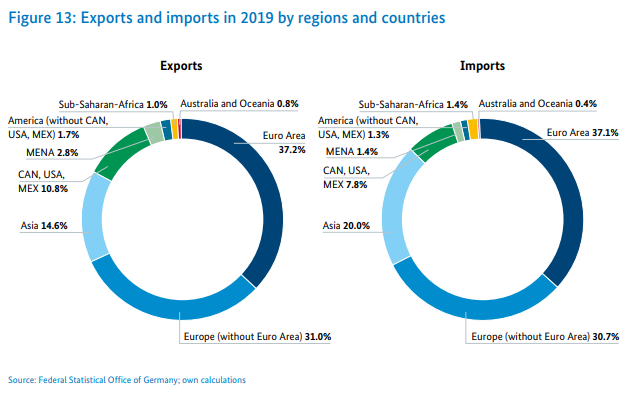
Source: Federal Ministry for Economics and Energy
However, in recent years, a slow shift of trade (exports and imports) towards Asia and European countries outside the Eurozone has been observed.
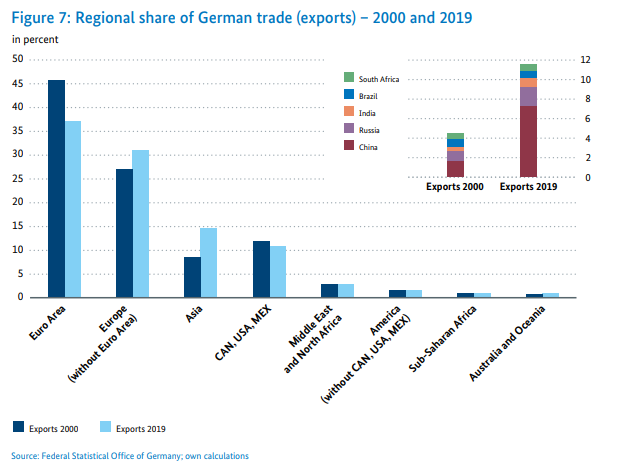
Source: Federal Ministry for Economics and Energy
Source: Federal Ministry for Economics and Energy
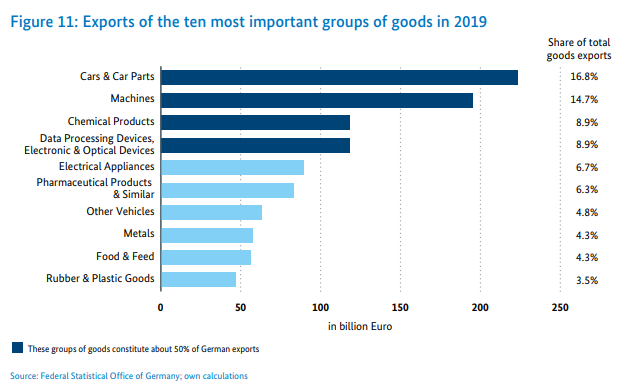
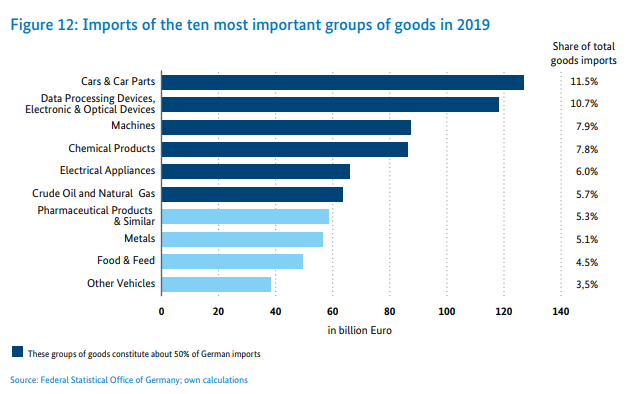
Germany is known worldwide for its products related to the automotive, machinery and chemical sectors. Below is a summary of the most popular product groups in export and import.
Source: Federal Ministry for Economics and Energy
Source: Federal Ministry for Economics and Energy
Germany's largest trading partners are China (EUR 206 billion in trade), the Netherlands (EUR 190,1 billion) and the United States (EUR 190 billion). Poland is the 6th largest partner with a trade exchange of € 123,6 billion.
Where does German export go - the main partners
The largest recipients of German goods are the United States (€ 118,6 billion), France and China. The table of the 10 most important export directions is presented below. Information on the volume of exports to Japan and India was also added.
|
Place |
End |
Turnover value (billion €) |
|
1 |
USA |
118,6 |
|
2 |
France |
106,7 |
|
3 |
China |
96,0 |
|
4 |
The Netherlands |
91,6 |
|
5 |
Great Britain |
78,9 |
|
6 |
Włochy |
68,1 |
|
7 |
Austria |
66,1 |
|
8 |
Poland |
65,9 |
|
9 |
Switzerland |
56,4 |
|
10 |
Belgium |
46,1 |
|
16 |
Japan |
20,7 |
|
23 |
Indie |
11,9 |
Source: Federal Statistical Office
Where does Germany import from - the main partners
The largest turnover is generated by Germany with China, the Netherlands and the USA. Poland is in fifth place. India is a marginal partner. They occupy only 27th place. Countries such as Vietnam, Slovakia and Denmark export more than India to Germany.
|
Place |
End |
Turnover value (billion €) |
|
1 |
China |
110,0 |
|
2 |
The Netherlands |
98,5 |
|
3 |
USA |
71,4 |
|
4 |
France |
66,0 |
|
5 |
Poland |
57,7 |
|
6 |
Włochy |
57,2 |
|
7 |
Czech |
48,9 |
|
8 |
Switzerland |
46,3 |
|
9 |
Austria |
44,1 |
|
10 |
Belgium |
43,1 |
|
15 |
Japan |
24,0 |
|
27 |
Indie |
9,4 |
Source: Federal Statistical Office
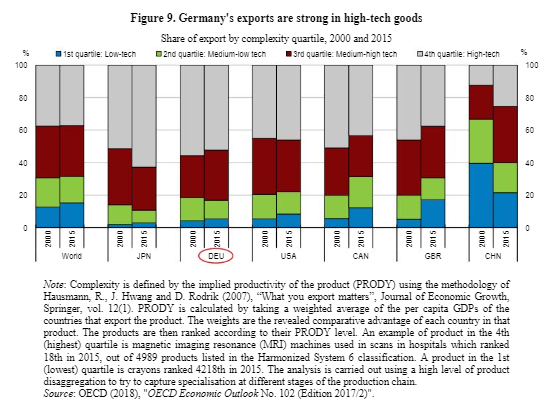
Despite high labor costs, Germany manages to generate a high trade surplus. This is partly due to the structure of exports. Technically advanced products dominate.
Source: OECD
West and East or Germany "A" and "B"
Despite 30 years of integration between the "East" and "West" of Germany, when looking at the economic data, you can still see where Germany once existed, and where the GDR existed. The five Länder of the former GDR are the poorest in terms of GDP per capita. The division into "Wessi" (citizens of the former West Germany) and "Ossi" (residents of the former East Germany) still exists among parts of the society.
|
region (2019) |
GDP per person |
"Former" West Germany / East Germany |
|
Hamburg |
€ 66 |
West Germany |
|
Brema |
€ 49 |
West Germany |
|
Bavaria |
€ 48 |
West Germany |
|
Baden - Witemberg |
€ 47 |
West Germany |
|
Hesse |
€ 46 |
West Germany |
|
Berlin |
€ 41 |
West Germany / East Germany |
|
North Rhine-Westphalia |
€ 39 |
West Germany |
|
Lower Saxony |
€ 38 |
West Germany |
|
Sahara |
€ 36 |
West Germany |
|
Rhineland - Palatinate |
€ 35 |
West Germany |
|
Schleswig-Holstein |
€ 33 |
West Germany |
|
Saxony |
€ 31 |
NRD |
|
Thuringia |
€ 29 |
NRD |
|
Brandenburg |
€ 29 |
NRD |
|
Mecklenburg-West Pomerania |
€ 28 |
NRD |
|
Saxony - Anhalt |
€ 28 |
NRD |
Source: Federal Statistical Office
The division between the "West" and "East" of Germany is also visible in the average wages, where the lowest is precisely in the eastern federal states (Berlin is the "island"). Below, data collected by the German employment office.
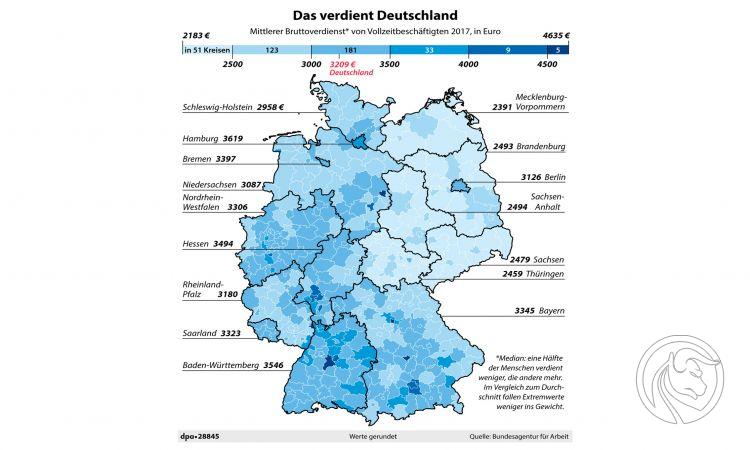
Source: deutschland.de
Wage convergence in the eastern federal states is very slow. Between 1995 and 2017, disposable income increased from 79% to 86% of the "West Germany" level.
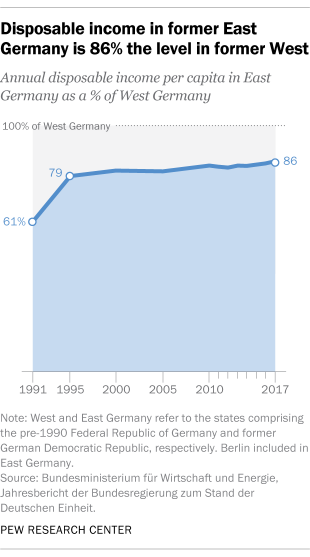
Source: pewresearch.org
The differences between the two parts of Germany are also visible in the views on the European Union or political parties. It is in the east of Germany (for example in Saxony) that the Alternative for Germany (AfD) party enjoys considerable popularity. In turn, the inhabitants of the western part of Germany are much more positive about the European Union.
Demography - an increase in the demographic burden
According to UN data, in 2019 the population of Germany amounted to 83,517 million. This means that Germany is the most populous member of the European Union. Germany's demographic forecasts assume a slight decline in the population and a change in the age mix.
According to the UN, Germany's population will shrink by 30 million over the next 3,4 years. Below is a comparison with 9 countries included in Western Europe (including Austria, Belgium, France, Switzerland, the Netherlands).
|
Country / Region |
2020 |
2050 |
CARG% |
|
Western Europe |
196,146 |
196,902 |
+ 0,012 % |
|
Germany |
83,784 |
80,104 |
-0,15% |
The data on the number of inhabitants differs from that provided by the Federal Statistical Office (Statistisches Bundesamt, abbreviation Destatis), which states that in 2019 the population of Germany amounted to 83,2 million.
The data and forecasts provided by Destatis are very extensive, which allows for a more detailed insight into the state of Germany's demographics.
Over the next 30 years, Germany's demographic structure will begin to change. People over the age of 67 will have an increasing share. According to data provided by Destatis, the current demographic structure in 2019 is as follows:
|
Age structure (2019) |
Number of people (million) |
% |
|
Over 66 |
16,1 |
19,35% |
|
20-66 |
51,8 |
62,25% |
|
Below 20 |
15,3 |
18,40% |
|
together |
83,2 |
100% |
Looking at the demographic structure, it can be seen that the boomers from 1955-1971 will retire in the next dozen or so years.
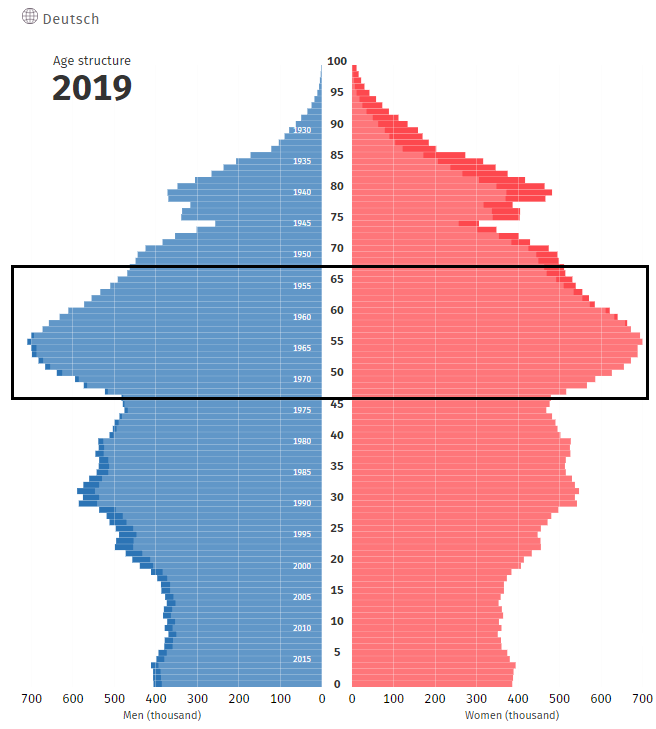
Source: Federal Statistical Office (Destatis)
This will worsen the indicator with the old-age dependency ratio. It is an index used to compare the post-working age population (usually over 65) to the working age population (e.g. 15-64). In the case of Germany, the indicator divides the number of people aged over 66 by those aged 20-66. The current index is 31,1. This means that for every 100 people of working age there are about 31 people of post-working age.
Below are 3 variants of the formation of the old-age dependency ratio depending on the adopted variant:
- Option 2 - average birth rate - average increase in life expectancy, average net migration
- Option 6 - low birth rate - average increase in life expectancy, average net migration
- Option 9 - average birth rate - high increase in life expectancy, average net migration
Numerical presentation of assumptions for individual variants:
|
destiny |
short |
average |
Tall |
|
Natural increase (2060) |
1,4 |
1,55 |
1,7 |
|
Life expectancy (2060) in years |
82,5 men 86,4 women |
84,4 men 88,1 women |
86,2 men 89,6 women |
|
Net migration |
147 a year |
221 a year |
311 a year |
Below is a breakdown of the demographic burden based on individual variants:
|
Old age dependency ratio |
2025 |
2035 |
2050 |
|
Variant 2 |
34,05 |
44,83 |
46,89 |
|
Variant 6 |
34,05 |
44,83 |
47,01 |
|
Variant 9 |
34,25 |
45,59 |
49,00 |
It can be seen that the worst deterioration of the indicator will occur between 2020 (31,1) and 2035 (over 44). The changes will not be so dynamic in the next 15 years.
Below is a summary of the demographic pyramids in Option 2 in 2035 and 2050.
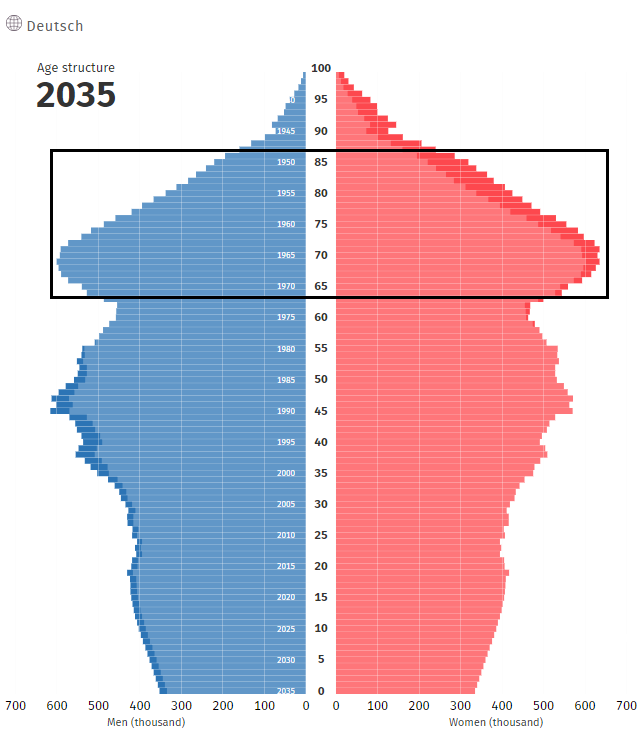
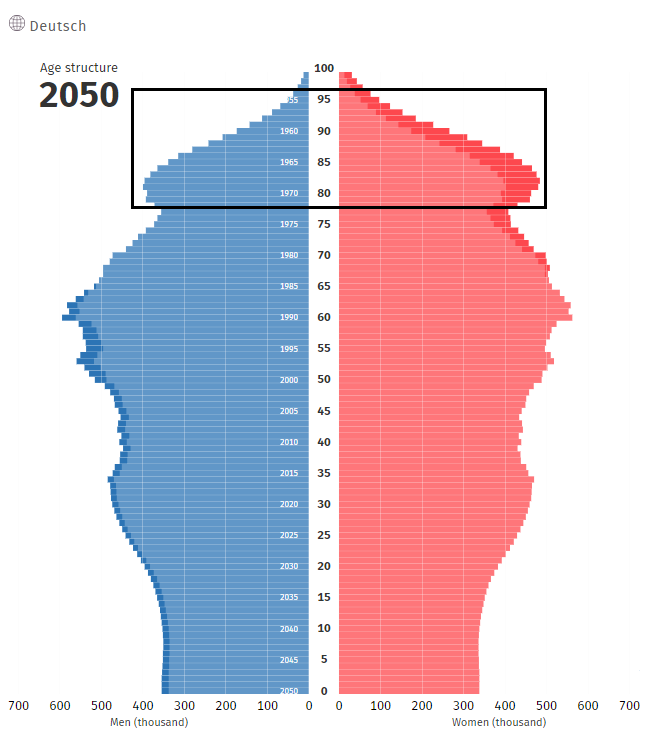
Germany's demographic situation will begin to deteriorate over the next 30 years. Although the population will not change much, the population will be aging. Citizens over 66 years of age will constitute an increasing percentage of the population. In a dozen or so years, the baby boom of 1955-1971 will increasingly burden the German pension system. However, in 2050 the demographic dependency ratio will be higher in Poland (52,2 according to Eurostat projections).
Summation
Germany is a stable economy that benefits from reducing trade barriers. Due to the growing demand from Asia, the export engine should continue to function. However, the burden of exports will change. Most likely, European partners will lose their key position to Asian partners (China, India). Conservative fiscal policy keeps the debt-to-GDP ratio at very safe levels. In the next dozen or so years, we should expect a deterioration of the demographic dependency ratio, which results from the slow retirement of the 1953-1971 age groups. Today's problems of Germany are endless integration between the "East" and "West" and the still difficult situation of the German banking sector.


Leave a Response