


First week of 2023 in the markets, inflation drops everywhere and NFP

The first week of the new year is behind us, which brought a lot of positives on the local financial market. Since the beginning of the year, mWIG40 has increased +5,9%, sWIG80 +5,2% (additionally, our indices have not yet had the opportunity to react to Friday's increases on Wall Street). In addition, on the inflation front, we had a strong drop in inflation in Poland in December 2022. Analysts expected a monthly change of +0,8%, but in fact it was only +0,2%.
The beginning of the year in the USA was less successful, but only until Thursdaywhen, after the close of the session, the S&P500 was "under the line" in 2023 with a result of -0,8%. In the US, everything changed on Friday in reaction to a strong employment report, but with a strong slowdown in wage growth (which is what the markets focused on). Stocks were also helped by the publication of the services PMI index on Friday, which fell sharply for December 2022 (ISM Services PMI). Despite many leading indicators pointing to an upcoming recession in the US, today's US economy and labor market are still in very good condition - and this may result in higher interest rate increases by the FED (unless, as in December 2022, along with growing employment and declining unemployment, we will continue to deal with a strong decline in wage growth).
First week of 2023: what are the markets playing at?
In the passing week of the new year Polish Stock indices rose quite strongly, also compared to other markets. mWIG40 grew the most (+5,8%), WIG20 the least (+3,6%). WIG is already 31,2% above the low of October 13.10.2022, 20 (WIG36,6 as much as 200%). The WIG index also remains quite well above its 9,7-session average, as much as XNUMX%.
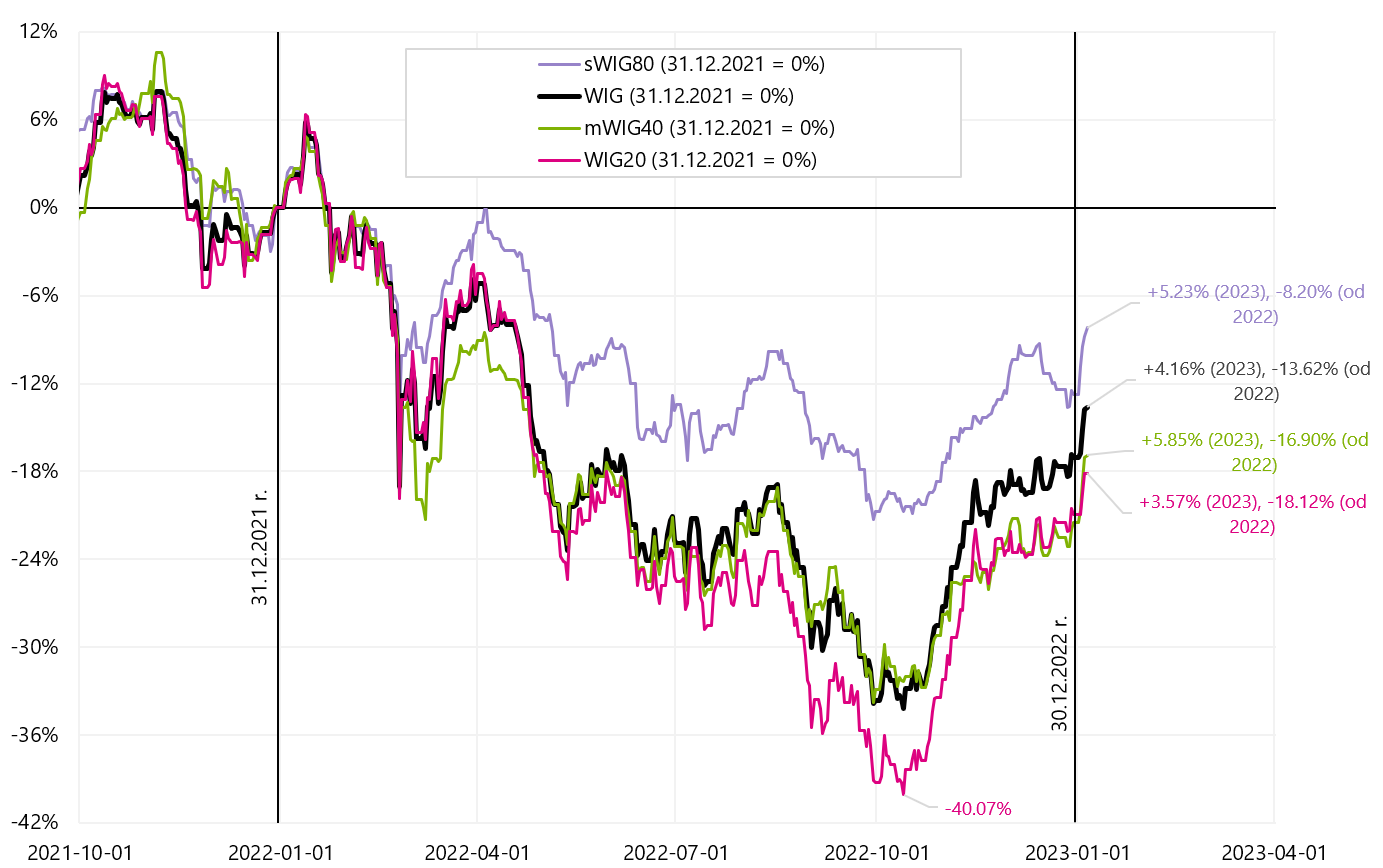
Polish stock indices until January 05.01.2023, XNUMX Source: own study, stooq.pl
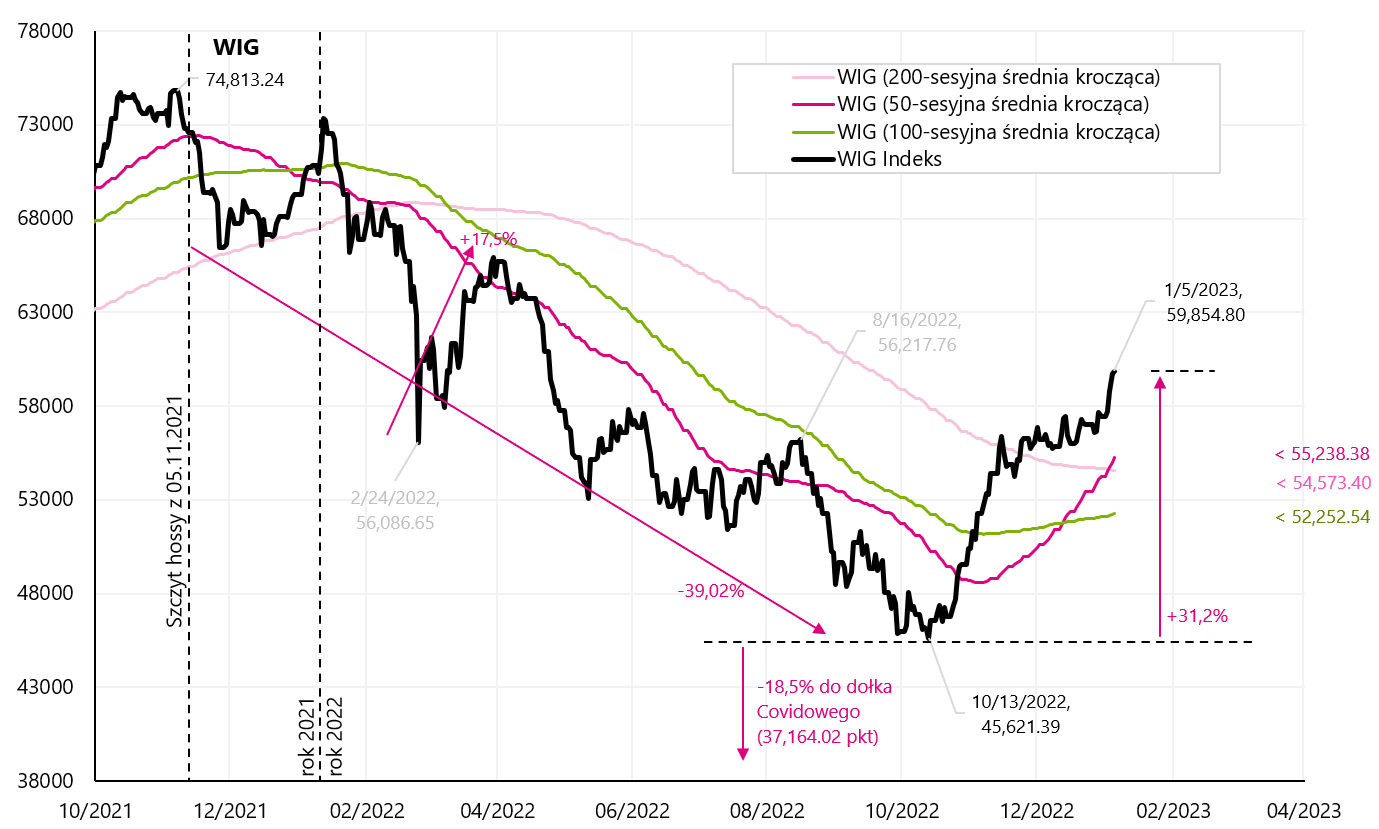
WIG index until January 05.01.2023, XNUMX Source: own study, stooq.pl
If we look at other equity indices, a very strong breakout in 2023 applies to Chinese and, to a lesser extent, European companies. The table below shows a comparison of various MSCI indices (expressed in USD) and sorted by 2023 YTD performance (up to 5.01.2023/XNUMX/XNUMX).
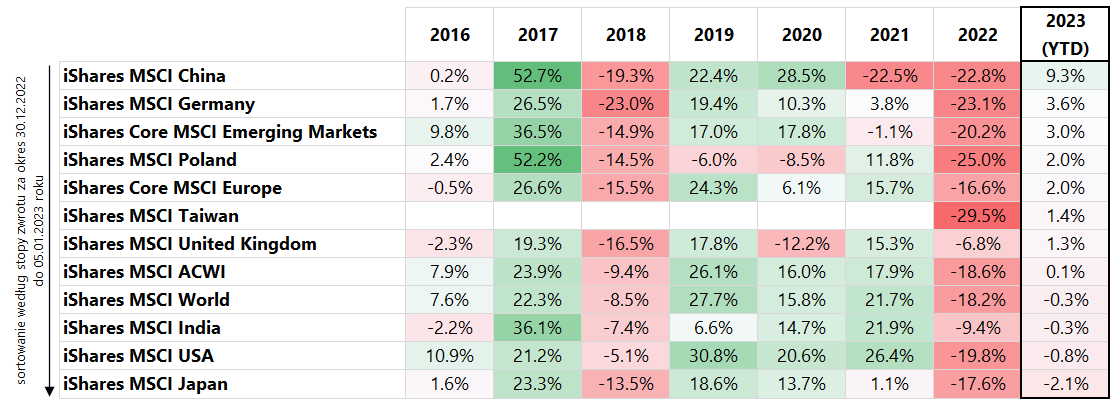
Rates of return for selected equity ETFs (based on MSCI equity indices). Source: own study, ishares.com
Generally, it can be said that markets at the beginning of 2023 played the opening of the Chinese economy and lower energy prices and lower inflation in Europe. The opening of the Chinese economy is also favorable to companies and the German economy (higher exports). Poland also benefits from this, although the result of the Polish MSCI index in USD is not as impressive as the Polish index in PLN. The zloty weakened against the dollar in 2023 panad 2% (until the publication of the US employment report on Friday). Of course, the "January effect" will also work, if only because investors did not learn anything new in 2023, which they did not know at the end of the previous year (maybe apart from lower inflation readings in Europe). The largest companies in the MSCI China index jumped up like a slingshot in the new year: TENCENT +5%, Alibaba +19%, MEITUAN +5%, JD +17%. Similarly, German companies: SAP +5%, Siemens +4%, Mercedes +8%, BASF +11%.
If we look at currencies, then the strengthening of the US dollar in 2023 does not match the rising stocks in the Emerging Markets. In general, a stronger dollar correlates more with weaker sentiment and a retreat from risky assets. In the case of government bond yields, 10-year bond yields fell by around 15 basis points in the US and 25 basis points in Germany, generally adjusting to lower inflation readings. However, short bonds (2Y US) did not react anymore. This was the situation until Friday, until the publication of the employment report, after which we had a sharp adjustment to lower wage growth in the US (the market ignored other data points showing no slowdown in the labor market). As a result, US stocks surged until the end of the session, the dollar weakened and 10-year bond yields plunged by another 15 basis points. The yields of 20-year US bonds also fell by 2 basis points (which is a very big move). We'll see next week if the "one data point" will sustain such movements in the markets.
While stock markets can discount the future and can "wait" for the full opening of the Chinese economy, the oil market does not discount the future, and the price of oil is determined by the current "imbalance" of supply and demand. From the point of view of additional demand for oil ... it is the Chinese economy that is not opening up yet (or elsewhere in Asia, demand for oil is falling, but warmer weather plus recession fears have done their job too). And you can see it after 10% oil price drop on the first two days of the new year. Interestingly, oil did not react at all to strong increases in stock prices and a drop in the dollar on Friday after the publication of employment data.
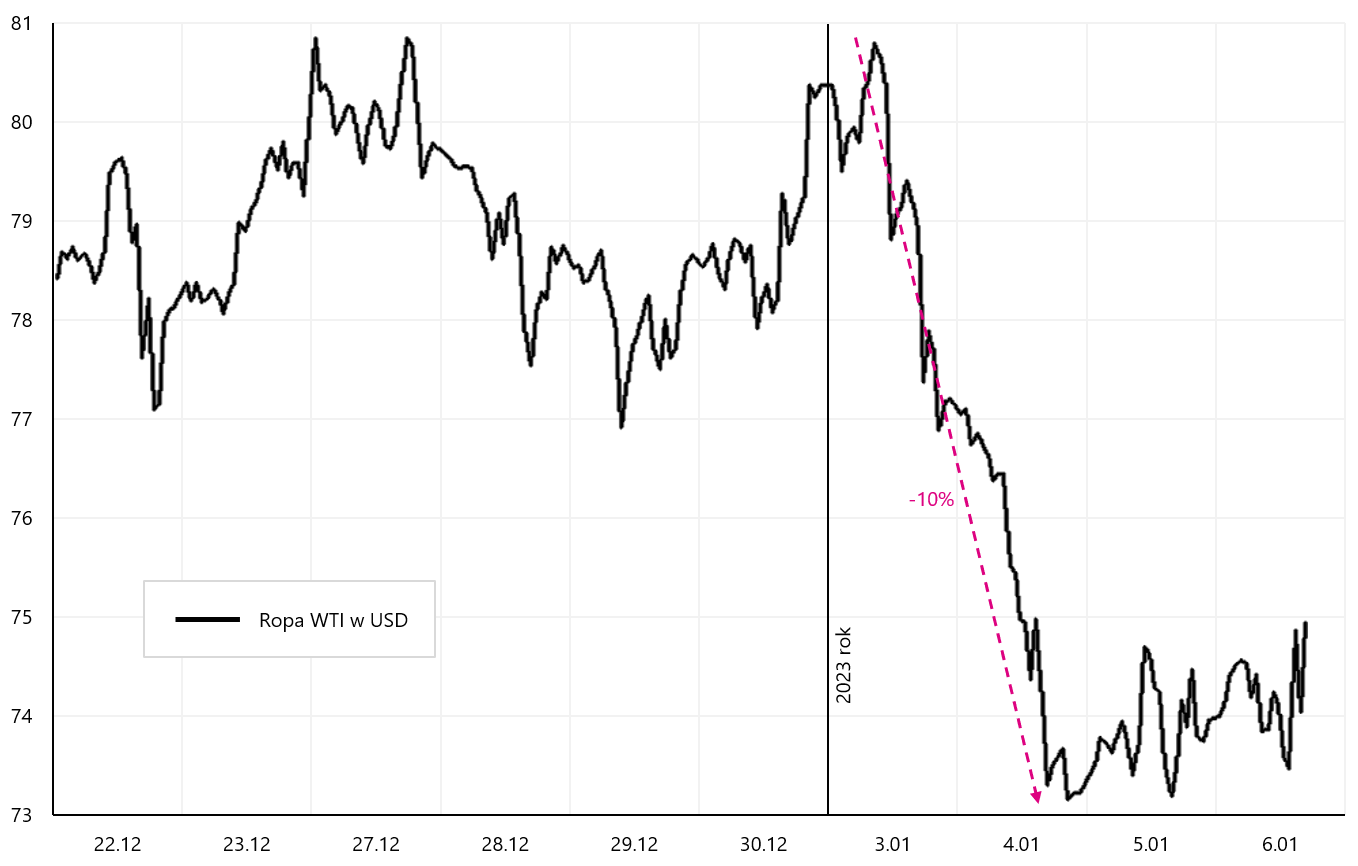
WTI oil price until January 06.01.2023, XNUMX Source: own study, stooq.pl
The past week for US stocks was less successful. After closing on Thursday, the S&P500 index was in the red this year (-0,82%) and only Friday's strong reaction to weaker wage growth (US employment report), together with a very weak ISM Services reading (also for December) allowed to close US stocks a week in the black with the result + 1,45 %. The ISM Services PMI fell to 49,6 in December (from 56,5 in November), with market expectations at 55,0 pts.
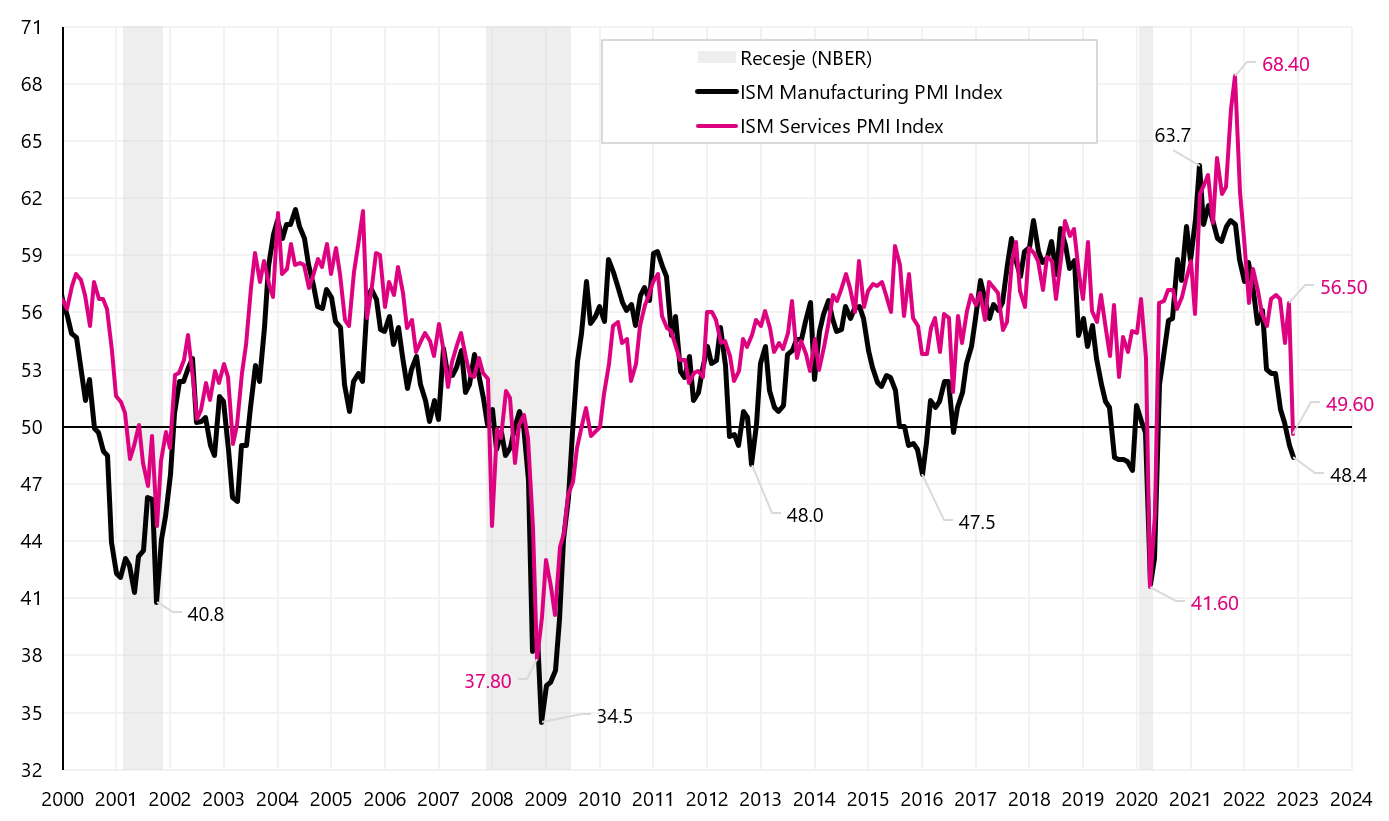
ISM Manufacturing PMI and ISM Services PMI for the US. Source: own study, ismworld.org
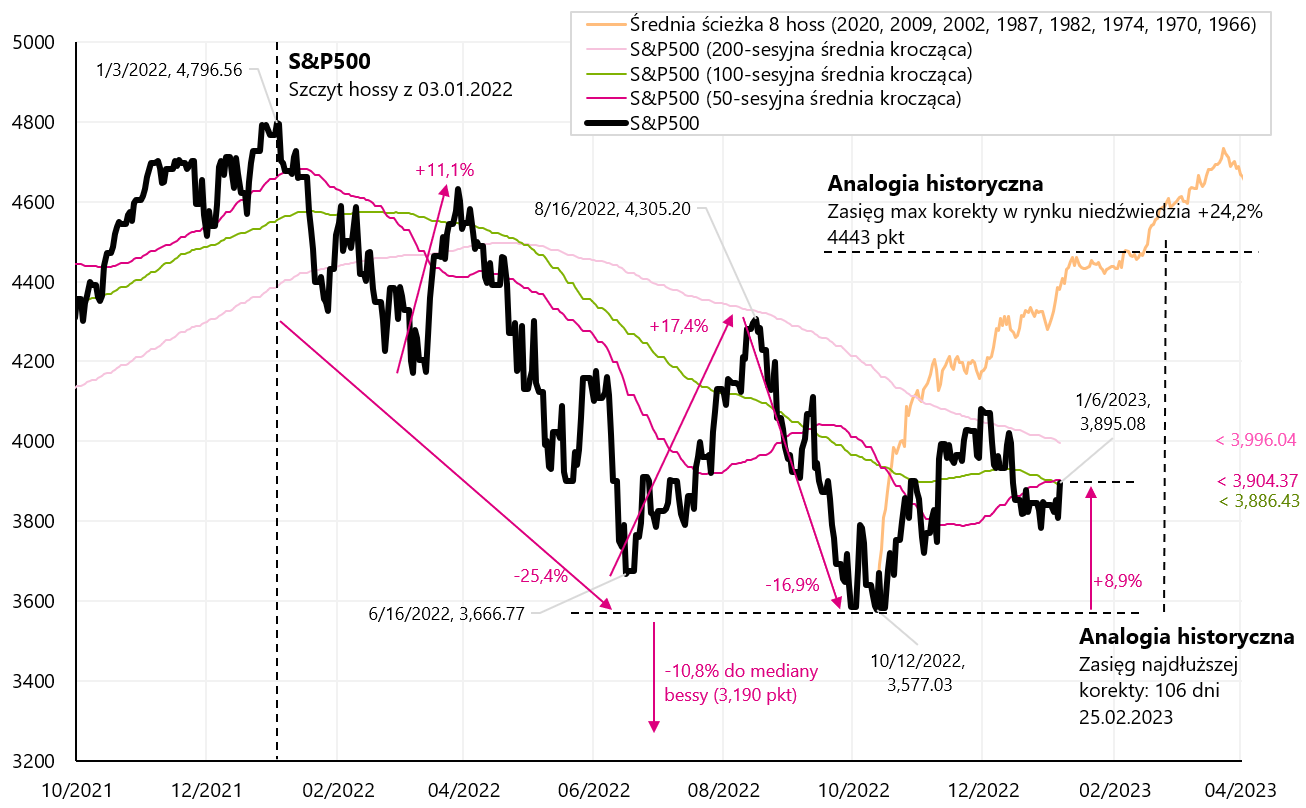
S&P500 index until January 06.01.2023, XNUMX. Source: own study, stooq.pl
Let's check how individual industries closed the week in the US. The table below presents a comparison of the rates of return for individual sub-indices for the S&P500 (items were sorted by the rate of return in 2023 to 06.01.2023/XNUMX/XNUMX).
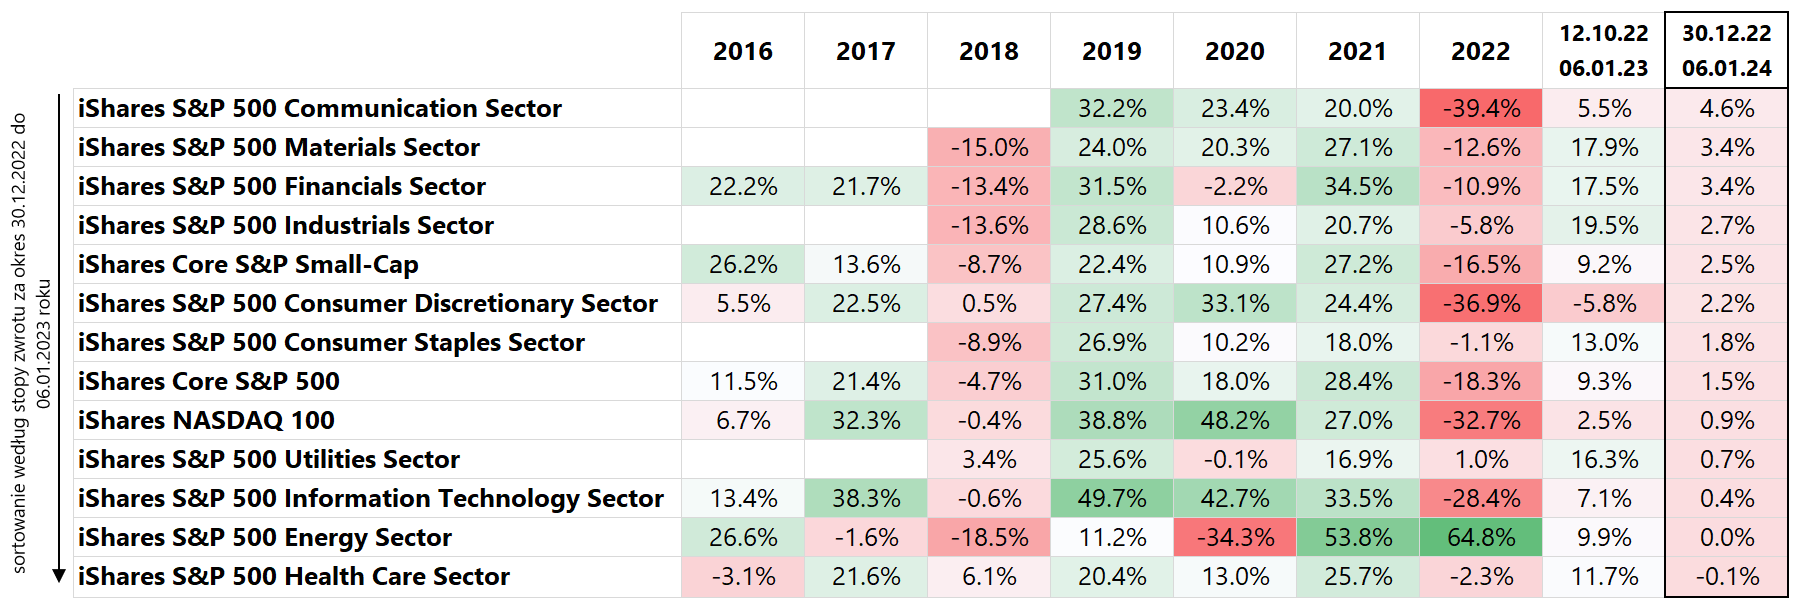
Rates of return for selected equity ETFs (based on various US equity indices). Source: own study, ishares.com
The Energy and Utilities sector performed the worst in 2023 (i.e. sectors that had great results in 2022). On the other hand, more cyclical sectors and with relatively weaker rates of return for 2022 fared better on the rebound. The penultimate column also shows the rates of return from the S&P500 low of October 12.10.2022, 5,8. For example, the results of the Consumer Discretionary (-16,3%) vs. Utilities (+13,0%) and Consumer Staples (+XNUMX%) industries indicate a "bearish" nature of the market rebound (investors "voting with their feet or more with their own money" still prefer defensive industries).
Inflation is falling almost everywhere, but not core
Inflation in Poland fell in December 2022 to 16,6%. Practically, mainly Energy, but also Food contributed to the decline in annual growth (from 17,5% in November). Nevertheless, core inflation rose again in December (and this is a new peak in the cycle). The situation is similar in other European countries, where the annual inflation rate decreased in December in 17 out of 19 euro area countries (inflation increased only in Malta from 7,2% to 7,3% and remained unchanged in Slovenia: 10,8%) . For all in the euro area, inflation fell from 10,1% to 9,2%, but core inflation increased from 5,0% to 5,2%. Energy prices in the euro zone fell by 6,5% in December.
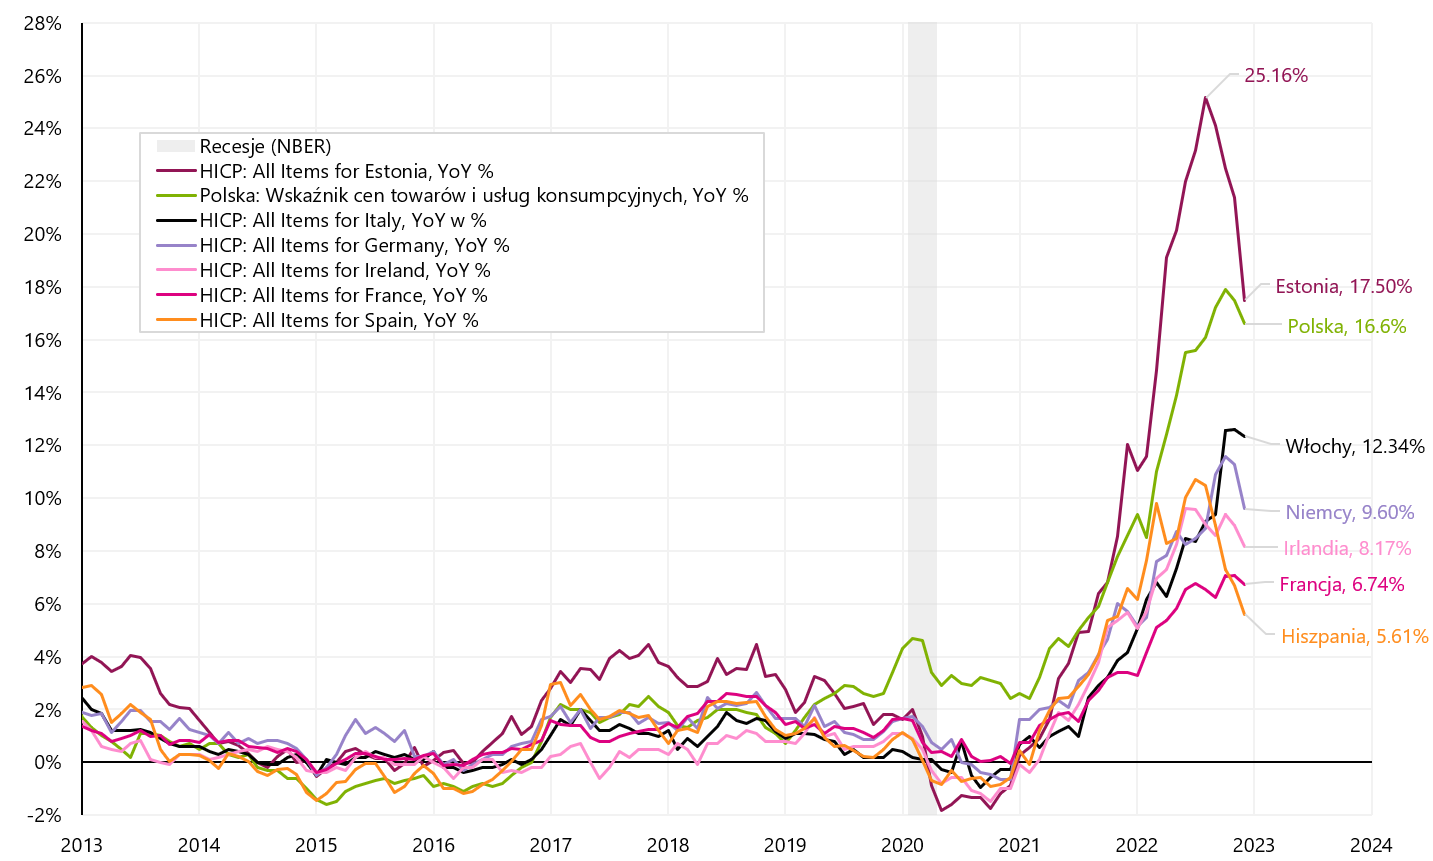
Inflation for selected European countries for December 2022. Source: own study, Eurostat
Core inflation continues to rise in the euro area and lags by at least a few months with core inflation in the US. In a similar way, it can be shifted in time (relative to Of the Fed) rhetoric ECB regarding further tightening of monetary policy (from this perspective, further hawkish message and further tightening of monetary policy by the ECB can be expected).
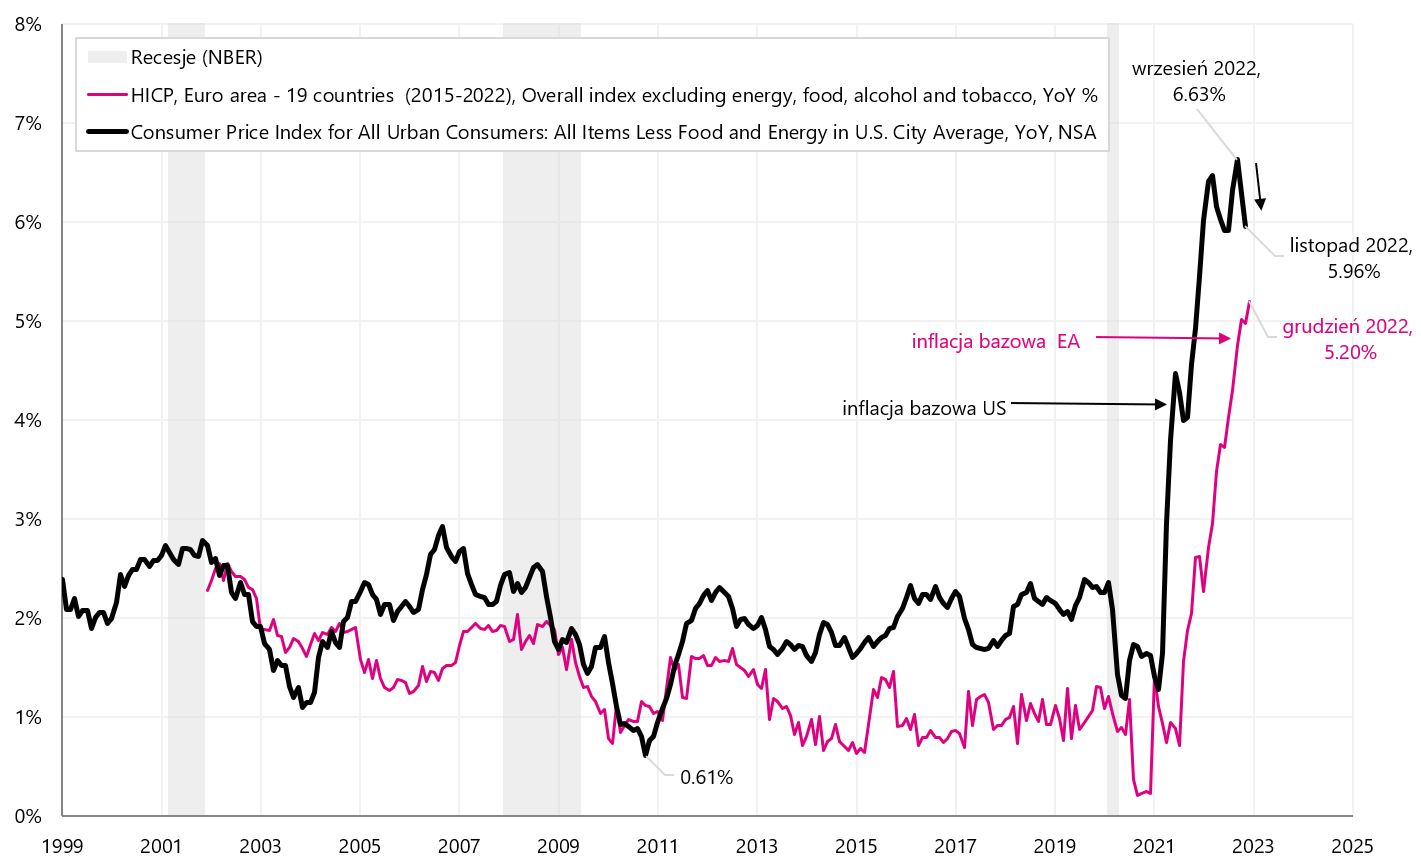
Core inflation in the US and in the Eurozone (EA – Euro Area). Source: own study, Eurostat, FRED
USA: the labor market is not going to slow down? But at least wage growth is declining
The labor market is the key to defeating inflation through lower wage growth and finally, a smaller contribution of salaries to the cost of services, which should mean lower prices of services and, finally, lower core inflation (especially core inflation of services other than housing). Despite the "waiting" by the markets and the FED for a slowdown in the labor market ... unfortunately, after the latest data, this slowdown is not yet visible:
- The demand for work definitely exceeds the available supply (job openings vs the number of unemployed),
- The increase in jobs is still above 200. jobs per month. Some hoped that the number of full-time jobs had been "inflated upwards" (the difference in job creation between the Establishment and Household surveys), but this gap began to decrease in December and in favor of higher, not lower, employment levels),
- Unemployment benefits do not increase, they even decrease, similarly the unemployment rate should start to increase (and in December 2022 the unemployment rate returned to the lowest level in the cycle of 3,50%),
- On the other hand, from good news, wage growth is declining (we had not only a decrease in growth in December, but also a downward revision for November and October 2022).
The markets reacted euphorically to the drop in wage growth during Friday's session. But what will the Fed do? Will wait for more data changing practically nothing in its plans regarding further monetary policy tightening. While the decline in wage growth is positive, it is only "one" data point for the Fed, but markets can "at their own risk" expect this to be the start of a strong downtrend in wage growth (while employment is up and unemployment is down) and beyond In the coming months, we will see further declines again, which will ultimately accelerate interest rate cuts by the FED.
Let's look at the basic data on the labor market. Labor demand can be expressed as the number of new open positions, the so-called "job openings" (i.e. newly created job positions by companies, for which these companies are actively recruiting). The supply of employees is in other words the number of unemployed. The chart below will show this relationship in the form of available "jobs" and available "workers" (this is exactly the chart that J. Powell looks at).
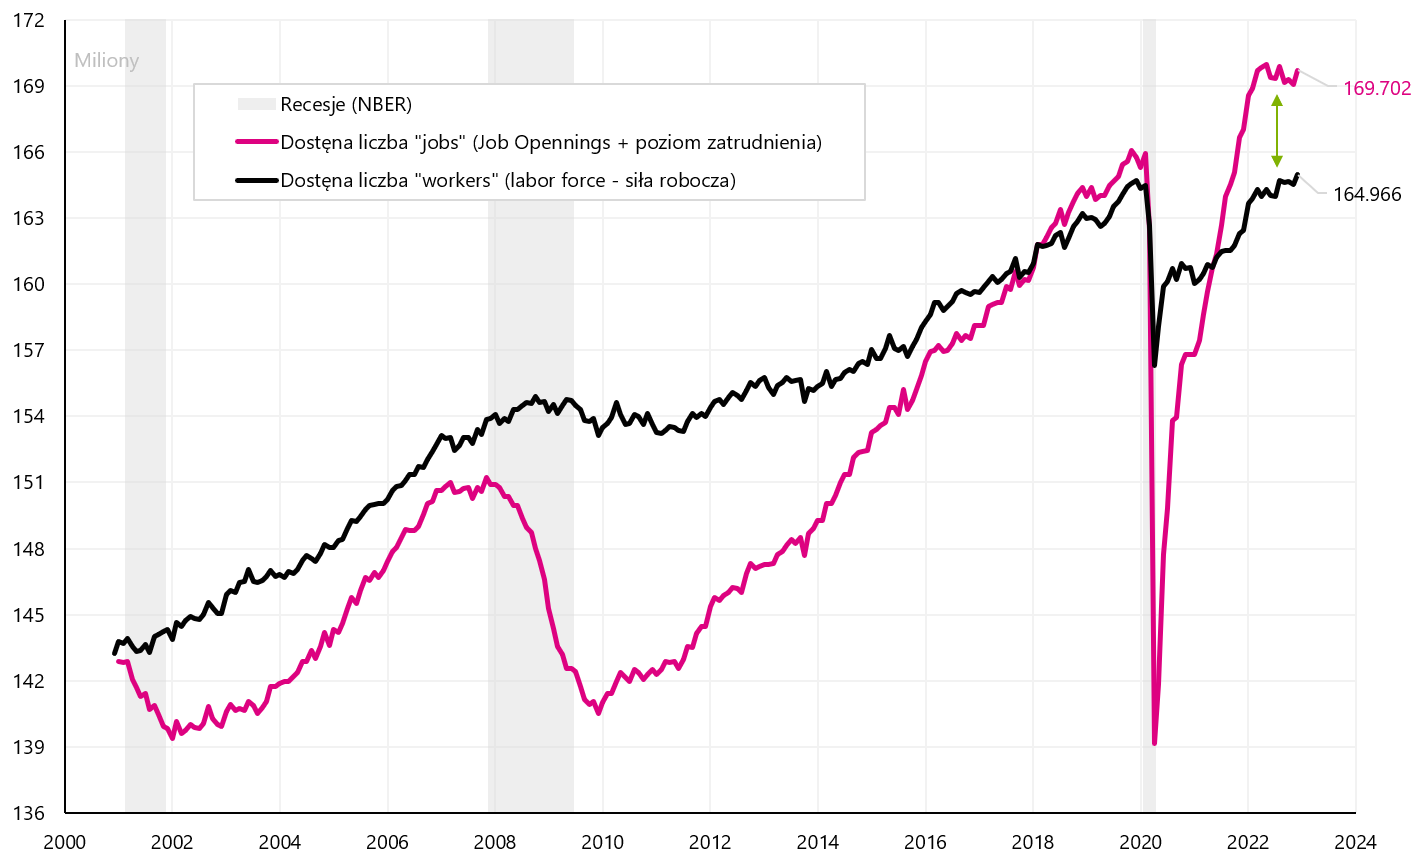
Demand (number of available "jobs") vs. supply (available workers: labor force) in the US labor market. Source: own study, FRED
The level of Job Opening is definitely higher than before the pandemic (by about 3 million positions). Additionally, data for November released last week were stronger than expected.
The monthly increase in jobs is still above 200. In December, 223 people arrived. jobs according to the "Establishment" survey (3-month average is 247 thousand) and 717 thousand. according to the Household survey (3-month average is 131). Only the increase in jobs below 100-120 thousand. monthly will mean "tightening" on the labor market (such a monthly increase compensates for the population growth).
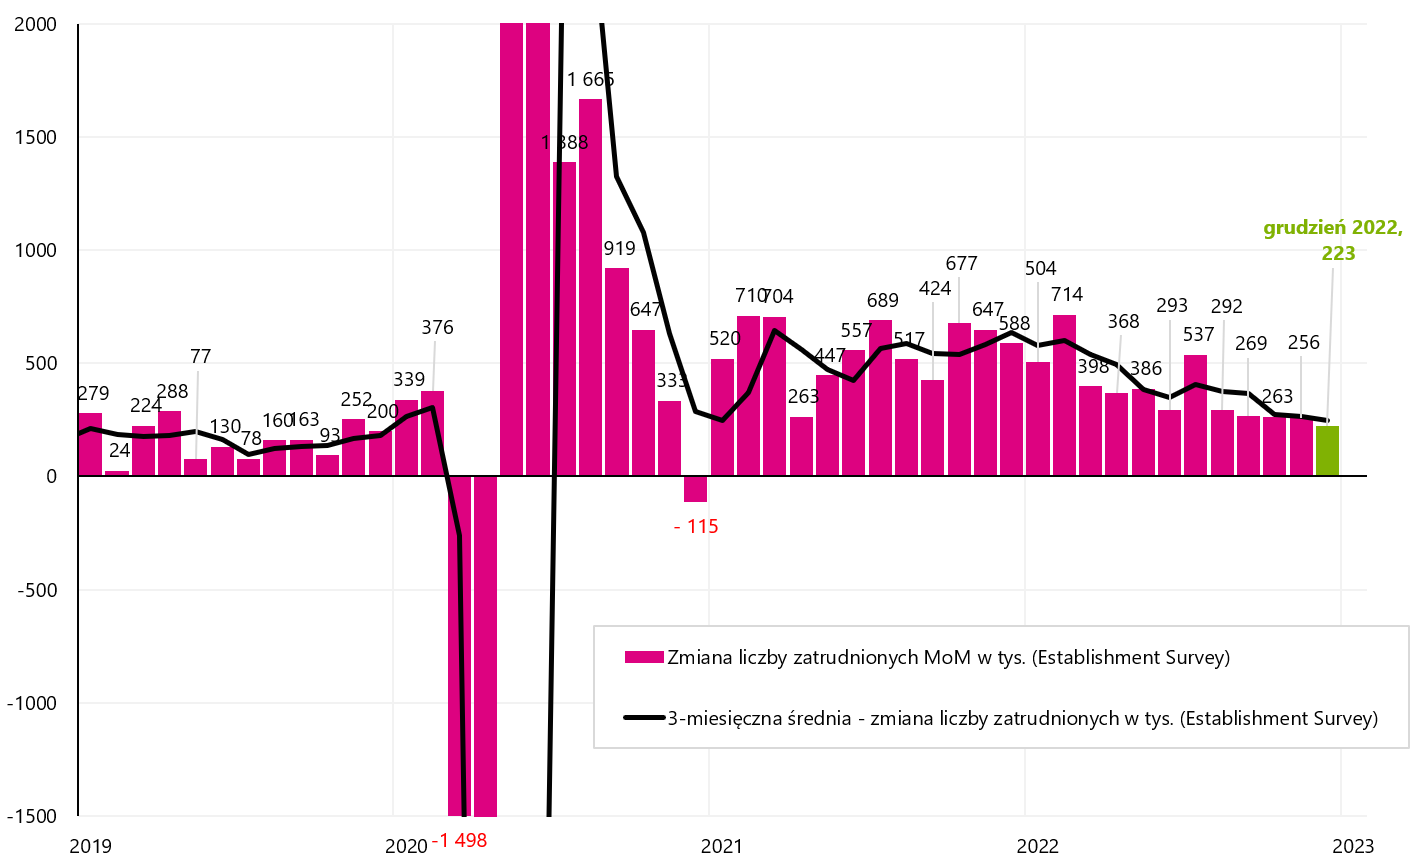
Monthly change in US jobs according to the Establishment Survey. Source: own study, FRED
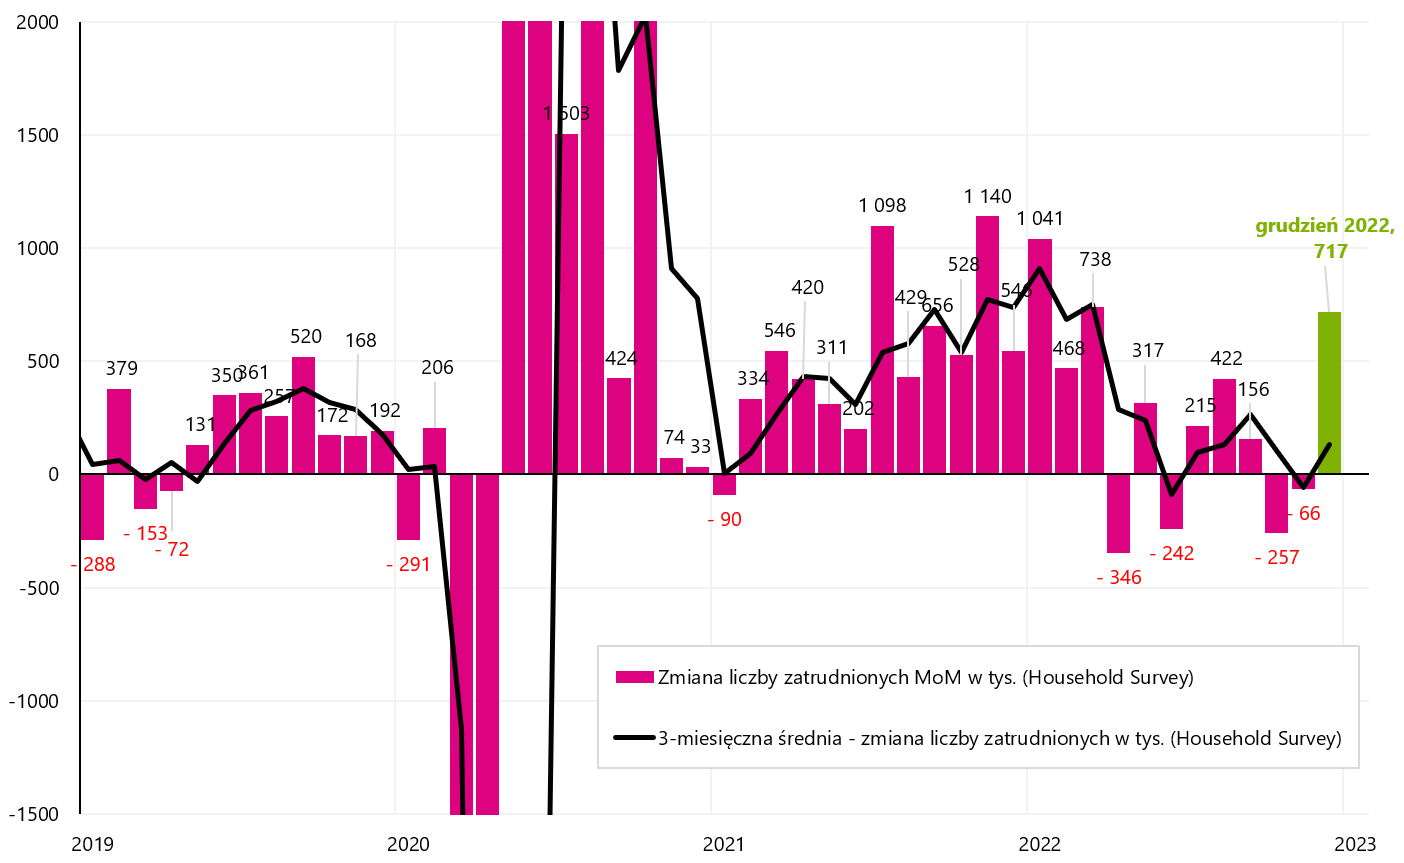
Monthly change in US jobs according to the Household Survey. Source: own study, FRED
The difference in new jobs created between March 2022 and November 2022 between the Establishment and Household surveys was almost 2,7 million in November 2022. Some analyzes indicated a potential overestimation of the number of new jobs by the Establishment Survey, but the change in employment in December suggests that the Household survey rather underestimated the number of new employees (the increase in the number of employees in December according to the Household survey is as much as 717 people). The chart below shows the details.
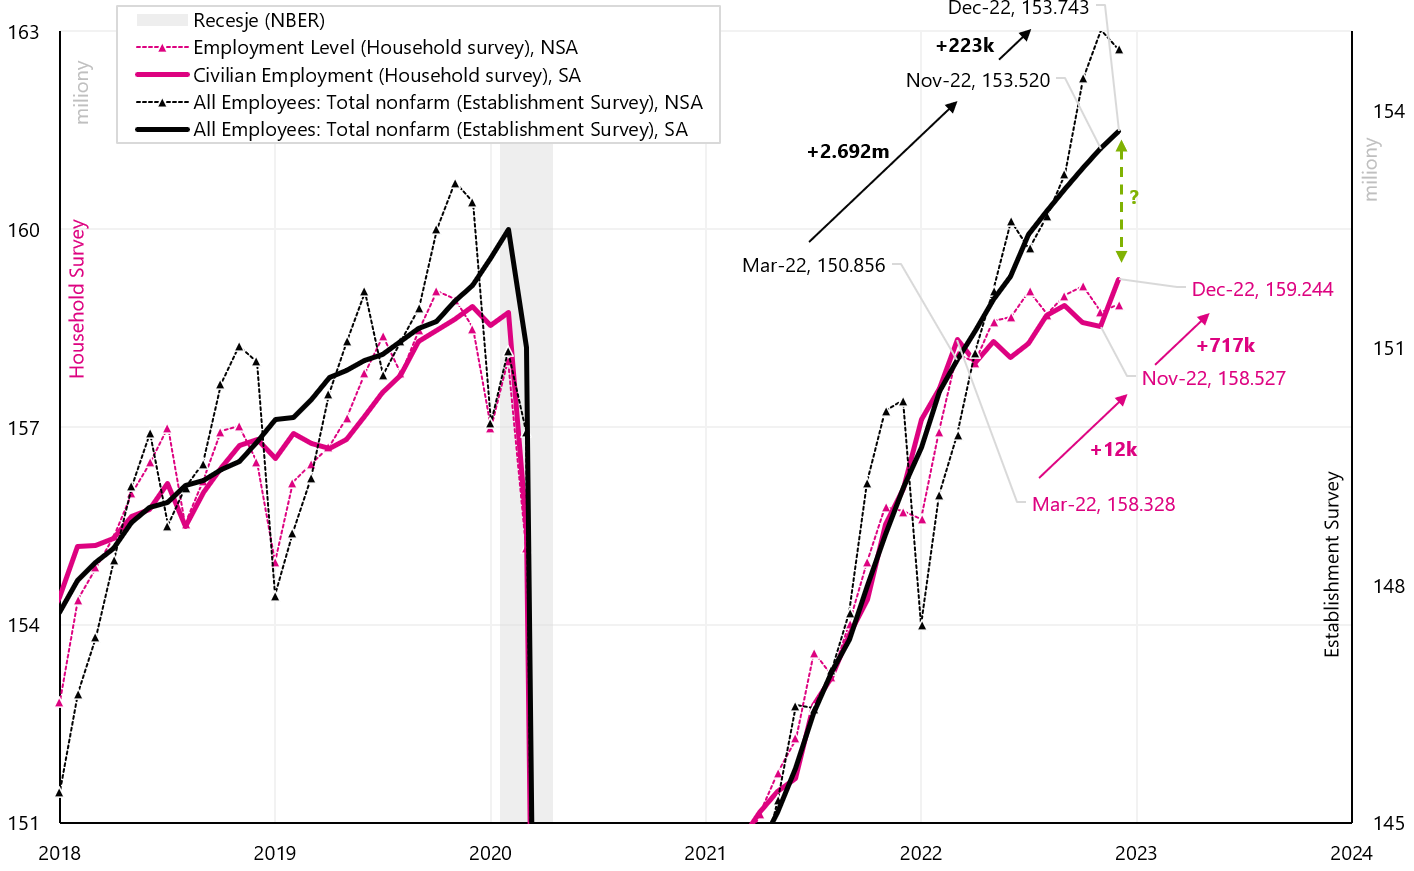
Change in the number of jobs in the US according to the Household Survey and Establishment Survey - including the difference from March 2022. Source: own study, FRED
Both first-time unemployment benefits (weekly data) do not want to grow, and have recently been declining, showing no slowdown in the labor market (no increase in unemployment). Similarly, the decline in the unemployment rate in December 2022 (monthly data) confirms this trend.
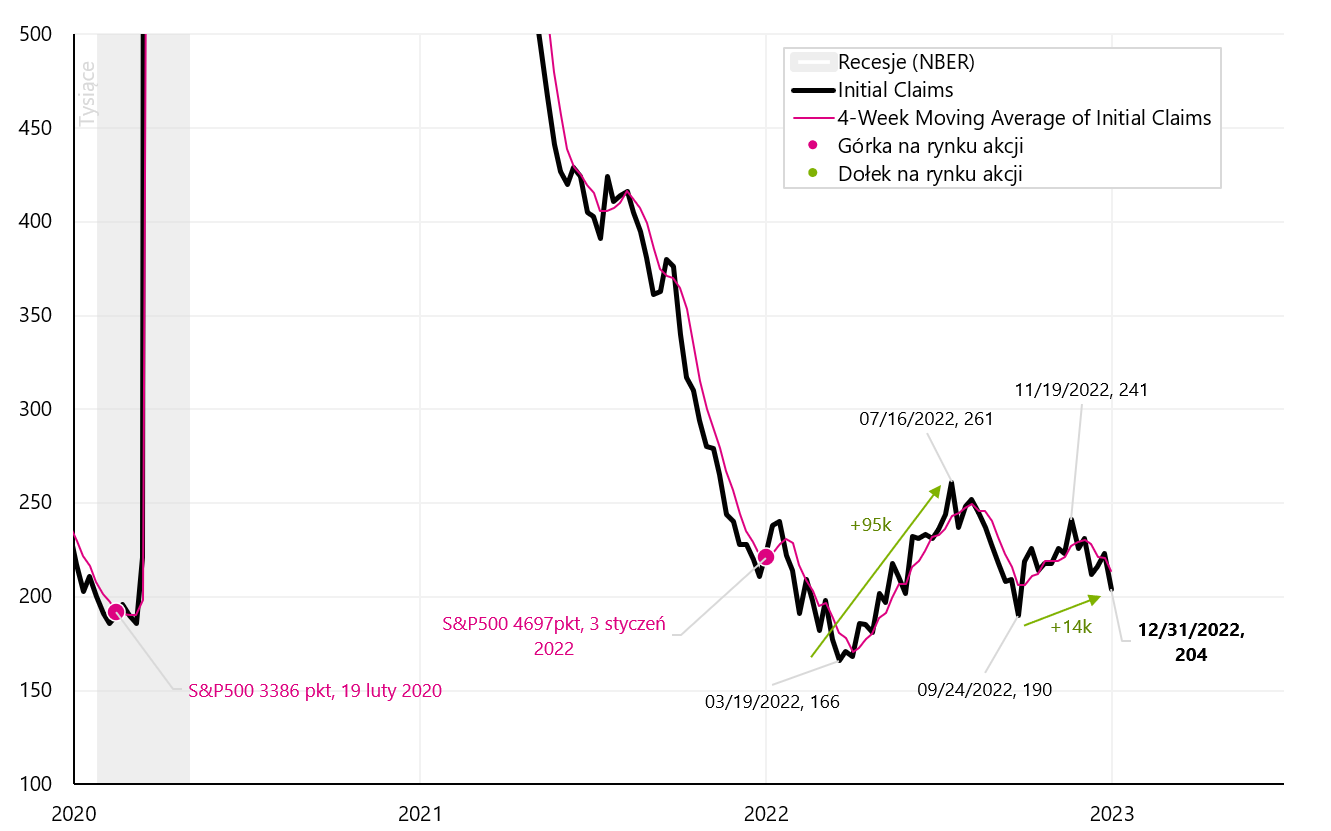
Change in the number of first-time unemployment claims (initial claims) in the US. Source: own study, FRED
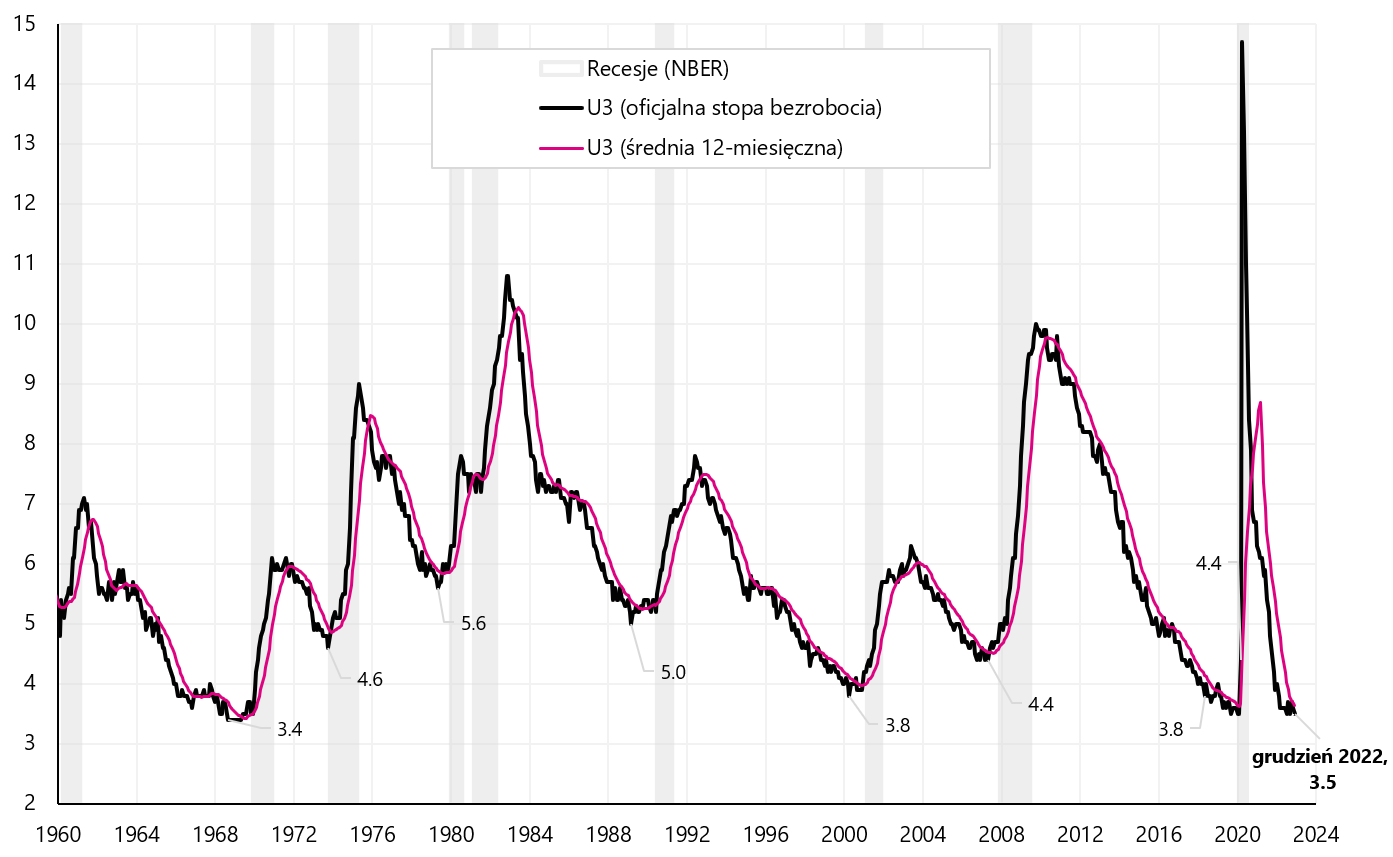
US unemployment rate. Source: own study, FRED
On the other hand, the good news for the market and the Fed is a decline in wage growth. According to data for December, we had not only a decline in wage growth in December, but also a downward revision for November and October. In October, the salary increase was +4,9% (now after the revision it is 4,8%), in November it was +5,1% (now after the revision it is only 4,8%), and for December we have +4,6% . The next chart shows wage growth by different data series. This is the chart that J. Powell is looking at (this chart was presented in his presentation of November 30, 2022).
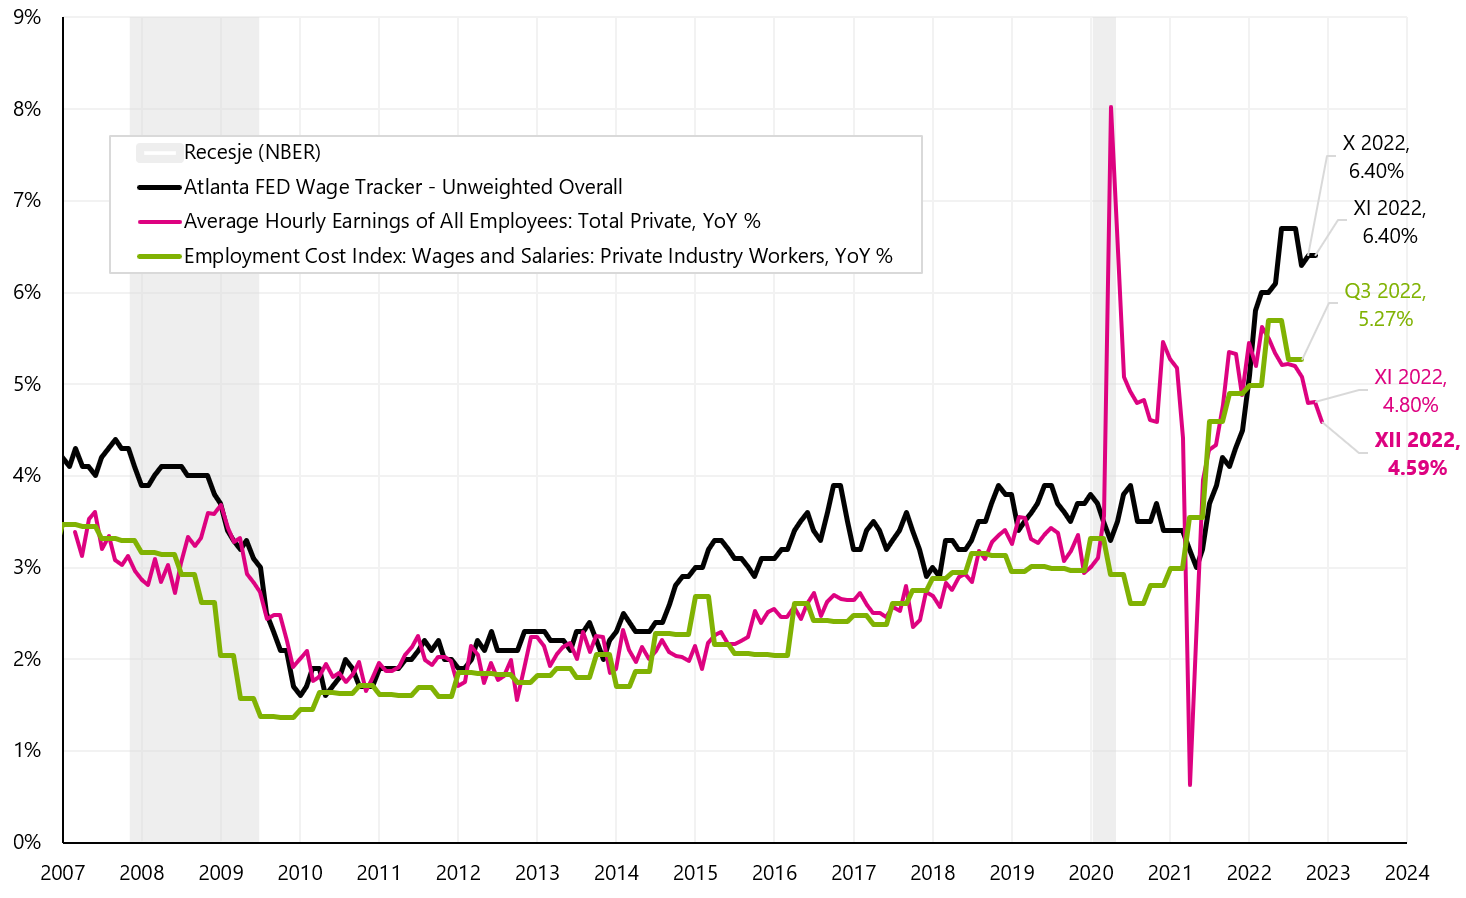
Salary change in the US (different series looked at by J. Powell). Source: own study, FRED
If the downward trend in wage growth continues, wage growth may soon fall below the Fed interest rate, as it did from 1969 to 2008. Historically, only the FED rate above wage growth allows for a more permanent reduction in wage growth, which is presented in the next chart (green arrows show the differences between wage growth and the FED rate).
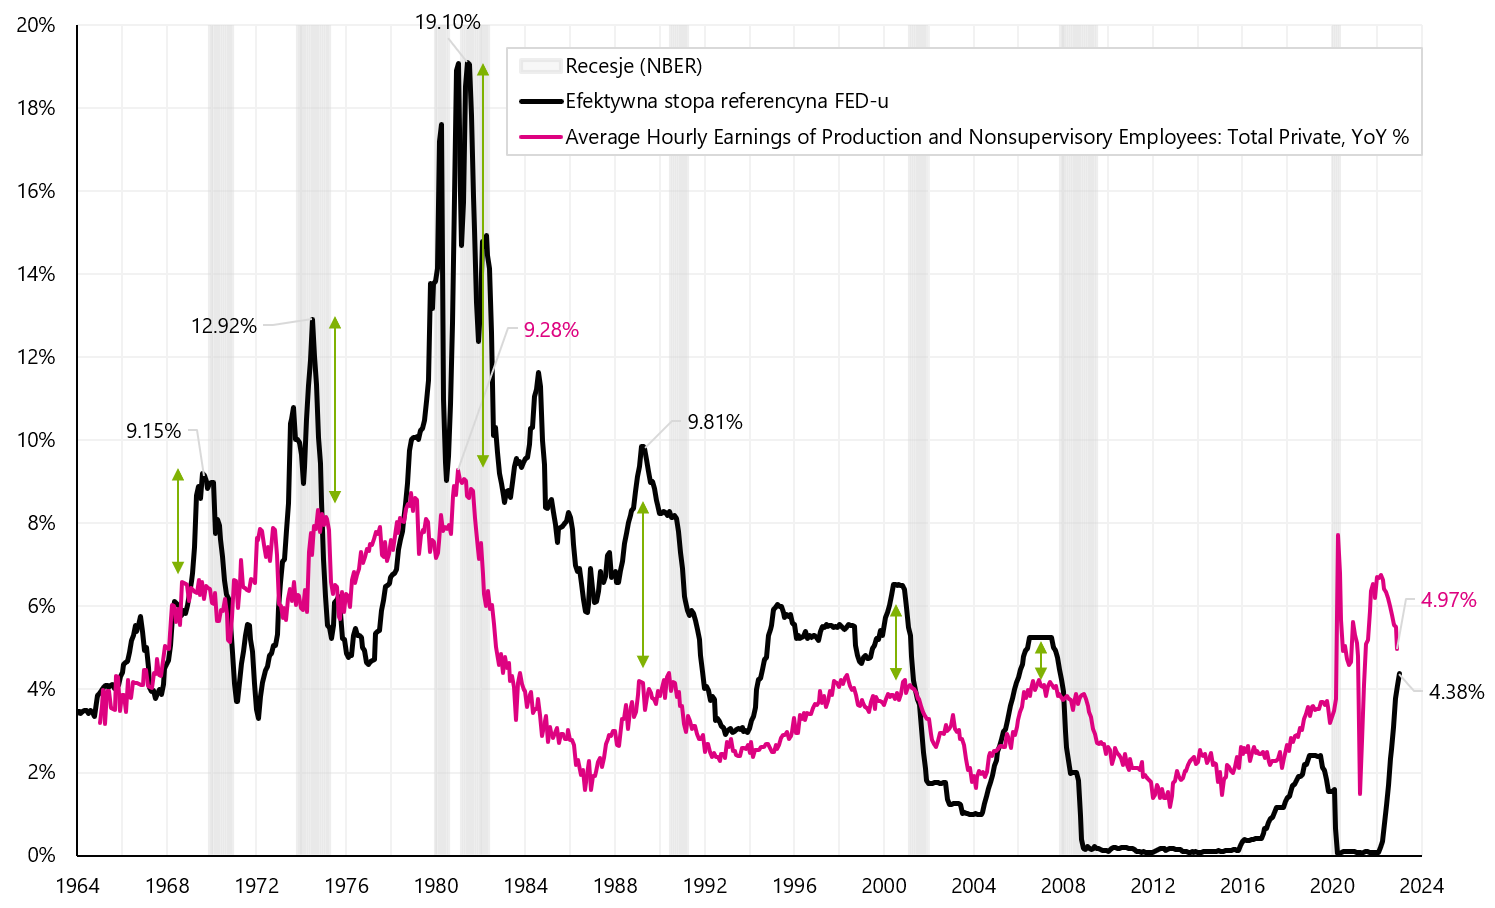
Change in wages in the US against the background of the FED interest rate since 1964. Source: own study, FRED
Summation
The past week was very interesting in the financial markets. As expected, investors focused on the opening of the Chinese economy and lower energy prices, as well as lower inflation readings in Europe. Hence, we were dealing with strong increases in Chinese and European (especially German) stocks. The Polish stock exchange also benefited from this, where by Thursday the increases of Polish indices in 2023 amounted to even more than 5%.
The reaction of the markets to the US employment report was also interesting. While the decline in wage growth is a most positive factor, it is "one data point" for now. Of course, the markets had the right to react this way ("at your own risk"). Especially that looking ahead, the increase in employment and decrease in unemployment do not necessarily go hand in hand with a decrease in wage growth (demand for labor greater than supply should lead to an increase rather than a decrease in wages). The price of crude oil was also interesting in the new year. Drop 10% in first two days, then no positive reaction Friday to employment report is food for thought (at least in the short term, oil does not seem to be playing the opening of the Chinese economy or a positive fall in US wages, let's also remember the sharp decline in the ISM Services PMI - which indicates slower economic growth and further decline in oil demand).
About the Author
 Jaroslaw Jamka - Experienced fund management expert, professionally associated with the capital market for over 25 years. He holds a PhD in economics, a license of an investment advisor and a securities broker. He personally managed equity, bond, mutli-asset and global macro cross-asset funds. For many years, he managed the largest Polish pension fund with assets over PLN 30 billion. As an investment director, he managed the work of many management teams. He gained experience as: Member of the Management Board of ING PTE, Vice-President and President of the Management Board of ING TUnŻ, Vice-President of the Management Board of Money Makers SA, Vice-President of the Management Board of Ipopema TFI, Vice-President of the Management Board of Quercus TFI, Member of the Management Board of Skarbiec TFI, as well as Member of Supervisory Boards of ING PTE and AXA PTE. For 12 years he has specialized in managing global macro cross-asset classes.
Disclaimer
This document is only informative material for use by the recipient. It should not be understood as an advisory material or as a basis for making investment decisions. Nor should it be understood as an investment recommendation. All opinions and forecasts presented in this study are only the expression of the author's opinion on the date of publication and are subject to change without notice. The author is not responsible for any investment decisions made on the basis of this study. Historical investment results do not guarantee that similar results will be achieved in the future.


Leave a Response