


A price compression strategy, that is, trade during a weakening market

There are many methods of trading. You can also safely say that there are exactly as many traders on forex market. Even though they use the same trading method, its execution is completely different, making the trading system an individual matter. Today I would like to introduce you to something else, not very demanding, which is a positive strategy. Talking about price compression. The price compression theory itself and the simplicity with which it can be used even for occasional market trading is not as well known as Price Action themselves. However, in my opinion, it is so pleasant and valuable that it is worth getting to know it. There are many methods of trading currencies - simpler and more advanced. I would certainly qualify this one for the first group. People who have already dealt with Price Action, it is easier to absorb the idea of price compression. For those who haven't had this pleasure yet, I think they will find a simplified version of this system. Let's get down to business.
Price compression strategy - a tactic for latecomers
What is price compression? This is nothing but a price movement that indicates the weakness of buyers or sellers. Price compression is a very slow move that indicates a weakness in the buying and selling sides. You could say that's all there is to it. Nevertheless, there is one important point to mention here - how is this compression created and where to look for it?
Overall, price compression is a tactic dedicated to, in a sense, the "Latecomers". The pattern itself (if you can call it that) forms quite slowly, which therefore gives you the chance to join the opposite side and the weakening market for a long time. Therefore "Free riders" they have relatively many opportunities to get into positions here.
The undoubted advantage of trading with price compression is considerable volatility and a large price impulse that follows. This tactic is characterized by the fact that, in practice, compression "collects" pending orders from the market. As such, we reduce the likelihood of trading on dynamic, short-term up or down movements, which usually only form long wicks. The emerging formation executes most of the orders placed on the market in a specific price range. Compression is best illustrated by small candles that move within a narrow price range. Taking them to the workshop in terms of even the analysis of Japanese candles, small candles tell us about a certain uncertainty in the market and the exhaustion of a given movement.
A lot is happening
In general, I would not equate price compression with a period of consolidation. Sometimes we also call compression a moment of slow movement, in a specific trend that is created by "Price fight", where there is a bearish candle once, and then an upward candle that is equal in size to the previous one. Often the price compression is referred to as a triangle formation, which is, in a sense, true. On the other hand, periods of compression can also be called moments (in accordance with foreign literature) "Compaction" candles in the market.
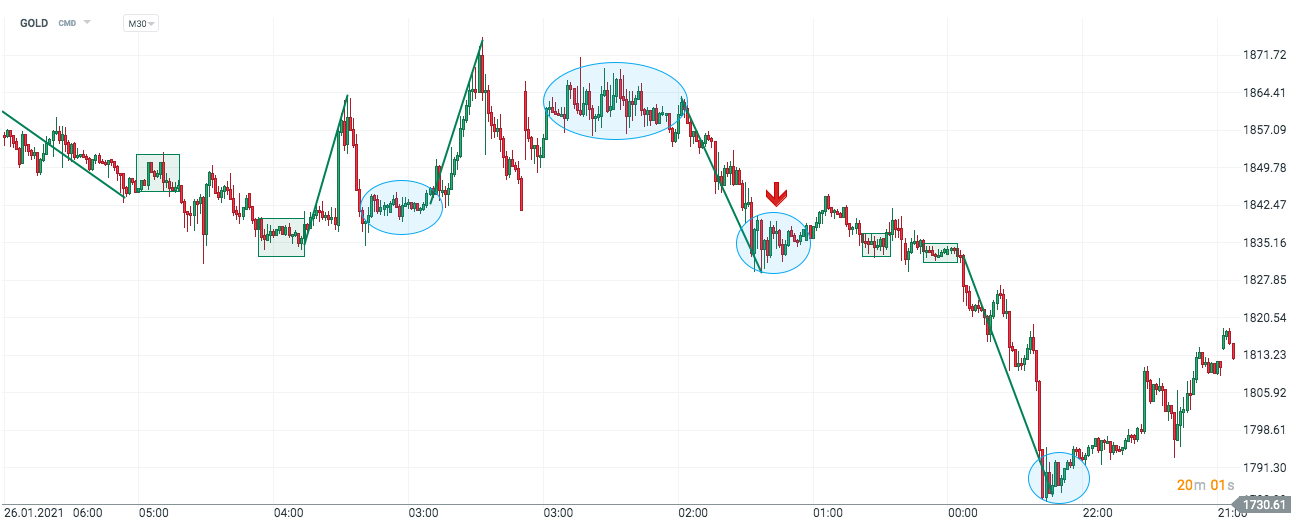
Gold chart, M30 interval. Source: xNUMX XTB.
In the chart above, I marked two compressions - blue - larger and "Little compressions"which occur in green squares. In general, I focus on the larger ones, while the small ones are a sure signal about the price fight at its specific levels. To show you a typical, triangular compression, I have additionally marked it arrow.
How to use compression to trade?
This is where Price Action enters the analysis. We are interested in places of support and resistance as well as their observation in terms of compressions. It is worth saying here that we should not search for them by force. Their absence on the chart suggests a highly trending market. Let's explain why, use the additional element in the form of support and resistance levels in trading price compression? Well, because in theory, compressions should speak of the weakening power of buyers and sellers. The levels derived from the Price Action analysis are very good at assessing the compression potential and determining the range in which buying or selling the market will be most effective.
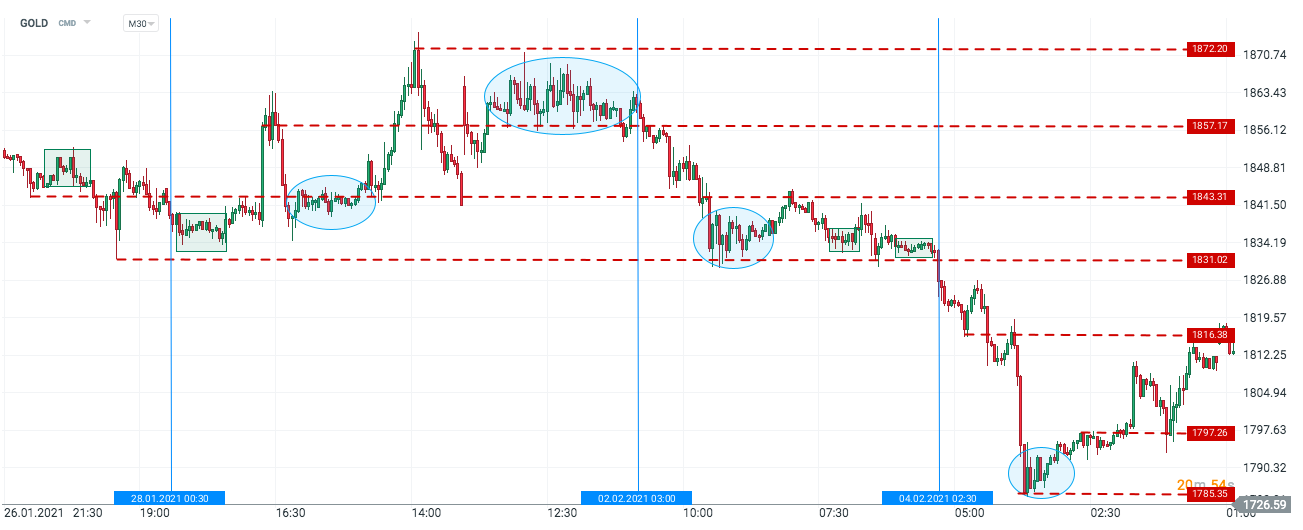
Gold chart, M30 interval. Source: xNUMX XTB.
In our working chart, we have the support and resistance levels marked (red dotted lines) and the time intervals that we will analyze. Why did I mark them that way? If you look closely, they contain a trend along with a correction. We are to use price compression to look for the exhausting forces of bulls and bears. It is difficult to talk about it when we are unable to organize the most ordinary pattern of trend creation (an uptrend - another peak higher than the previous one, a lower than the previous one, the opposite in a downtrend).
Let us analyze the first time period. We are dealing with intense movements in an uptrend. This trend is so specific that after large growth impulses, practically the same periods of decline follow. This should already give us the first warning signal that there are still a lot of sellers on the market. After two big breakthroughs, we see the first problems with reaching the new peak. This is the big wick in the first (and biggest) price compression. Let us see that the price is moving along the nearest support line and its structure does not indicate that this trend is continuing (the upside candle is of the same value as the downward candle, no clear trend, orders accumulation). During a price compression period, it may as well "outline" its value with a price channel and wait for a breakout in a specific direction, assuming that the weakening trend will reverse (this helps to set the value of pending orders, where the buy order in this case may be 2 times lower than sell).
In the second case (time period) there is a downward trend and a correction of this trend between the support (1831,02) and resistance (1843,31). We can see that the beginning of this correction is a slight compression that created an upward movement for us. You could make money on it, but you have to look at the whole situation from a broader perspective and take into account the prevailing trend. Therefore, if we are using slight compression to trade, as a take profit we should consider the closest resistance level and then watch what price does to it. As you can see, it was downloaded and then tested by mini compression. Another peak in the consolidation was broken lower, there was another test and a continuation of the downward trend.
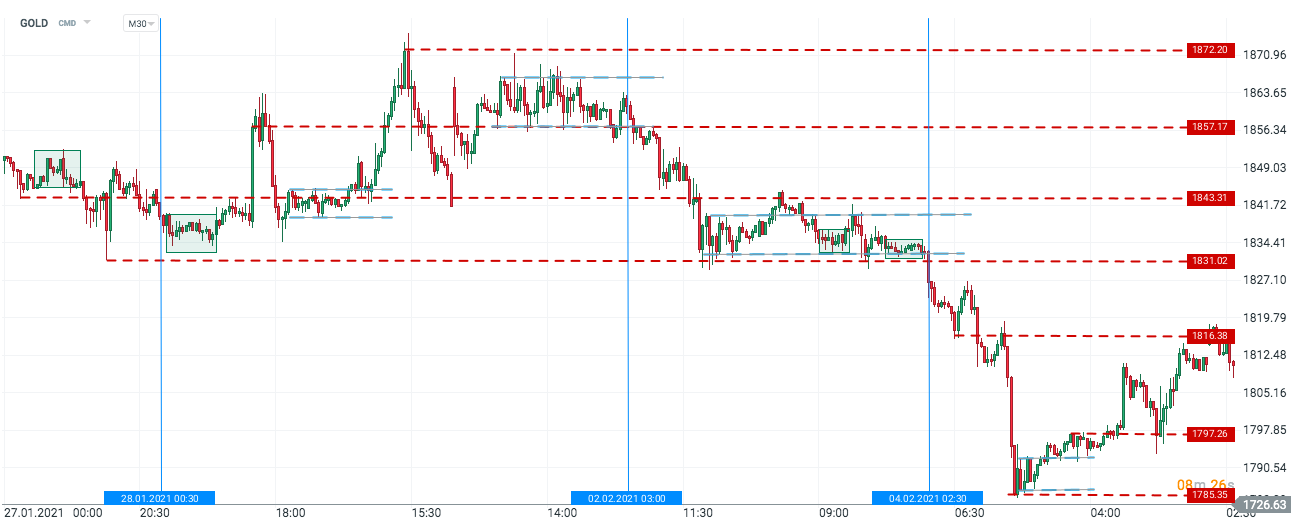
Gold chart, M30 interval. Source: xNUMX XTB.
In the chart above, I have included the marked price compressions in the price channels instead of placing them in the blue boxes. In the chart below, I am throwing in a few more examples of a typical triangle price compression (first square) and a second price compression that some would view as part of the trend. Nevertheless, such a structure of increases is at least alarmingly warning against the fact that the momentum may run out in the near future.
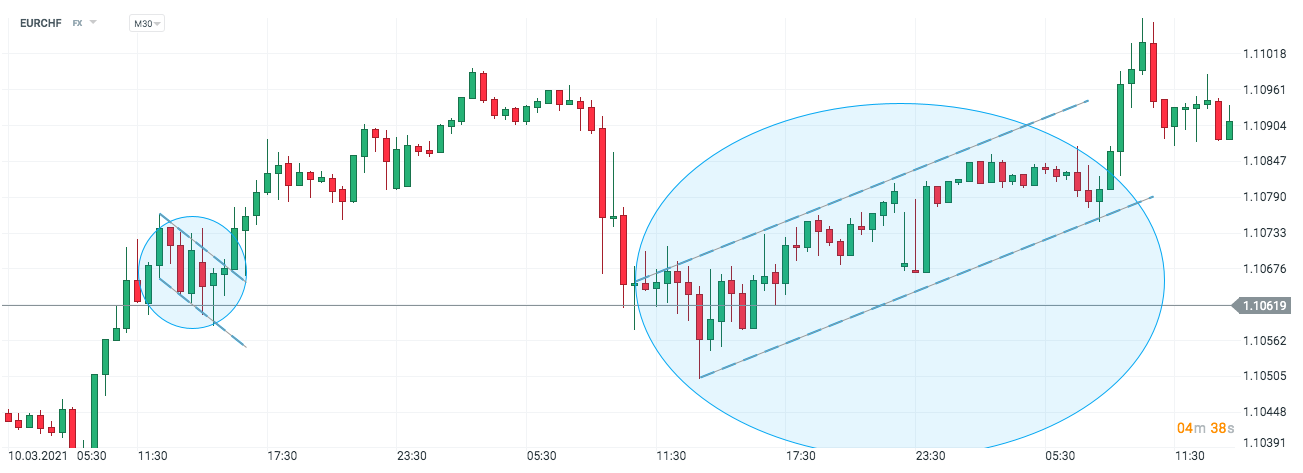
EUR / CHF chart, M30 interval. Source: xNUMX XTB.
Summation
The price compression strategy can be used in a variety of ways. For me, it is convenient to use it together with Price Action and in a strategy based on confirmed highs and confirmed lows. It will work just as well in conjunction with indicators, as long as we conscientiously read the sentiment in the market. The price compression itself cannot be taken as the main signal for a sudden trend reversal. It is supposed to indicate the weakness of the selling or buying side, but in a broader context. Just look at the second example, where the compression was part of a longer correction. It was a signal of a continuation of the downtrend, due to the fact that the uncertainty of the price at these levels resulted from the first breakout test in the correction and not the whole downtrend test. Compression is undoubtedly a useful technical analysis tool. Regardless of its simplicity, however, it is worth testing your understanding directly on the market.


Leave a Response