


VIX - Fear Index as a barometer of investor sentiment

VIX (Volatility Index), or the volatility index, commonly referred to as the fear index, is one of the few indicators that reflects the market sentiment. It is calculated. Publishes it The Chicago Board Options Exchange (CBOE) follows a predetermined formula based on the volatility included in the US S & P500 option prices. It was introduced in 1993. In simple simplification, it is mainly used to predict fluctuations in rates. Let's take a closer look at him.
How does the index shape?
This index, as we know, measures market expectations. They refer to volatility using quotations (bid and ask prices) of options on the S & P500 index. What does it represent more precisely? It mainly expresses the value expected by investors of the volatility of the S & P500 index over the next 30 days. To determine the volatility, the two best buy offers and the two best sell offers of all options on the S & P500 index, the expiry date of which is at least 8 days, are taken into account. Of course, specific options for sale or purchase are given specific weights. The value of the VIX index alone is the 30-day volatility of the S & P500 index multiplied by 100. The index itself does not predict the movement of the US index, but only its strength.
How to read signals index?
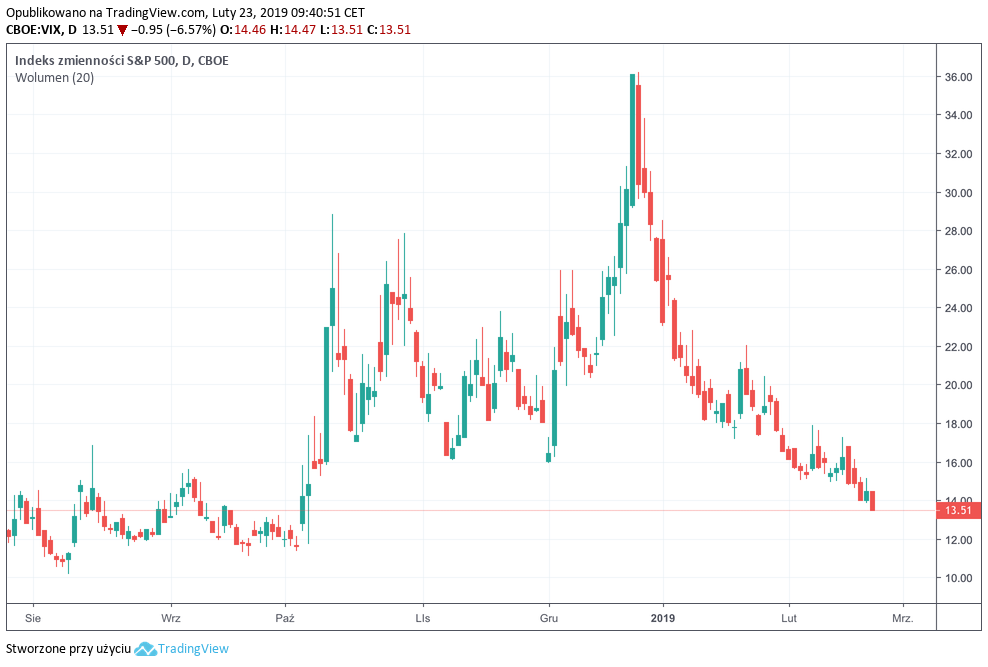
VIX is interpreted according to the principle - the higher the values of this index, the greater the volatility of prices on the market. The index rises when there are declines. Usually, when it starts to rise (it also happens during an uptrend), sooner or later we can expect a decline. Observing the index in the periods of the stock market downturn, it actually takes on significantly higher values. The largest daily changes in the index occurred in October 2008. The index of fear reached the highest volatility (86,60) on November 11, 2008. It was a period of high volatility in the capital market, which affected both contracts and currencies.
Help in determining the market mood
Is it worth using the index values to predict the fluctuations on the S & P500? In fact, each index is a kind of barometer. The fluctuations of the VIX should be read not as an indication of a direction or trend on the American index, but rather as an indication of the volatility that prevails there. What is worth paying attention to? When reading its indications, it is worth analyzing the S & P500 at the same time. Particularly noteworthy is the systematic decline of the VIX with the simultaneous increase in the index of American companies, after which the rate suddenly changes and climbs strongly. This is quite a strong signal of a trend reversal or a significant correction.
CFD on VIX
The fear index is not only useful for investing in US companies. From 2004, you can conclude futures on it, and from 2006, the CBOE exchange has made it possible to buy options on VIX. Currently, in most broker offers we can find this instrument (CFD on VIX has, among others, X-Trade Brokers under the symbol VOLX). Therefore, it becomes an interesting diversification not only of the stock portfolio, but also typically speculative due to high volatility.


Leave a Response