


Pivot Points indicator - objective supports and resistances

Pivot Points indicator - objective supports and resistances
Already living at the turn of the century, Jesse Livermore in the book "Memories of the stock market player" written by Edwin Lefevre points out the usefulness of support and resistance levels in determining further price movements. Today, many investors trading in Forex markets base their decisions at least partly on designated support and resistance lines.
The problem with manually or visually determining support and resistance levels is that they are not objective. Where one trader sees the level of resistance, the other may not see it. Many traders have a problem with defining these levels at all, they cannot see them and it is difficult for them to decide whether a given level is a resistance level or not. The Pivot Points indicator comes in handy. These are the levels of support and resistance calculated from the mathematical formula.
DOWNLOAD: Pivot Star indicator for MT4
What is the Pivot Points indicator?
The Pivot Points indicator is based on a mathematical formula that calculates future support and resistance levels based on the minimum, maximum and closing prices from the previous period, which we take into account (this is explained in detail later in this article). Below we see all levels plotted on the DE30 chart on April 17.04.2020, XNUMX.
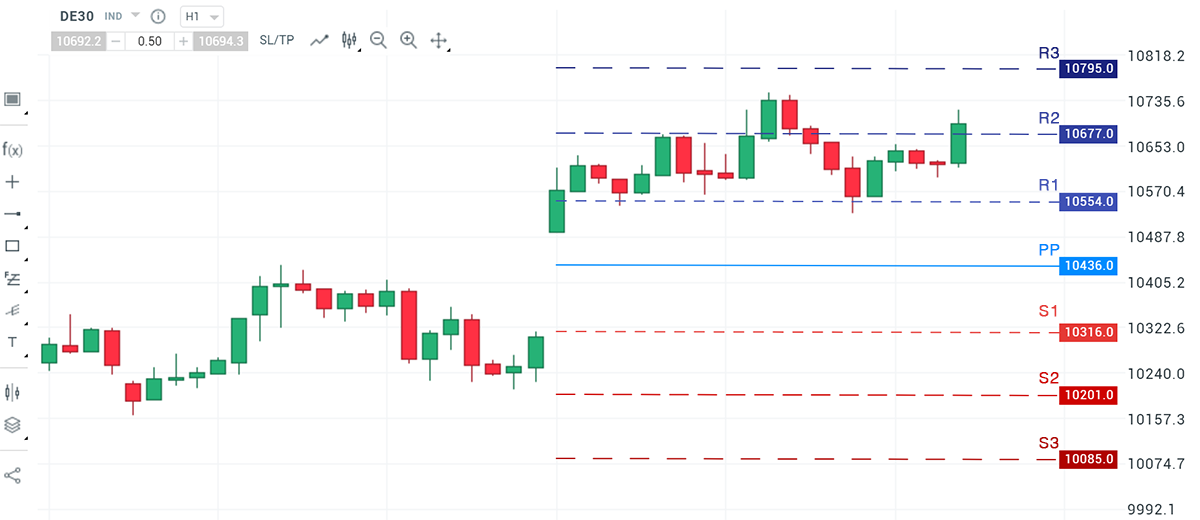
DE30 chart (CFD per index DAX 30), interval H1. Source: xNUMX XTB xStation
Baseline - Pivot Point (PP)
The base level - Pivot Point (PP) is calculated by adding the minimum price (L), maximum price (H) and the closing price (C) for the previous session and dividing the sum by 3.
PP = (L + H + C) / 3
In this way we get the average prices from the previous session. It can be said that this is a neutral level at which buyer and seller forces have balanced. The PP level is the starting point for calculating the 4 likely support levels and the 4 likely resistance levels for the next session.
Resistance levels - R1, R2, R3
The first resistance level (R1) is calculated by multiplying the base level (PP) by two and subtracting the minimum price of the last candle from it.
R1 = 2 * PP-L
The second level of resistance (R2) is obtained by adding the difference between the maximum price and the minimum price of the last candle to the base level (PP).
R2 = PP + (H - L)
We calculate the third level of resistance by adding the maximum and minimum price difference multiplied by 2 to the base level (PP).
R3 = PP + (HL) * 2
Support levels - S1, S2, S3
Similarly, we calculate support levels.
We calculate the first level of support by multiplying the base level (PP) by two and deducting the maximum price.
S1 = 2 * PP-H
The second level of support is the base level minus the difference between the maximum and minimum prices.
S2 = PP- (HL)
The third level of support is PP minus the difference between maximum and minimum multiplied by two.
S3 = PP- (HL) * 2
What time horizon to consider when calculating Pivot Points?
The key is choosing the right time horizon for calculating levels.
For charts M1, M5, M10 and M15 we use Pivot Points calculated on the basis of prices of the last completed day. The levels set by the indicator at the beginning of the day do not change until it ends.
For traders trading on the M30, H1 and H4 charts, we count Pivot Points for the minimum, maximum price and last week's closing. The levels set at the beginning of the week remain valid until the end.
For traders on daily charts, we count PP using the monthly minimum, maximum and closing prices. As in previous cases, once determined levels remain valid for the entire month.
For what hours do you set H (High), L (Low) and C (Close) daily?
Since the Forex market operates 24h, the question arises as to what hours to take into account for the daily minimum and maximum calculations. Most experienced players give 17 o'clock in New York or 22 GMT time as the opening and closing times of the day. You can set the PP for any selected hours, but setting them in the same way as most significant players have seems to be the most sensible choice.
How to use PP (Pivot Points) in practice?
Reflection from PP
As I mentioned, the base level (PP) is an average of prices from the last period, which we take into account. In a sense, it is a place where the strength of bulls and bears (buyers and sellers) has equaled.
From this assumption flows the first strategy, according to which if the market opens above the PP level, then bounces off the base line (PP) to again be above this level, we have the advantage of bulls and good conditions for opening long positions.
We have this type of situation on our chart from 17.04. The market opens immediately above PP, easily breaks the first level of resistance (R1) and in the next hours our R1 becomes a level of support for a further upward course. A convenient starting point would be to return to R1 in this case. I marked those moments on the graph with an up arrow. Take profit that I would suggest for intraday trading is R2 or R3. Stop loss just below R1.
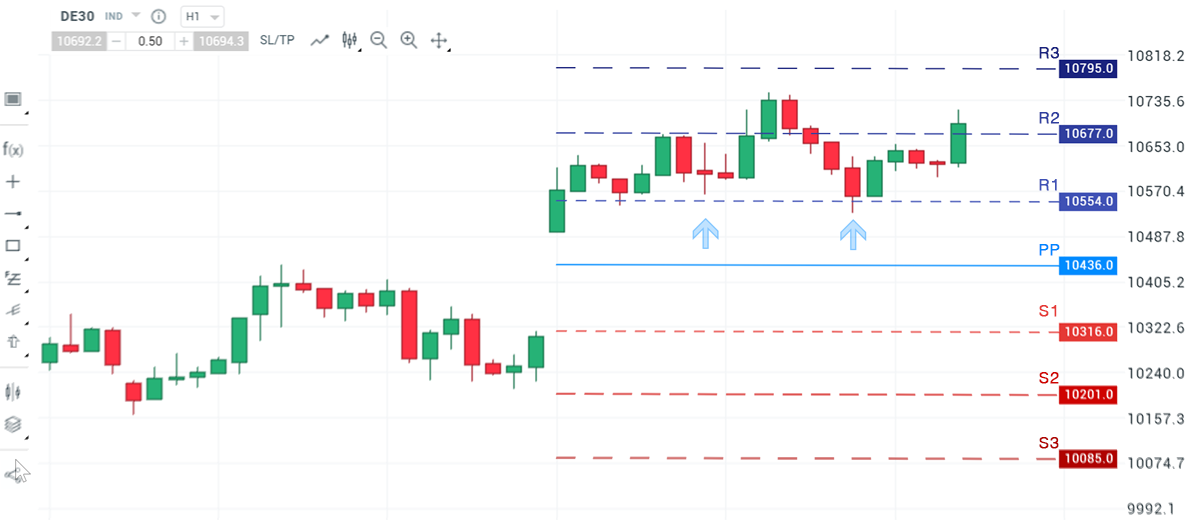
DE30 chart (CFD per index DAX 30), interval H1. Source: xNUMX XTB xStation
However, if the market opens and is below PP level, unable to pass through it, we are dealing with a bear market and according to this strategy it would be justified to open short positions.
The cons and threats of this strategy are that it can generate a lot of false signals. The baseline PP is a place where the strength of buyers and sellers in a given market clashes and price fluctuations in the PP area can be significant (including short breaks above and below the line).
Puncture support or resistance
The strategy that generates fewer false signals is the strategy based on the assumption that if the rate broke the level of support (S1, S2, S3, S4) or resistance (R1, R2, R3, R4), it will probably go further in the chosen direction. In this strategy, the signal to open a long position only appears when the rate bounces off the support level S1 or S2. Similarly, when the rate bounces off the resistance level R1 or R2 it is a good time to enter the short position.
Rebound from support or resistance
A strategy somewhat opposite to the one described above is taking a position when the market respects the resistance and support zones by bouncing off them. Then we expect a return to the base level (PP). The downside of this strategy is playing against the trend, which with a strong trend can quickly turn against us.


Hello, an interesting solution. you showed examples where the price exceptionally respected these levels. but will the price always behave like this? …
Regards,
Jim
To a large extent, it also depends on the currency pair and the current market situation. However, it often works for me.
Hello, Indicator which depends on the pair or the current market situation… Do you think this is correct? The support and resistance level indicator should work regardless of the currency pair or market situation. nestyty, I can't put charts here.
Read my article "https://forexclub.pl/okragle-poziomy-cenowe-forex-jim-poniat/".
This phenomenon of support and resistance levels is more relevant to any situation and market conditions.
Regards,
In this respect, you are of course right.