


Market structure - a formation that few know about [Jim Poniat]

Market Structure - a formation that few know about
"Simplicity is the pinnacle of sophistication" - this quote stuck very clearly in my memory. Everything we do in our world is complicated. In the case of trading, the perfect example is Elliot waves, where there are over 200 rules that a given wave series must comply with. Another example is harmonic formations, where subjective Fibonacci measurements are our measurement rule.
Our trade rules or strategy should be simple, and thus quick to apply. We think that the more complicated the rules of operation are, the better the results will be. There is nothing further from the truth.
Trading should be an adventure, fun - not a bane. Simple, fast market analysis techniques are just what we need. The aforementioned quote is the keynote in creating these techniques. All my methods are very simple, downright ridiculously simple - from the trend line to the tool JP SPECTRUM.
In this article I will show you a formation that is not complicated, and after reading this text you can immediately apply in trading.
Traders focus on many formations, in particular candle formations, double top, double hole, triple top and triple hole. Unfortunately, the most important market formation notoriously escapes our attention.
What is pmarket structure
The concept of market structure is very simple, but it also has powerful power. Market structure is a phenomenon and occurs with significant price reversals.
The price starts swinging (let's assume it's upward) and ends at a certain point. Then the downward swing begins and the price saddle ends again at the point from which the rising swing begins again. These swings start with a formation called the market structure. Low market structure Market Structure Low - MSL) and high market structure ( Market Structure High - MSH) repeats all the time on every swing. This phenomenon occurs in every market and on every time frame but is a concept that should be confirmed by the level of support, resistance or by another indicator.
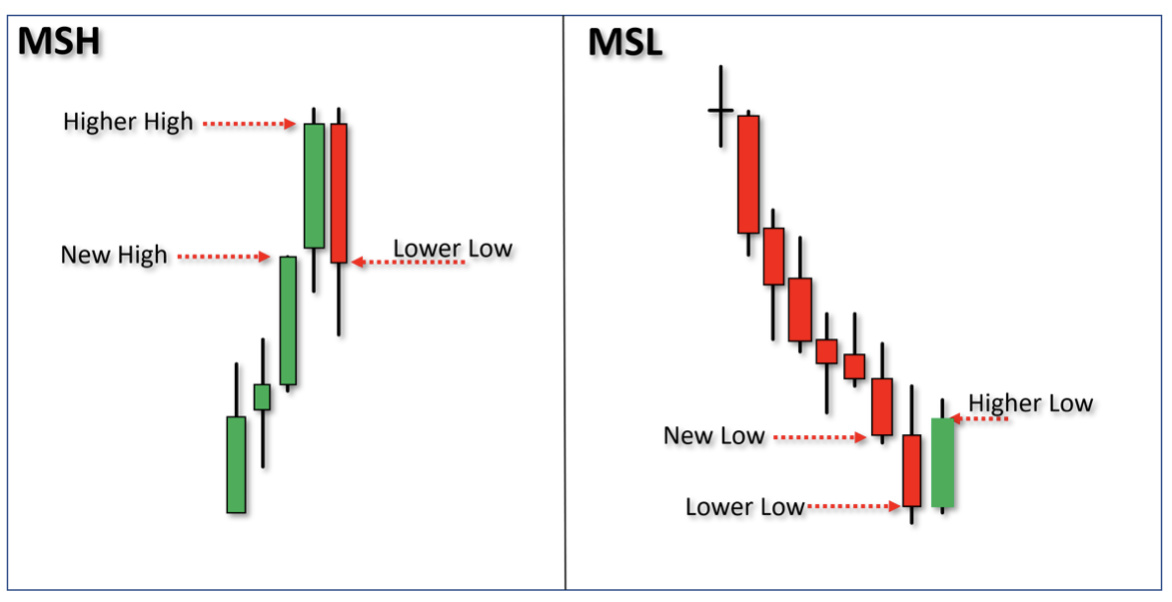
High and low market structure.
High Market Structure Markets Structure High -MSH)
High market structure (MSH) is created when markets reach new heights. They form near key resistance zones or key moving averages, which is very important.
Many theories have been developed for using MSH in commerce. One of them is to find a critical resistance zone and open a short position. Another way is to find a series of earlier MSHs and build a trend line for resistances. The third way is to use MSH in the form of a fractal wave and build a larger swing using the distance between pivot points between them.
The definition of the highest level of market structure (MSH) occurs when the market reaches a new peak followed by an even higher peak followed by a lower peak. This pattern is shown with three candles. But in many cases this may not be the case. It can form in 5-6 candles within a specified period of time, but internal candles should suggest an internal candle ( inside candle), which suggests indecision.
Looking at the example below, you can see what MSH looks like in perfect shape.
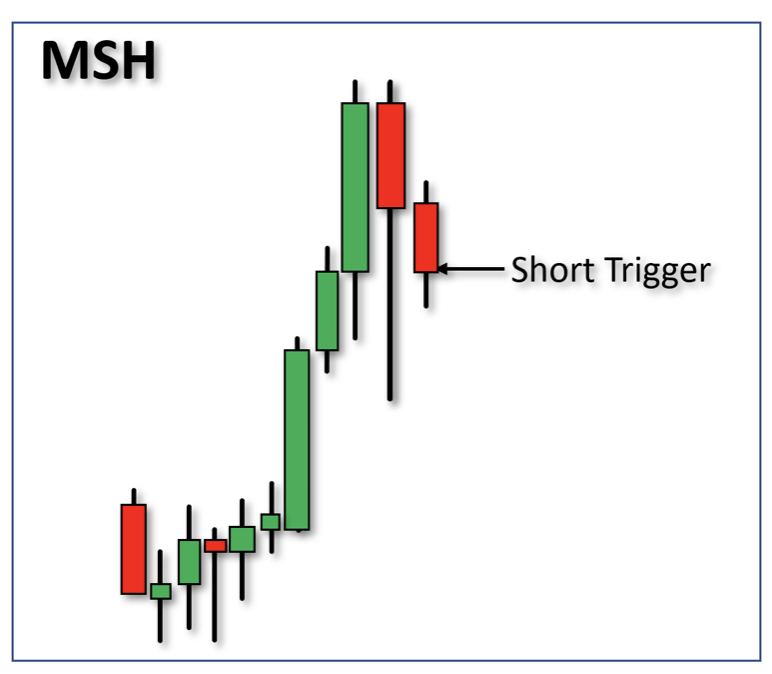
MSH - Short position
- Trade:
- short position (after three candles - MSH) - the signal is the closing of the candle below the low price of the third candle.
- Stop:
- Stop loss we set the highest price above MSH.
- target:
- The signal is valid until another MSL is released with significant support / resistance.
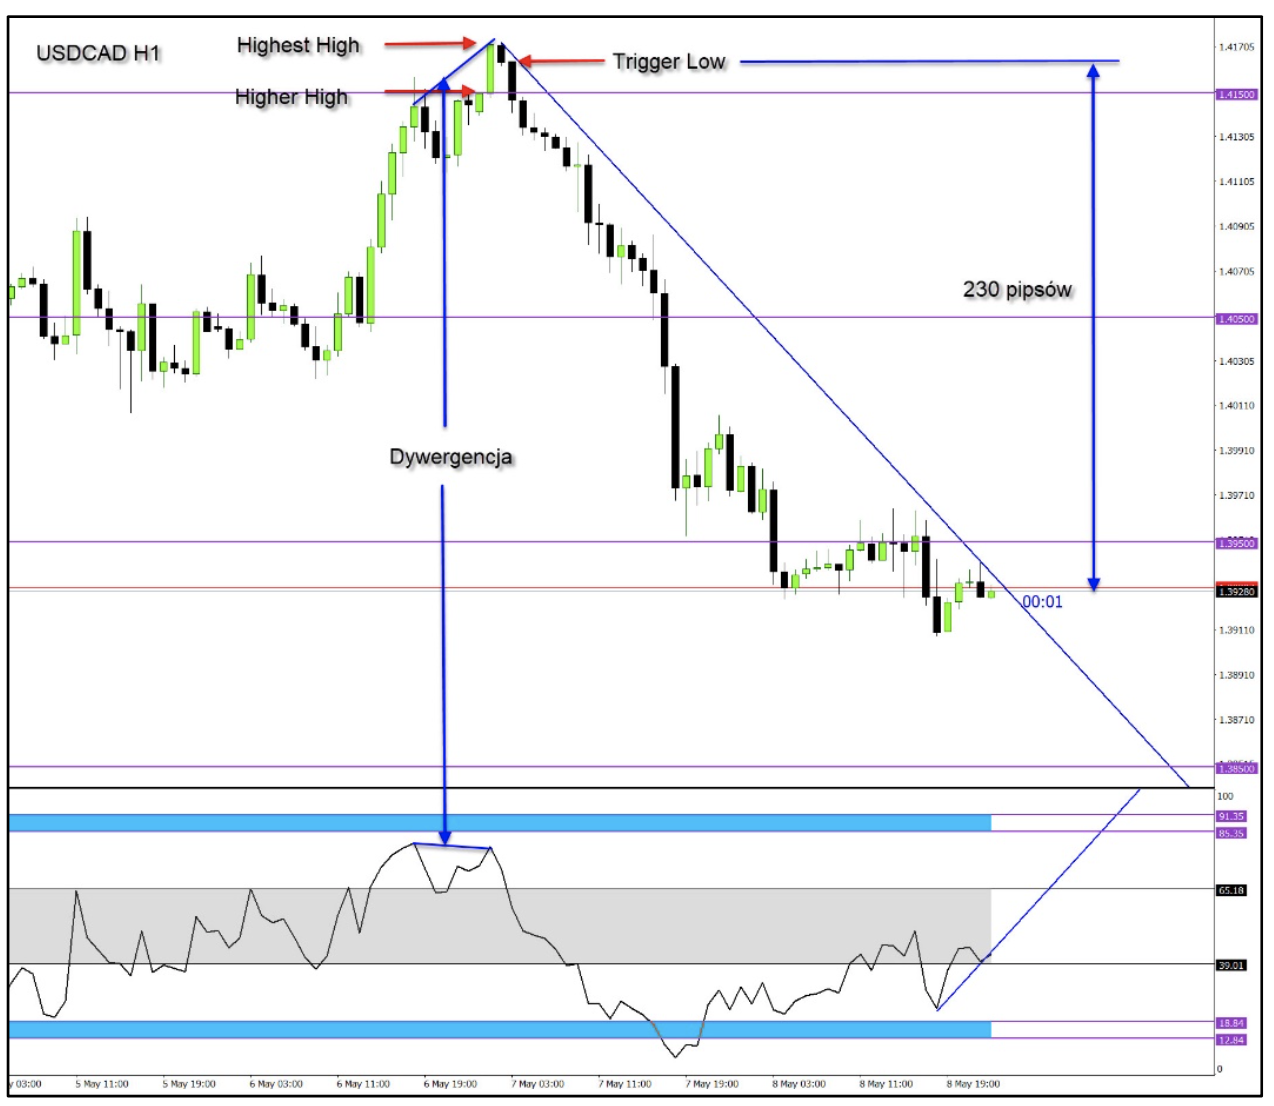
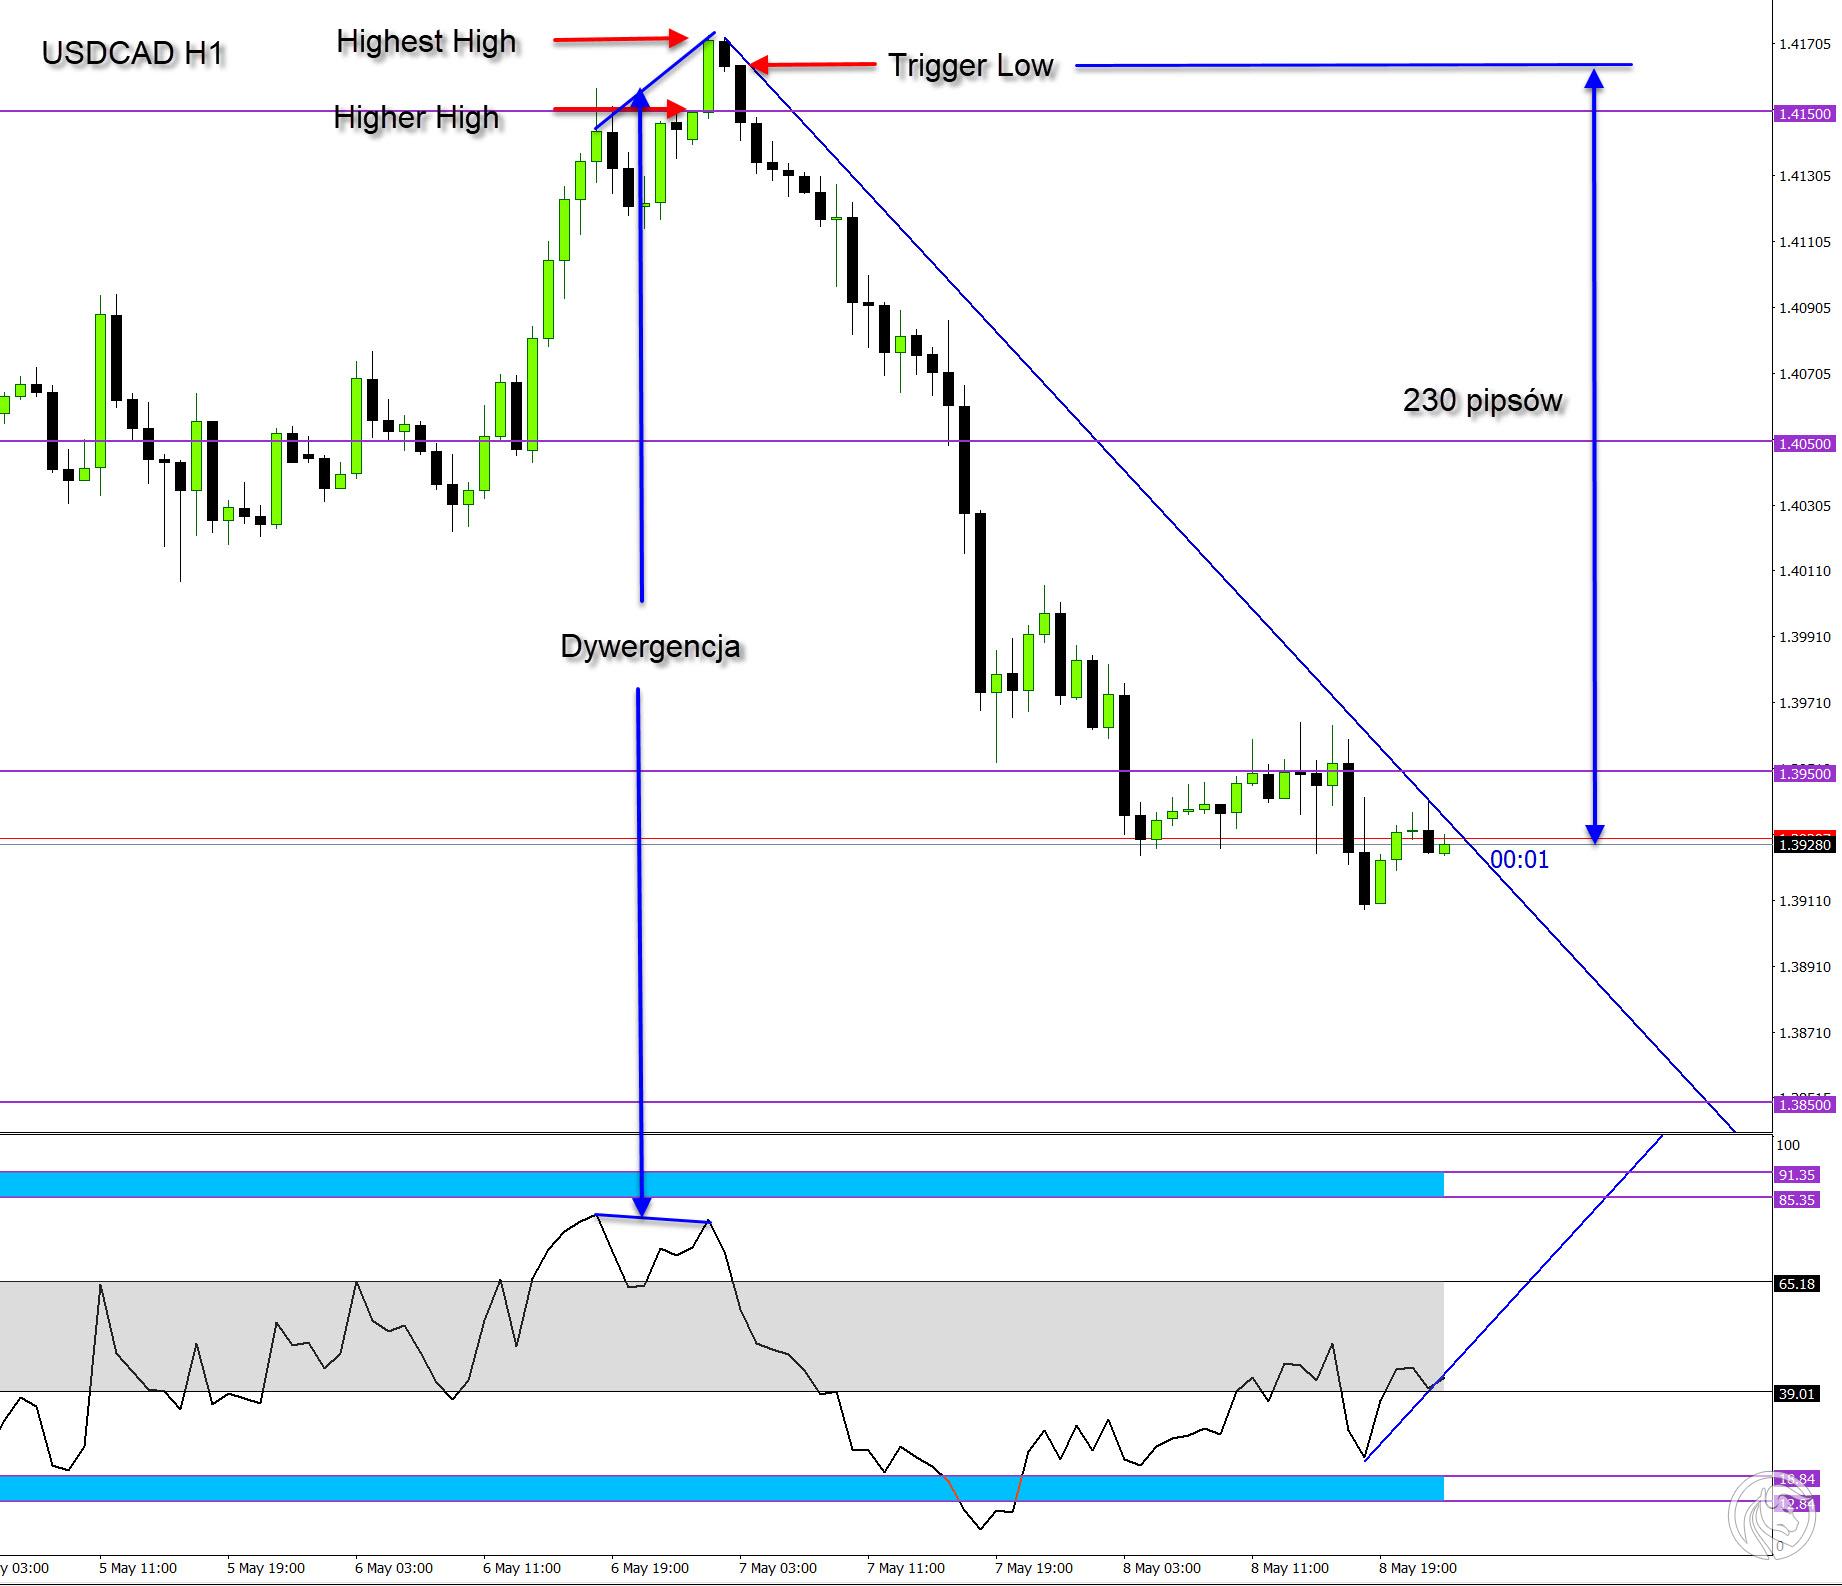
Market Structure (MSH) - practical use
Let's look at the USD / CAD currency pair chart on the M15 time frame. The structure of the MSH market after the divergence occurred at the top. This is the first confirmation of a high market, the second confirmation is our resistance level (not the zone) 1.4150. The third is JP Spectrum, which pierces the inversion zone and slowly increases - momentum is in the back.
Structure of the MSL Market - practical use
In the chart below we can see a GBP / USD pair at the M15 interval. The swing end is at an important level of 1.2275, and JP Spectrum shows us a slow increase in momentum. The intersection of TL by JP Spectrum also shows us an additional signal to open a long position
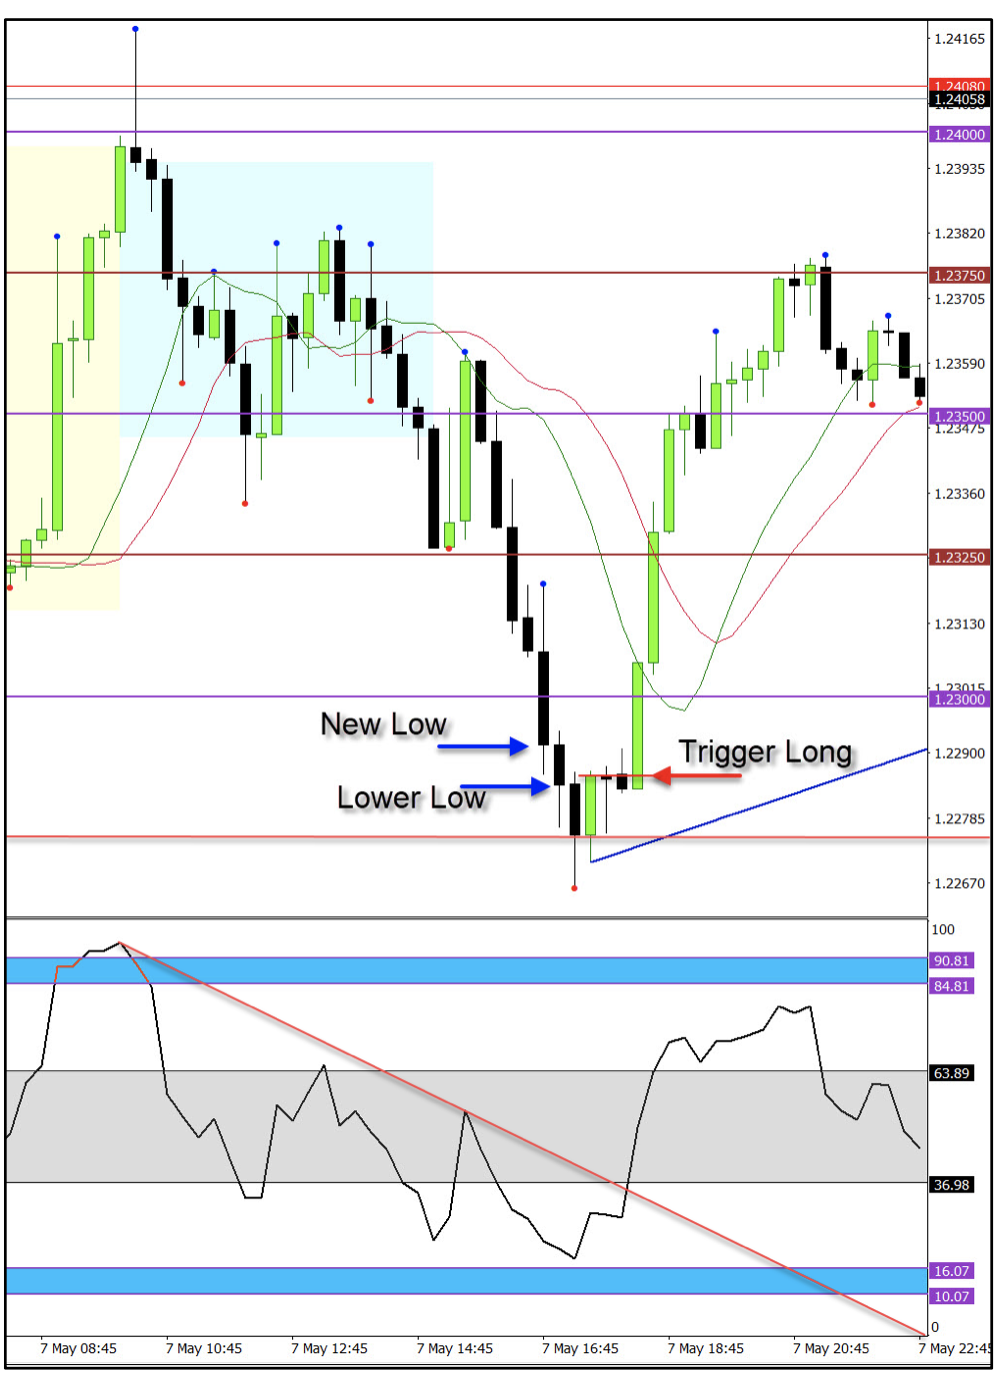
Chart GBP / USD, M15 time interval
The concept of market structure is a perfect confirmation of a change of direction on various values. By observing not only MSH or MSL, but also thanks to confirmation by a significant level of support and resistance, and JP Spectrum, you can see exactly where we can open positions without undue fear.


Leave a Response