


Analysis of the momentum of price changes using microlines

Analysis of the momentum of price changes using microlines
Trend lines have been an indispensable tool in my analysis for many years. We can use them for signals of trend reversal, swing continuation, channel creation and many other places on the charts. Today I would like to show you one of the very unique methods - a method helpful in determining the momentum of price changes on short-term trading. The most important element in my analysis is impetus. No change in momentum will not change the price.
What is impetus and how to use it
The momentum is the basic element influencing the price changes. If we include momentum analysis in our strategy, we will see the upcoming price movements in advance. Analyzing the momentum in terms of price alone is particularly difficult - I do not recommend this to newbies. Detecting a change in the strength of the momentum is excellent and I would say from the perspective of my own experience, an indispensable skill, regardless of the method of analysis we use. It helps us to be on the correct side of price changes.
There are many methods for determining impetus changes. One of the methods is to use oscillators: RSI, MACD, Stochastic or ADX. When it comes to choosing an oscillator, I recommend my technique JP SPECTRUM.
Be sure to read: Avoiding incorrect signals, or how to connect AT indicators
In practice, it is useful to use a quick, clear and simple impetus analysis technique. That's the technique microstrip - especially useful for short-term trading.
What are trend lines?
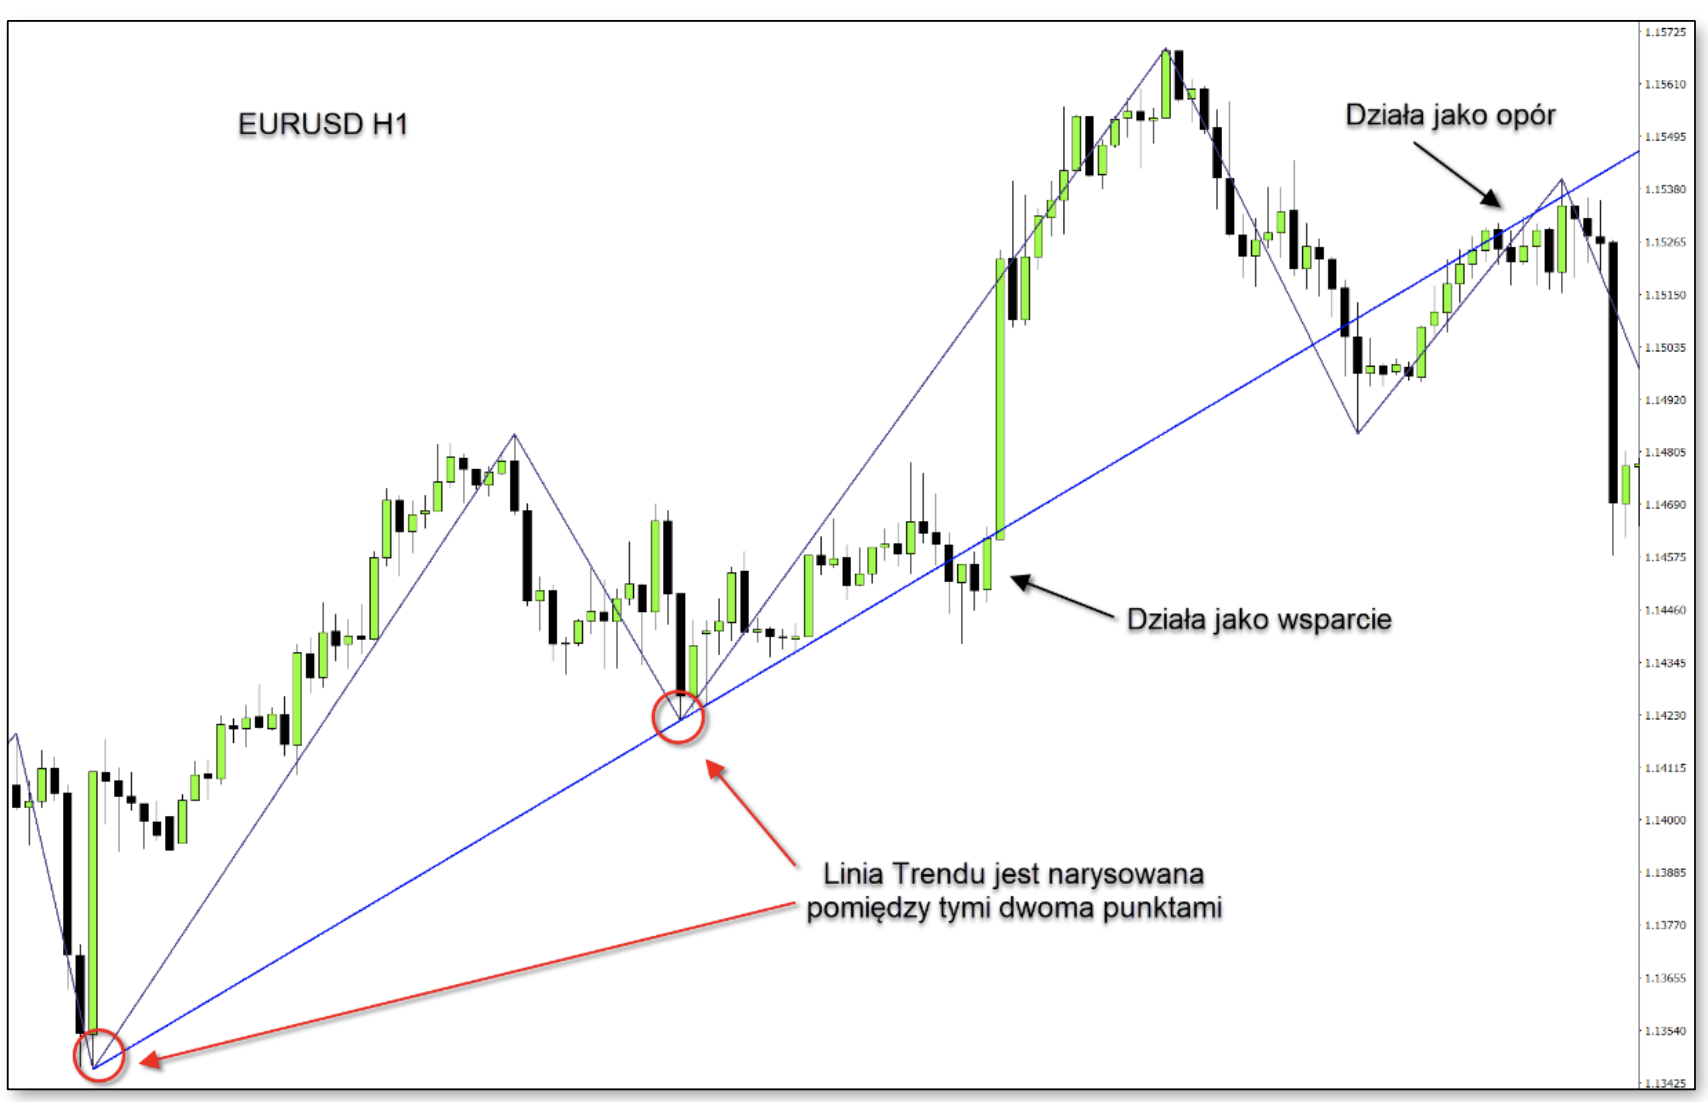
The standard definition of the trend line is used to monitor changes in price trends. Hence the trend lines are drawn below prices in the upward trend and above in the downward trend. Trend lines indicate true levels of support and resistance.
What are microlines?
They use the terminology of microlines, which is why I determined the momentum at only three candles. How it's working? We draw a trend line at the two highest / lowest prices for the next two candles. We observe the behavior of the third candle in relation to the drawn microline.
We draw microlines using only two candles. We can draw them both in an upward and downward market.
Determination of microlines in an upward trend:
- Find two more candles with higher high prices.
- The highest price on the second candle must be higher than the highest price on the first candle.
- Draw a line combining the highest prices of both candles.
- When drawing a line, make sure that - the radius: in the line setting is on.
When analyzing the momentum, pay attention to the behavior of the third candle in relation to the drawn microline.
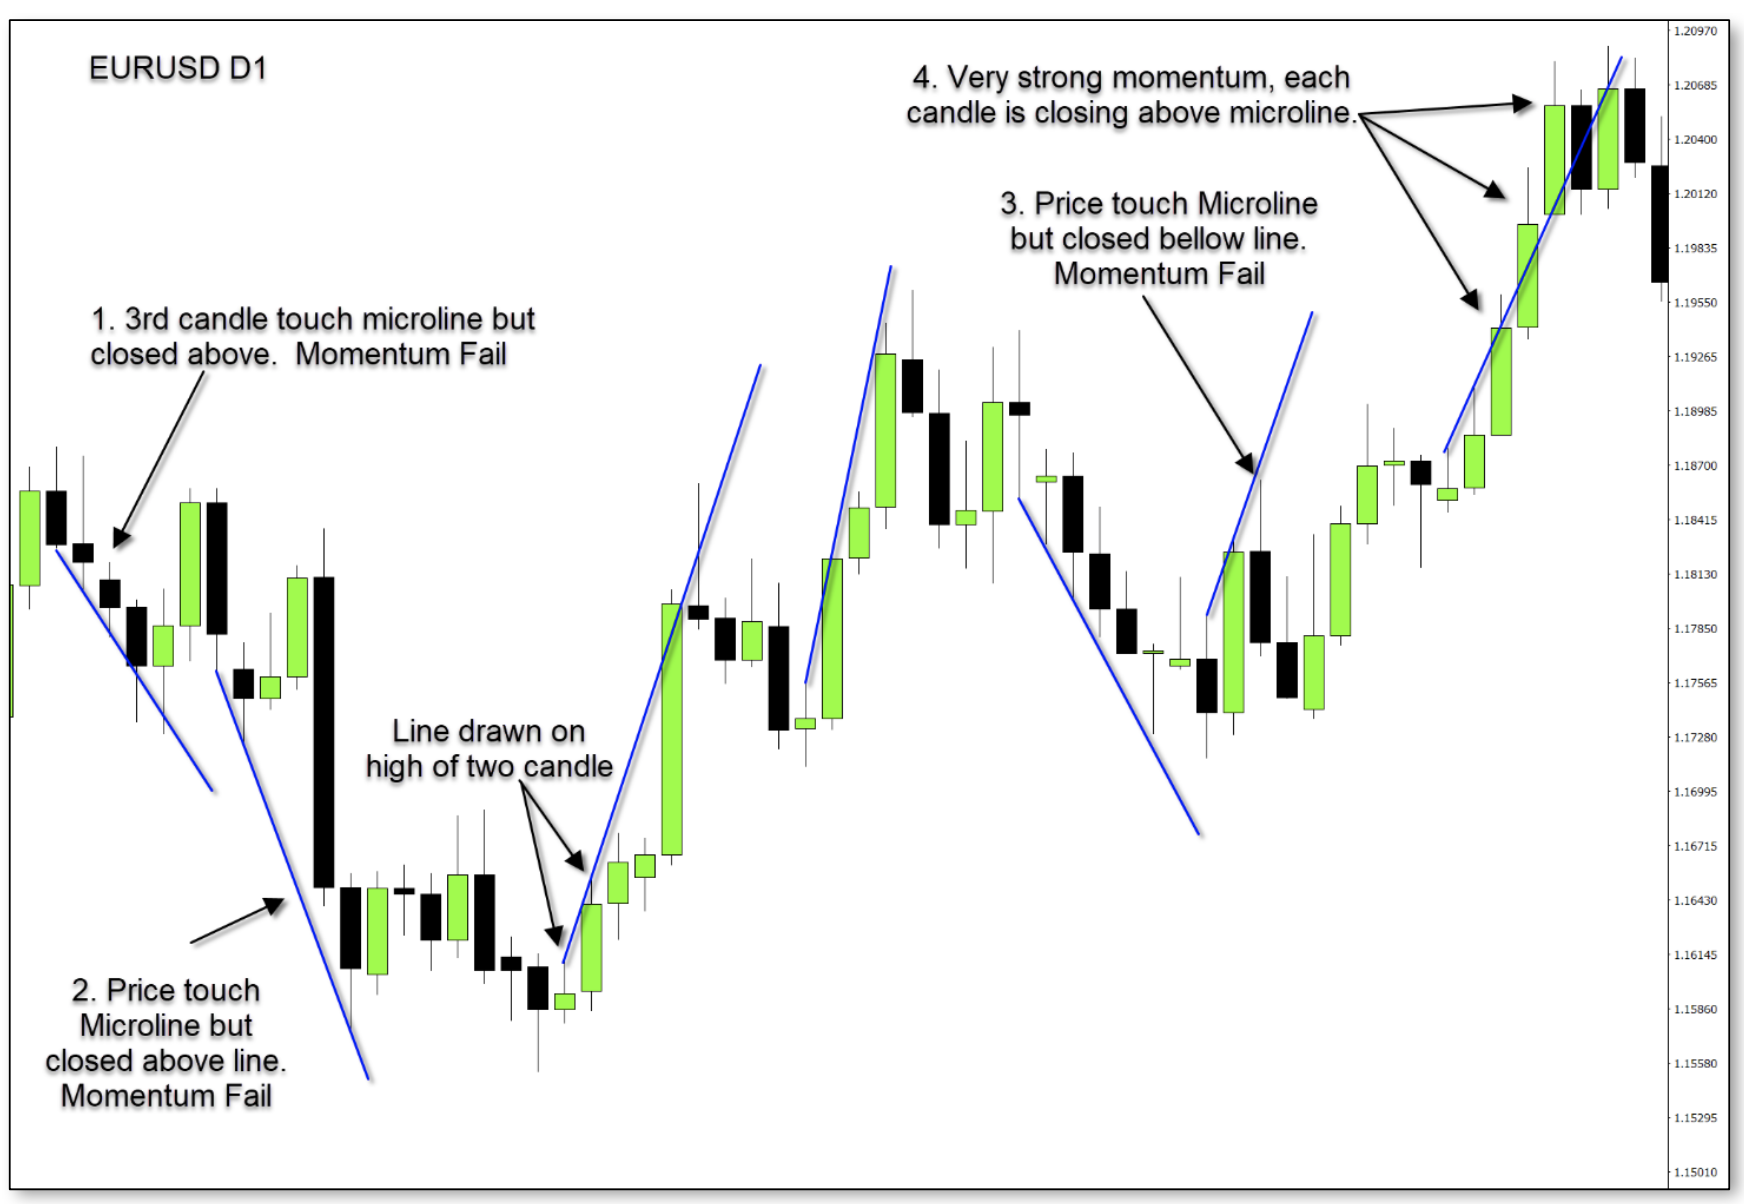
Important points about momentum in the uptrend:
- The highest price above the line - strong impetus (point 4);
- The price touches the line, but the candle closes below the line - loss of momentum (point 3);
- Does not touch the line - no momentum (point 5).
For the impetus in the downward trend, we draw a line by connecting the lowest prices in two consecutive candles, creating a downward microline.
Important points for impetus analysis in the downward trend:
- The third candle closes below the microline - strong impetus for price changes;
- The price touches the line, but the candle closes above the microline - loss of momentum;
- Does not touch the line - no momentum.
How to use the momentum changes in your own strategy
Being able to read momentum is very important knowledge. Every time you notice upcoming impetus changes, you have the option of either continuing to trade in line with the trend or waiting for another signal. Your decision depends on the analysis of changes in momentum in the context of the market.
In the chart below, I present another example of using microlines. Note - Not all microlines are included in the chart.
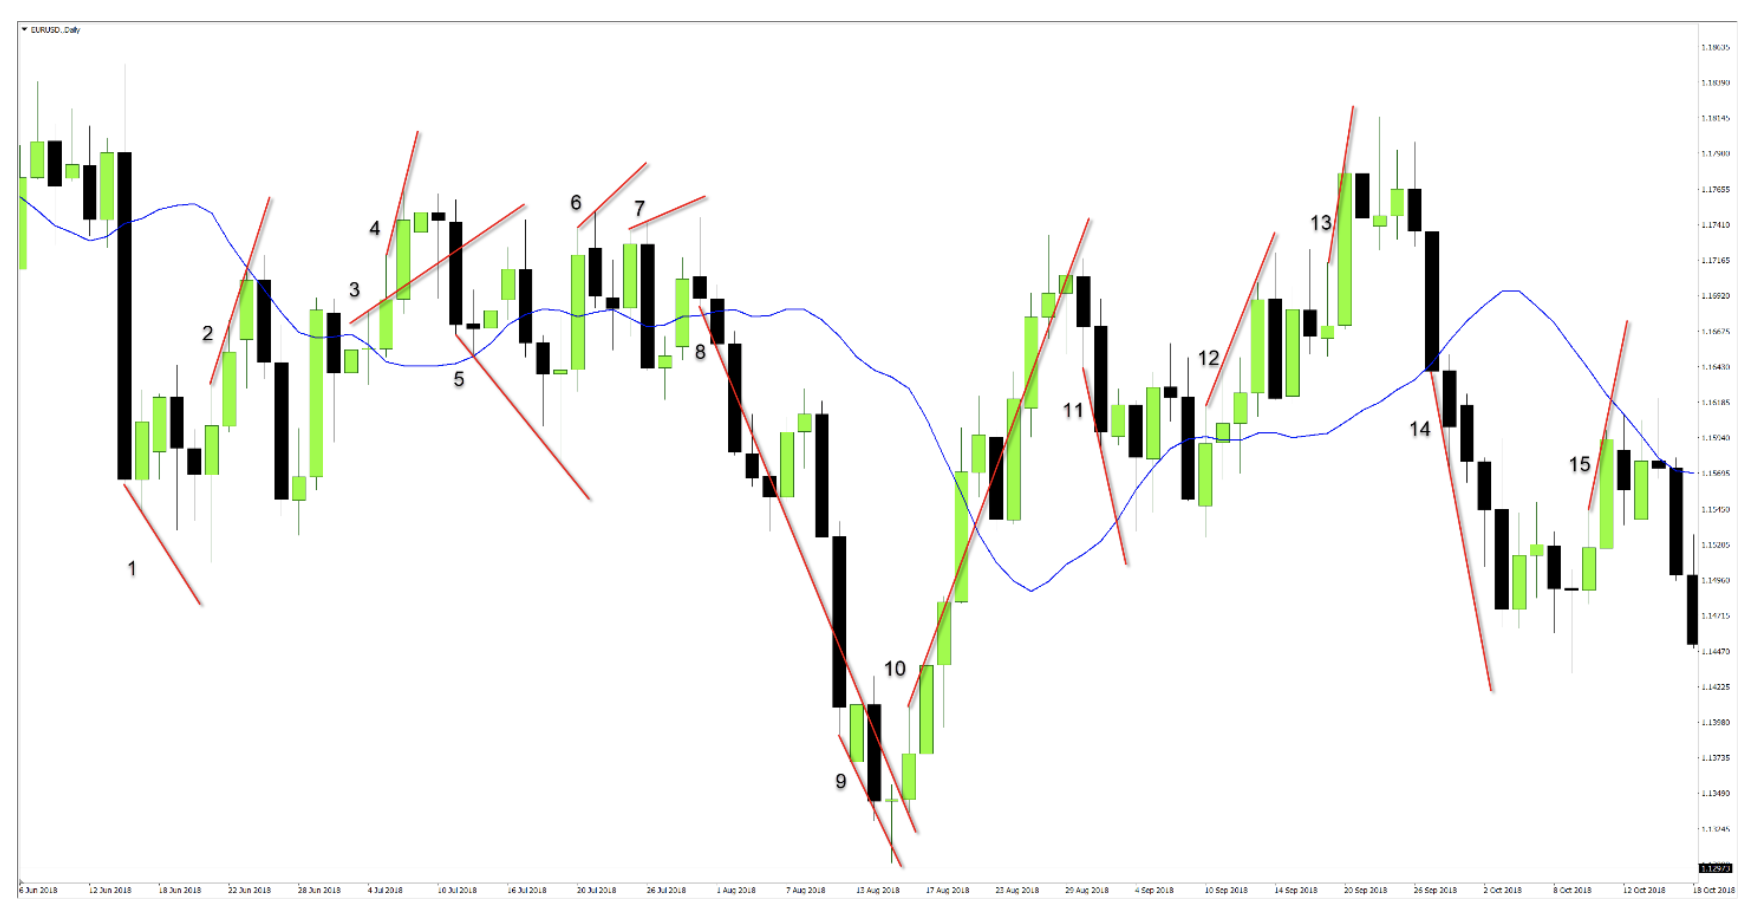
- Lines 1,2, 4, 5, 6, 7, 11, 13 and 15 indicate complete loss of momentum and reverse trend.
- Lines 3, 8 and 10 indicate an increase in momentum and a sharp increase in price.
This method indicates the upcoming changes in trend based on the next candle. Once you understand this phenomenon, i.e. the recognition of impetus weakening, you will be able to determine a favorable place to open a position in the trend. Turn on your chart and try to draw microlines and discover new information what price shows you using microlines.
Attention - this technique should be supported by correctly designated levels of support and resistance.


Is this Poniat from Canada? I know well