


Consumer Staples - How to invest in companies from the consumer goods sector? [Guide]

Consumer staples these are companies that supply basic consumer products. The consumer staples category includes products such as food, drinks, home products, hygiene products and stimulants (such as alcohol and cigarettes). These types of products are believed to be non-cyclical. This means that the demand for this type of products does not change drastically during a downturn. Due to the characteristics of this sector, one should not expect a rapid, organic growth in the scale of business. On the other hand These types of companies usually have high margins and generate a lot of FCF, which are spent on acquisitions of smaller competitors, dividend payment and share buyback. Owning companies in the consumer staples sector gives the investor less volatility in the portfolio. It is also worth mentioning that many companies in this industry pay dividends on a regular basis, which can be a plus for "dividend investors". However, it should be remembered that the consumer goods market is very wide and heterogeneous. A company that sells tobacco products labeled "unhealthy" is one thing, and a company with a wide range of hygiene products is another thing. If an investor does not want to analyze each company separately, he can take advantage of ETF offersthat give exposure to the consumer staples market. One of these ETFs is iShares Global Consumer Staples (KXI).
S&P Global 1200 Consumer Staples Sector Capped Index
It is an index that was created by S&P Global. The purpose of this index is to create a benchmark that will reflect the behavior of the "global" consumer goods market. The index was established in May 2019 and has been calculated historically since December 31, 1997. The number 1200 in the name does not represent the number of components. This is the name of the "main index" of the S&P Global 1200. Currently, this index selects companies operating in the consumer staples sector, which are included in the S&P Global 1200 index.
The total number of companies in the S&P Global 1200 Consumer Staples Sector Capped Index is 90, coming from 18 countries. The United States (32) and Japan (13) have the most representatives.. The United Kingdom (9) and Canada (5) are also significantly represented. Interestingly, the index does not include any representative of the Chinese, Indian or Korean market. According to data prepared by S&P Dow Jones Indices, in terms of capitalization, the most important companies are American (approx. 54%), British (approx. 13%) and Swiss (10%) companies. In the index at the end of October 2021, the average capitalization was above $ 52,8 billion. The median capitalization of the index companies exceeded $ 23,6 billion.
It is worth noting that among the ten largest components of the index there are two representatives of stores selling consumer products (Costco, Walmart), one representative of the tobacco market (Philip Morris) and one alcohol producer (Diageo). Among the companies in the top 10 there are also companies well known to consumers (eg Coca-Cola, Pepsi, Nestle or L'Oreal). It is worth mentioning that the top 10 components have more than half the share of the entire index.
iShares Global Consumer Staples ETF
However, the trader is not able to invest directly in the S&P index. The way out of this situation is to take advantage of ETFs offering exposure to this index. One of them is iShares Global Consumer Staples (KXI). The mentioned ETF was established in September 2006. As of the end of November 4, assets under management totaled $ 665,4 million. The ETF consists of 91 companies. Average price/Profit (P / E) on November 4 was 25,0. It is also worth adding that the moving dividend yield was 2,46%. The annual management cost is 0,43%. Due to the fact that the ETF replicates the index physically, the distribution of sectors and the largest positions in the portfolio is very similar to the composition of S&P. For this reason, below we present a list of the top 10 positions in the portfolio and a brief overview of the selected 6 companies.
Read: ETFs - Physical or synthetic replication? What is better?
Top ETF positions as of November 4:
| Company name | Participation in the index |
| Nestle S.A | Present in several = 9,36% |
| Procter & Gamble | Present in several = 8,68% |
| Coca-Cola | Present in several = 5,03% |
| Costco Wholesale | Present in several = 4,93% |
| Pepsico | Present in several = 4,67% |
| Walmart | Present in several = 4,57% |
| Philip Morris International | Present in several = 3,75% |
| Unilever PLC | Present in several = 3,55% |
| Diageo PLC | Present in several = 3,04% |
| L'Oreal SA | Present in several = 2,97% |
Nestle
The beginnings of the company date back to the 60s. Nestle is a Swiss food concern, which is also one of the largest companies in the world. It is worth mentioning that it is also one of the most famous consumer brands in the world. The company produces products in such categories as baby food, bottled water, tea, coffee, pet food, snacks, ice cream, sweets and dairy products. The brands belonging to the Nestle concern include, among others Gerber, Nespresso, Nescafe, Kit Kat, Nesquik, Maggi, Perrier water, Cheerios, Haagen-Dazs, Felix and Purina. The company sells its products in over 180 countries around the world. The company generates the highest revenues on the AMS market (North, Central and South America). This region was responsible for 37,7% of the company's revenues. The largest share in the company's revenues is represented by beverages and food for animals. Nestle employs approximately 273. employees. The current capitalization of the company exceeds CHF 338 billion.
| CHF million | 2017 | 2018 | 2019 | 2020 |
| revenues | 90 121 | 91 750 | 92 865 | 84 681 |
| operational profit | 14 890 | 15 461 | 16 190 | 14 434 |
| operating margin | Present in several = 16,52% | Present in several = 16,85% | Present in several = 17,43% | Present in several = 17,05% |
| net profit | 7 183 | 10 135 | 12 609 | 12 232 |

Nestle stock chart, interval W1. Source: xNUMX XTB.
Procter & Gamble
It is one of the largest consumer products companies. It is worth mentioning that it is the company with the longest "history" of the current components of the Dow Jones Industrial Average index. P&G joined the Dow Jones Index in 1932. It is also worth adding that Procter & Gamble has been increasing the dividend amount consistently for 65 years. The company has a very rich "portfolio" of brands, which include: Ariel, Oral-B, Blend-a-med, Pampers, Lenor, Fairy, Gillette, Braun, Old Spice, Head & Shoulders and Always. The company generates the highest sales in the countries of North America (47%) and Europe (22%). In turn, the Chinese market is responsible for approximately 10% of P&G revenues. In terms of products, products for clothes (eg Ariel) and home products (eg Ambipur, Mr. Clean) dominate. These products account for approximately 34% of revenues. The beauty market is responsible for about a quarter of revenues. The current capitalization of the company exceeds $ 353 billion.
| billion USD | 2018FY | 2019FY | 2020FY | 2021FY |
| revenues | 66,832 | 67,684 | 70,950 | 76,118 |
| operational profit | 13,689 | 14,207 | 16,860 | 18,793 |
| operating margin | Present in several = 20,48% | Present in several = 20,99% | Present in several = 23,76% | Present in several = 24,69% |
| net profit | 9,485 | 3,634 | 12,764 | 14,306 |
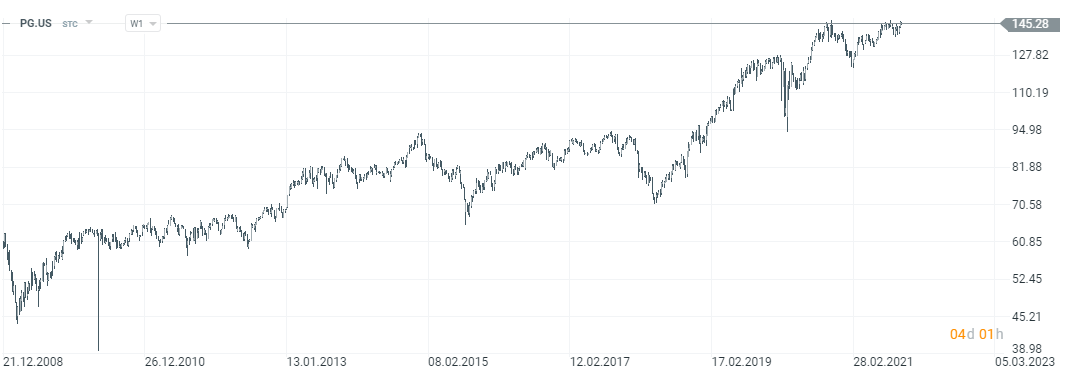
Protect & Gamble stock chart, interval W1. Source: xNUMX XTB.
Coca-Cola
Coca-Cola is one of the most famous consumer brands in the world. The origins of Coca-Cola date back to 1886, when John Pemberton began selling the drink in Atlanta. In 1892, a company was established that had the rights to produce and the Coca-Cola brand. In the following years, the company expanded its product offer and started with foreign expansion. Interestingly, in 1982, Coca-Cola acquired Columbia Pictures for $ 750 million, which was sold in the late XNUMXs. Currently, Coca-Cola specializes in the production and sale of beverages. In addition to the most popular brands of carbonated drinks (Coca-Cola, Fanta, Sprite, Schweppes), Coca-Cola Company also has water brands (Ciel, Aha, Dasani). The company also has brands of juices or products based on milk or vegetables and fruit (Ades, fa! Rlife, Simply) and brands of products based on coffee and tea (fuzetea, Costa Coffee). The company generates the most revenues in the region of North America (34,7%) and EMEA (Europe, Middle East and Africa), which is responsible for 16,8% of the company's sales. The company's current capitalization exceeds $ 245 billion.
| million USD | 2017 | 2018 | 2019 | 2020 |
| revenues | 35 410 | 31 856 | 37 266 | 33 014 |
| operational profit | 9 652 | 9 781 | 10 533 | 9 824 |
| operating margin | Present in several = 27,26% | Present in several = 30,70% | Present in several = 28,26% | Present in several = 29,76% |
| net profit | 1 248 | 6 434 | 8 920 | 7 747 |

Coca-Cola stock chart, interval W1. Source: xNUMX XTB.
Costco Wholesale
It is a wholesaler that allows you to sell your products if the customer purchases a membership fee that costs from $ 60 to $ 120 in the US. Membership rights revenue is $ 3,9 billion per year. The company was founded in 1976. The dynamic development of the company made it the 2021rd largest seller in the world in 3. Costco is also ranked 500th in the US Fortune 2021 ranking. At the end of August 815, Costco had 564 locations worldwide. Of these, 105 in the United States, 39 in Canada and 30 in Mexico. The company is also present in Asia and the Pacific with 16 locations in Japan, 14 in South Korea, 12 in Taiwan, 1 in Australia and 146 in China. The average area of one store is 2021 thousand. square feet. Costco employed 288 employees at the end of August 000. The company's capitalization is $ 226,7 billion.
| million USD | 2018FY | 2019FY | 2020FY | 2021FY |
| revenues | 141 576 | 152 703 | 166 761 | 195 929 |
| operational profit | 4 480 | 4 737 | 5 435 | 6 708 |
| operating margin | Present in several = 3,16% | Present in several = 3,10% | Present in several = 3,26% | Present in several = 3,42% |
| net profit | 3 134 | 3 659 | 4 002 | 5 007 |
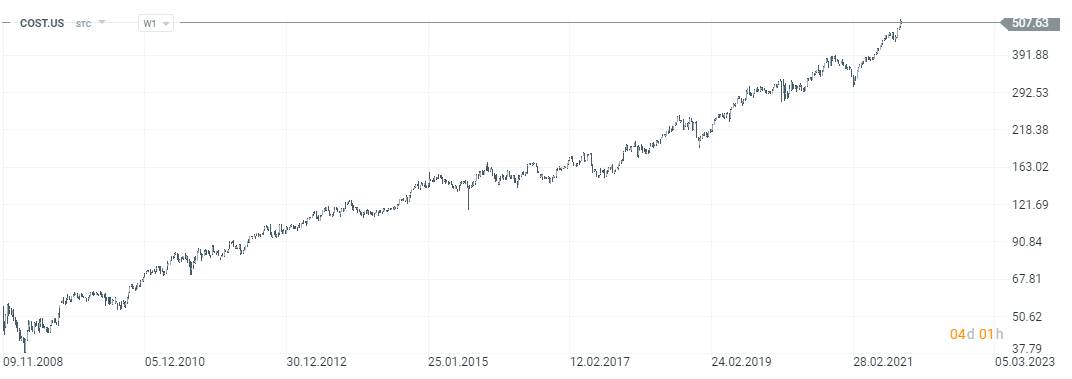
Costco Wholesale stock chart, interval W1. Source: xNUMX XTB.
Pepsico Inc.
It is one of the largest companies that offers its customers drinks and snacks. The company's history dates back to 1898, when Pepsi-Cola was founded by Caleb Brandham. The following years brought expansion inside the United States and on foreign markets. Pepsi also diversified outside the beverage segment. For example, in 1977 the company acquired the Pizza Hut brand. A year later, Pepsi acquired the Taco Bell chain. In 1986, PepsiCo acquired KFC from RJ Reynolds. However, in 1997, the company decided to sell the restaurant division, which is now listed on the stock exchange as Yum! Brands. One of the most important decisions PepsiCo made was the merger with Frito-Lay in 1965. Currently, the company has brands such as: Pepsi, 7up (outside the US), Mirinda, Tropicana. Except that PepsiCo has the rights to brands such as Ley's, Cheetos, Ruffles and Doritos. 55% of revenues come from the snacks segment. Geographically, the 5 largest markets generate 75% of sales. The US market has the largest share (58%). The company's capitalization is $ 229 billion.
| million USD | 2017 | 2018 | 2019 | 2020 |
| revenues | 63 525 | 64 661 | 67 161 | 70 372 |
| operational profit | 10 509 | 10 110 | 10 291 | 10 080 |
| operating margin | Present in several = 16,54% | Present in several = 15,64% | Present in several = 15,32% | Present in several = 14,32% |
| net profit | 4 853 | 12 513 | 7 314 | 7 120 |
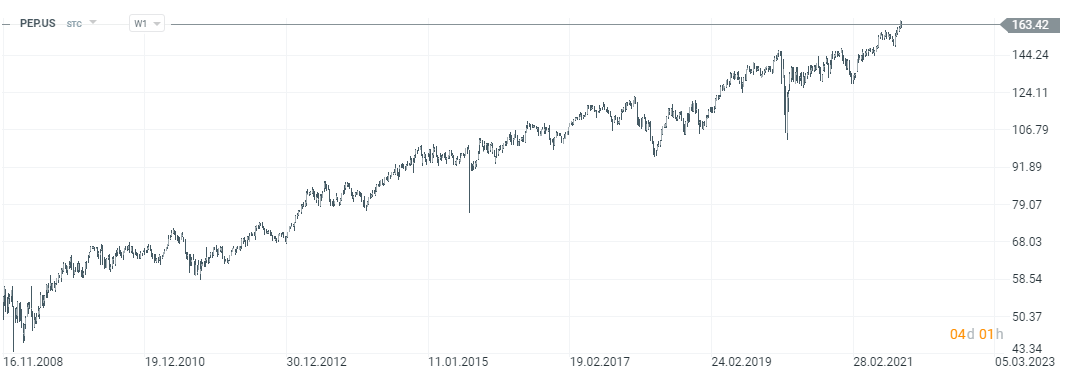
Pepsico stock chart, interval W1. Source: xNUMX XTB.
Walmart Inc
The company was founded by Sam Walton in 1962. Over the next several decades, Walmart became the largest retailer in the world for retail products. Since 2014, it is also a public company that generates the largest revenues in the world. The company also employs over 2,3 million people. Walmart operates a supermarket chain with the largest markets in the United States, Mexico and Canada. The company also owns shares in the Indian company Flipkart, which operates in the e-commerce market. It is worth adding that as a result of competition with Amazon, Walmart is developing services for selling food products via the Internet (Walmart.com). In addition, in March 2021, Walmart launched an express delivery service from over 3000 stores (delivery up to two hours from the moment of placing the order).
| million USD | 2017 | 2018 | 2019 | 2020 |
| revenues | 500 343 | 514 405 | 523 964 | 559 151 |
| operational profit | 20 937 | 21 957 | 21 468 | 26 948 |
| operating margin | Present in several = 4,18% | Present in several = 4,27% | Present in several = 4,10% | Present in several = 4,82% |
| net profit | 10 523 | 7 179 | 15 201 | 13 706 |
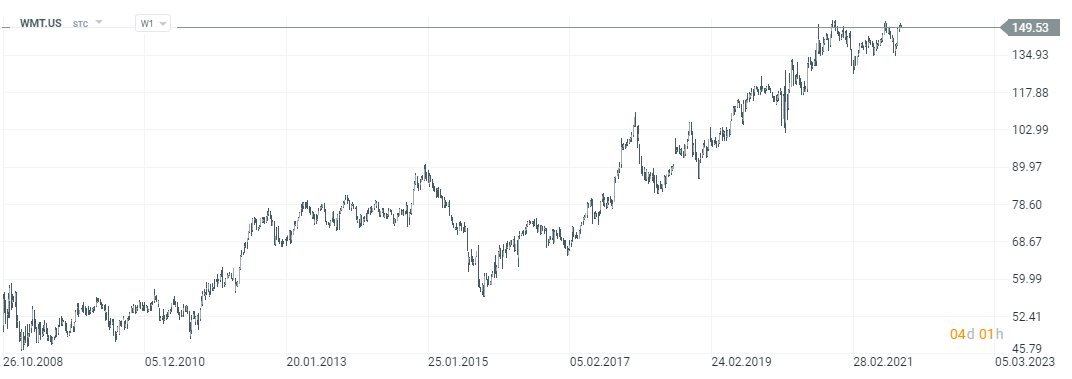
Wal-Mart stock chart, interval W1. Source: xNUMX XTB.
Additional information about KXI
This ETF is listed in the United States. This means that the investor must have access to a foreign market and be able to invest in foreign ETFs (some Polish brokers cannot offer direct investment in US ETFs to retail investors). ETF iShares Global Consumer Staples has generated an average annual rate of return (total return) of approximately 8,3% since its inception. However, over the past 10 years, the average annual rate of return has been 9,3%. The average rate of return is due to the fact that the main share of the ETF is held by mature companies with an established position and single-digit organic growth. A positive aspect is the security of investments (lower volatility and regular dividends). On the other hand, it is an interesting solution to the more conservative part of the portfolio.
Consumer Stamples - Where to Invest in Stocks and ETFs
An increasing number of forex brokers have quite a rich offer of stocks, ETFs and CFDs for these instruments.
For example on XTB Today, we can find over 3500 equity instruments and 400 ETFs, a Saxo Bank over 19 companies and 000 ETF funds.
| Broker |  |
||
| End | Poland | Denmark | Cyprus * |
| Number of exchanges on offer | 16 exchanges | 37 exchanges | 24 exchanges |
| Number of shares in the offer | approx. 3500 - shares circa 2000 - CFDs on shares |
19 - shares 8 - CFDs on shares |
approx. 3 - CFD on shares |
| The amount of ETF on offer | approx. 400 - ETF approx. 170 - CFD on ETF |
3000 - ETF 675 - CFD on ETF |
approx. 100 - CFD on ETF |
| Commission | 0% commission up to EUR 100 turnover / month | according to the price list | Spread depends on the instrument |
| Min. Deposit | PLN 0 (recommended min. PLN 2000 or USD 500, EUR) |
0 PLN / 0 EUR / 0 USD | PLN 500 |
| Platform | xStation | SaxoTrader Pro Saxo Trader Go |
Plus500 platform |
* PLUS500 CY offer
CFDs are complex instruments and come with a high risk of losing money rapidly due to leverage. From 72% to 89% of retail investor accounts record monetary losses as a result of trading CFDs. Think about whether you understand how CFDs work and whether you can afford the high risk of losing your money.


Leave a Response