


EUR / USD Pivot Points - Popular Forex Strategy

Forex strategy EUR / USD Pivot points is a strategy based on the concept of pivots. We calculate points at the beginning of each day. To calculate the current pivot points, traders use the value of the previous day's trading range.
| Suitable for | EUR / USD |
| instruments | Spot forex and forex CFD |
| Transaction type | Day trading |
| The rate of the transaction | Several signals per day on the 30-minute chart |
| WHS ProStation platform | Manual trade |
| WHS FutureStation platform | Manual or semi-automatic trade |
| MetaTrader 4/5 | Manual trade |
EUR / USD Pivot points - details of the strategy
We calculate Pivot points at the beginning of each day, and we recognize their validity until the end. The formula for calculating these points is presented in the table below. There is nothing sophisticated about the pivots. Their market value lies in the fact that many financial market participants observe and use them. Due to this great interest in Pivot Points, they become relevant.
Above the central Pivot Points, there are three levels of resistance. Below the central pivot levels there are three levels of support. These seven are calculated as follows:
| Pivot | = (High + Close + Low) / 3 |
| 1 resistance 1 support |
= (2 * Pivot) - Lower = (2 * Pivot) - High |
| 2 resistance 2 support |
= Pivot + (Resistance 1 - Support 1) = Pivot - (Resistance 1 - Support 1) |
| 3 resistance 3 support |
= High + 2 * (Pivot - Low) = Low - 2 * (High - Pivot) |
The strategy draws green zones (above the lines) and red zones (below the lines) around these seven levels based on pivot points. The edges of these levels are 15 pips below and above the pivot line.
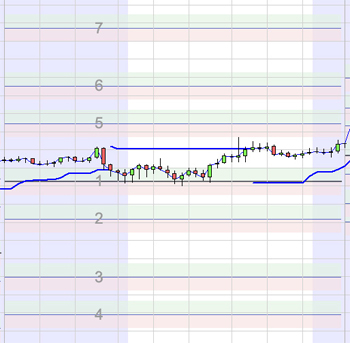
This example shows seven pivota lines and their individual red and green zones.
When volatility is low, individual levels may overlap. The strategy will not respond to delivered signals if the distance between the pivot points is less than or equal to the 20 pips.
Trading strategy EUR / USD Pivot points is based on 30-minute charts.
When should I open the position?
Strategy EUR / USD Pivot points uses the SuperTrend indicator as a filter for signals. If we receive a positive signal from the SuperTrend indicator, then we only wait for long positions. If we get a negative signal, we await further sell signals. We have marked SuperTrend as a blue line in the chart.
If SuperTrend is above the price chart then the trend is negative. If SuperTrend is below the price chart, then the trend is positive.
Buy signal is generated when the market price, after it closes in the green or red zone at least once, closes above the green zone.
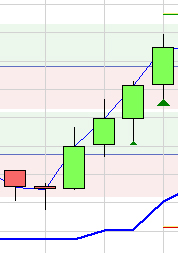
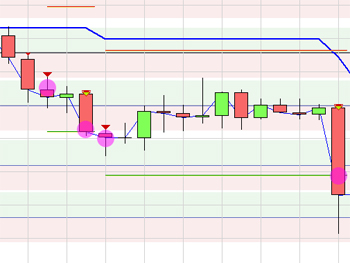
In this example, the market price explodes from the green zone. The SuperTrend filter (blue line) is below the market price, indicating a positive trend. We open a long position at the market price from the opening of the next candle.
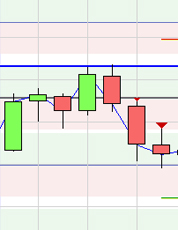
In this example, the market price closes outside the red zone. The SuperTrend filter (blue line) is above the market price, indicating a negative trend. We open a short position at the market price at the opening of the next candle.
When to close the position?
Sales signal is generated when the market price, after at least one closing in the green or red zone, closes above the red zone.
Strategy EUR / USD Pivot points use stop loss and take profit (profit target). Stop loss is unconventionally set at 50 pips and profit target at a lower level of 25 pips. We do not hold the positions overnight. We suspend further trading until 9:00 am the next day.
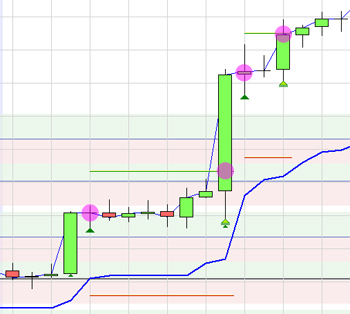
This example shows the next buy signals. We open the first long position after the market price closes above the green zone. We place stop orders at a distance of 50 pips (red line) and profit target (green line) at a distance of 25 pips. After some time, the price goes up and the profit target is reached. We open the second long position when the market price reaches the green level (candle closing). Two candles later we see the price reaching our TP. We close both positions with a profit.
This example shows two short positions. We open the first short position when the market price reaches the red zone. We place stop orders at a distance of 50 pips (red line) and profit target (green line) at a distance of 25 pips. After some time, the price starts to drop and the profit target is reached. A second short position opens when the market moves below the second red zone. Twelve candles later the profit target is reached. Both positions are closed with a profit.
Pivot points on MetaTrader 4
Due to the fact that pivot points are not available as standard on the MT4 platform, you need to equip them yourself. You can download them from our forum in section Download - Download Pivot Star Indicator.
EUR / USD Pivot points - Summation
EUR / USD strategy Pivot uses well-known pivot points to determine buying or selling zones. It is an easy transaction strategy that moves at a calm pace on the 30-minute chart. This is an interesting strategy for investors who do not like rushing.


Leave a Response