


Range Projection - swing trading strategy

The Range Projection trading strategy is a swing trading strategy. It was created by a German trader-trainer Rene Wolfram. Range Projection is a trend reversal strategy. A trend reversal strategy tries to identify points in time when a trend is about to change direction. We open the position when the trend changes.
| Suitable for | Shares |
| instruments | CFD |
| Transaction type | swing trading |
| The rate of the transaction | 1 signal weekly / shares, every 2-4 weeks |
| WHS ProStation platform | Manual trade |
| WHS FutureStation platform | Manual or semi-automatic trade |
| MetaTrader 4 | Manual trade |
What Range Projection is based on
This strategy tries to identify a pure trend in its view. Exceptionally, technical indicators or candlestick patterns are not used to identify a trend. In her opinion, the strategy is looking for a "big" candle. The definition of a "big" candle is as follows: the absolute value of the opening price minus the closing price must be> 1,5x the 15-period Average True Range (ATR). Additionally, this candle must be larger than both the preceding and the following candles. Once a "big" candle is identified, the strategy colors the chart background blue.
Day candles are the dedicated interval for applying the Range Projection strategy.
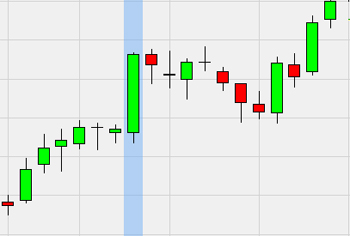
The strategy identified a "big" bullish candle (blue background).
When should I open the position?
The Range Projection strategy is a trend reversal strategy. We open a long position when the negative trend is going to become a positive trend. A short position will open when a positive trend intends to reverse and become a negative trend. The price to take a position is based on the "big" candle.
The long position requires a large bear candle. Buy signal (entry level) is the closing of the big candle minus the body of the big candle.
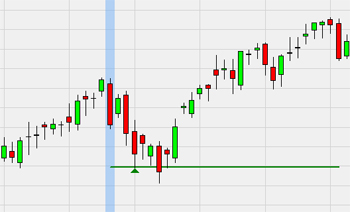
In the example above, there is a "big" bear (blue background). The entry level (green line) for the long position is the close of the "big" candle minus the body of the big candle.
We take a long position at a price. market at the time. intersection from the top of the entry level. Price doesn't have to close below the entry level.
A short position requires a large bull's candle. Sales signal (entry level) is the closing of the big candle plus the body of the big candle.
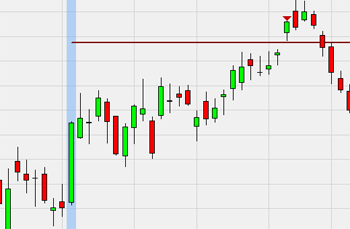
In this example, a "big" bull candle (blue background) appears. The entry level (red line) for the short is the close of the big candle plus the body of the big candle.
When we observe a cross from the bottom of the entry level through the market price, we take a short position at the current price. We don't have to wait for the candle to close above the entry level.
When to close the position?
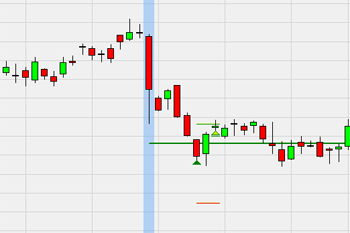
The Range Projection strategy uses profit target and fixed stop orders. The profit target is 50% of the body of the big candle. Fixed stop is 2x ATR calculated over 15 periods.
The example above shows a buy signal. Crossing the entry level from the bottom through the market price means for us a signal to take a long position (green triangle). Stop Loss we put it in the place of the red line and Take Profit in the place of the green (short) line. In this situation, we reach TP in two days. later after entering the market.

This example shows a signal to take a short position. When the market crosses the entry level from below, the short position is closed (red triangle). Fixed stop (thin red line) and profit target (thin green line) are set. We close the position with a profit when the market price reaches Take Profit three days later.
Range Projection - a strategy worth attention
Although we can classify this strategy as a trend reversal, many of these 'reversals' are only temporary in nature. Even so, profit target orders aren't overly ambitious, making these temporary reversals appropriate for trades. This strategy is only suitable for stocks. More active traders can also experiment on 30-minute time frames.


