


Fractal indicator - How to use it in your daily analysis?

Fractal indicator - How to use it in your daily analysis?
Undoubtedly, the word "fractal" is associated only with a large group of traders with the educational platform and training (Check it out: Fractal Trader goes to the list of KNF warnings). Therefore, it can arouse a number of positive or negative emotions and various guesses related to the indicator we discuss. Its creator is the world-famous trader Bill Williams, who became famous for developing not only this tool of technical analysis. I think that the vast majority of traders have heard about Awesome Oscillator, Accelerator Oscillator and/ or Alligator. Each of them is so practical and compatible that they can be used together with each other and next to a wide variety of other AT tools, not necessarily created from the ideas of Bill Williams. Today we will focus only on the Fractal.
What is the Fractal indicator made of?
The popularity of the use of indicators and oscillators created by Bill Williams did not come out of nowhere. Describing its components in the simplest way, we can say that they are based on two basic assumptions without which we cannot talk about the functioning of markets. It is the cyclical nature of exchanges and quotations. Fractal in the colloquial sense means "Self-similar object". Taking as a reference the natural definition of a fractal, one can guess that it will occur on the market (or as an indicator) looking for certain formations "Self-similar"that make up the trend.
Of course, the indicator is lagging behind the market. It takes time for them to form. Fractals (which we will show later in various charts) may look different depending on the platform. Usually, however, they cover a minimum of 5 candles.
The Fraktal indicator is available on most trading platforms as standard (MT4, MT5, JForex, cTrader, NextGeneration).
Fractal operation
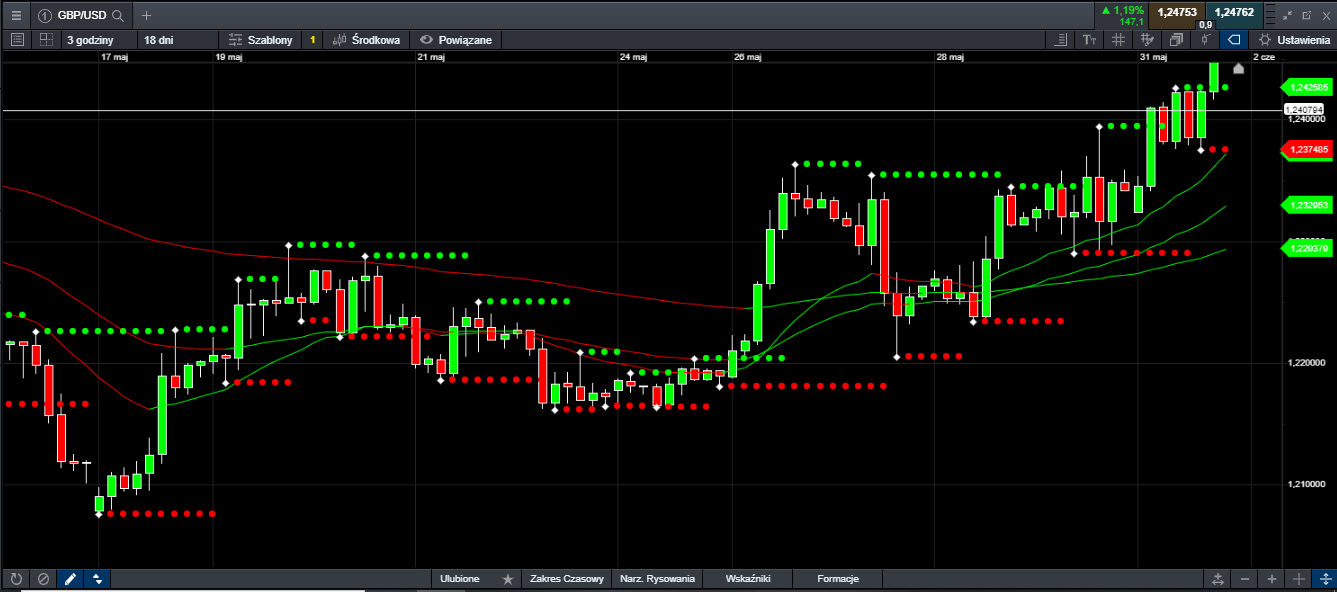
As we can see in the chart below, Fractals are most often used to locate peaks and holes in the chart. Therefore, they are used in popular analysis Price Action, where they are helpful for determining support and resistance levels.

Platform fractal indicator xNUMX XTB xStation.
Below, however, are fractals with a defined level of support and resistance. By drawing a horizontal line on a selected fragment of quotations with the indicator, we can see clearly visible levels.
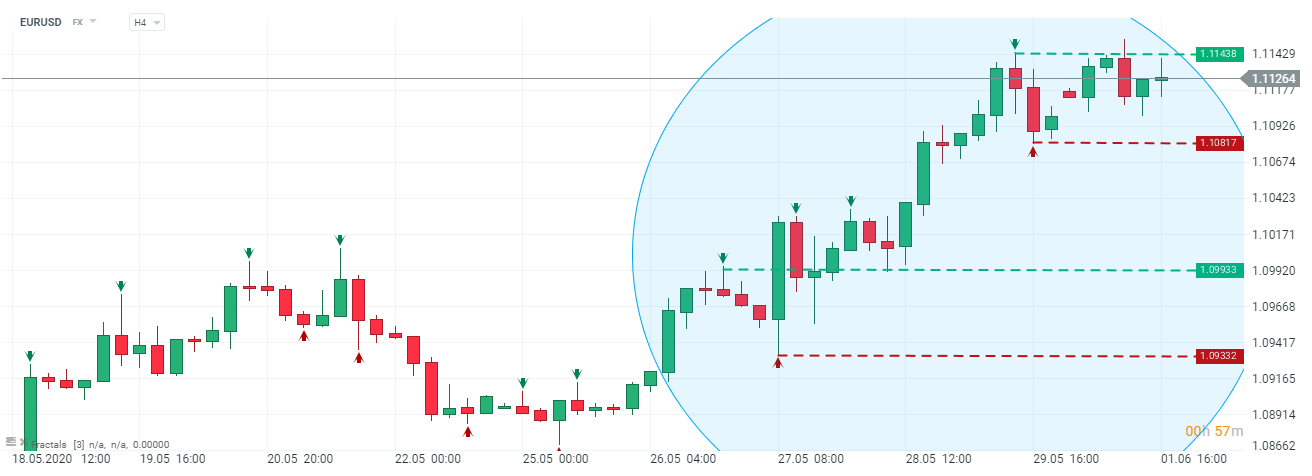
Fractal indicator with levels of support and resistance on the platform xNUMX XTB xStation.
We can, from the points formed on the chart, draw a line and determine levels more readable for us. Fractals are used at every time interval. They do not change their position during shaping and after full development. We mentioned a little higher that they form on at least 5 candles. With this information in mind, it should be understood as:
- during the (at least) 5 candles there is one highest / lowest
- two globe to the left and two globe to the right of the highest / lowest candle must be lower - rising fractal, or higher - falling fractal.
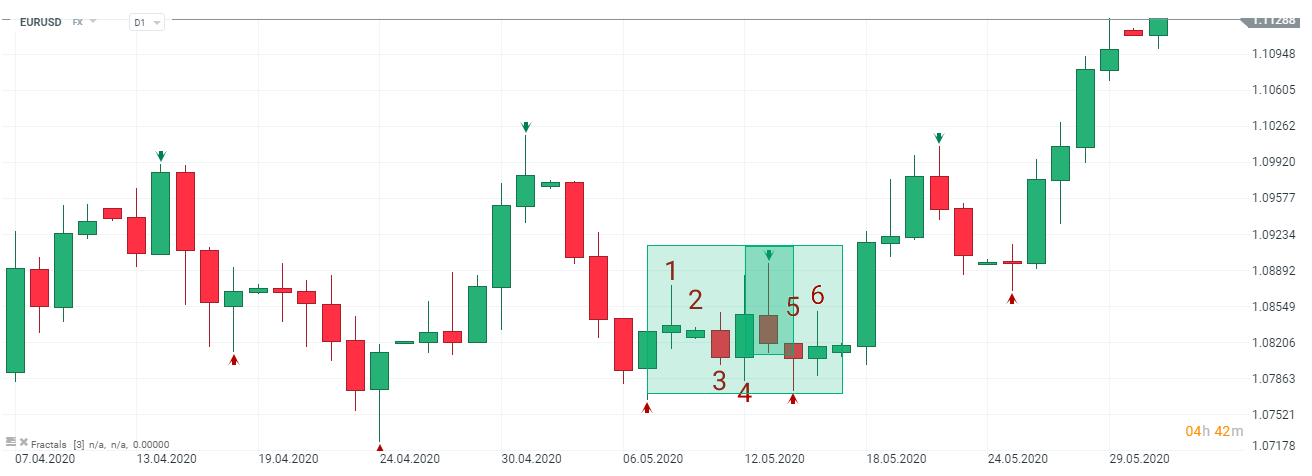
We will illustrate this with the above example. The candle between the numbers, marked with a fractal and "double" green, is higher than at least two previous ones (we have more of them marked with numbers 1, 2, 3, 4) and the two following it (5, 6).
As you have probably noticed, the fractals on the chart take low or high values, i.e. the highest or lowest price, on the candle chosen according to the above rules. On some platforms, e.g. NextGeneratin from CMC Markets, fractals have "additive" levels. They look according to the chart below.
The Fraktal indicator on the NextGeneration platform.
How to use the indicator?
In fact, we should not (taking into account the concept of indicator) use the fractal itself. Due to its compatibility and usability, we can apply it to more or less complex transaction systems and at various intervals. Bill Williams did not impose any contraindications to the use of the fractal with other technical analysis tools. It will be extremely useful for people who use trend analysis in their strategies. They can successfully apply it on current and historical quotes. Bill Williams argued that markets spend 15% - 30% of the time in trend. Therefore, the fractal is primarily used to catch its changes quickly.
An undoubted disadvantage of this indicator is the large number of signals at lower intervals. Therefore, we must focus on devoting more time to filtering them. What's more, we cannot change its parameters and adjust it to your preferences, e.g. that the fractal should be formed at the opening and closing prices, rather than the maximum and minimum prices of a given candle.
In the next article, dedicated to fractals, we will present several strategies that are well connected to this indicator.


Leave a Response