


Passive Investing and Exposure to Emerging Markets

Building a passive portfolio is both simple and difficult. Simple because it is "enough" to buy a few ETFsto have exposure to individual markets. At the same time, it is difficult because each investor has a limited number of resources (capital) and a different level of risk acceptance. For this reason, there is no one "best" passive wallet. However, the trader needs to be aware of the advantages and disadvantages of investing in certain ETFs. Without it, you cannot invest rationally. Therefore, instead of following the "fashion", it is worth spending your resources wisely. For this reason, in the coming months we will present information on selected ETFs. In this article, we will introduce you to ETFs that give you exposure to emerging markets - iShares Emerging Markets (EEM).
Check it out: Passive Investing - What is it? Advantages and disadvantages
What are emerging markets?
In the seventies there was a division into developed countries and the so-called LDC (less developed countries), which had a lower level of development than the United States, Canada, Japan and Western Europe. However, it was a very simplified picture. Less developed countries also divided into subgroups, some catching up with developed countries and others remaining permanently undeveloped. In 1981, an economist World Bank - Antoine Van Agtmael - coined the term emerging economies. These economies are in a "transition" phase. They were not typical underdeveloped countries, but at the same time they lacked developed country status. Over the years, there were criteria for developing countries to meet.
According to Julien Vercueil, the country should have:
- PPP revenues should be between 10% and 75% of the European Union average,
- fast economic growth, allowing for catching up with the differences in development,
- be in an institutional transformation.
The theory is that investing in emerging markets can provide high rates of return but at the cost of greater investment risks. The risk does not relate to the operating activities of the company itself, but also to currency, political and legal risk.
MSCI Emerging Markets Index
Lists of EM (emerging markets) countries are published by many analytical companies. For example company MSCI created an index grouping countries belonging to developing markets (MSCI Emerging Markets Index). In 1988, it included 10 countries. The weight of developing countries was only 0,9% of the MSCI ACWI index. Currently, the index comprises 26 countries and represents 12% of the MSCI ACWI index. The countries included in this index include: China, Brazil, Meksyk, Poland, the Czech Republic, Greece, Korea, the Philippines, South Africa and Russia.
The index in question is very concentrated. According to data prepared by MSCI Inc. an index that mimics the behavior of emerging markets, as many as 34,7% of assets are concentrated on Chinese marketand 14,7% on Taiwanese market. The next in terms of size is korean market (12,2%) and Indian (12,0%). As you can see, it is an index strongly focused on the Asian market. This is not surprising as the center of gravity of the world economy has been shifting towards Asia and the Pacific for many years.
It is worth noting that the MSCI Emerging Markets index does not have a "typical" emerging market structure. The index is not dominated by the financial, raw materials or energy industries. Companies have the largest share in the index technological (20,6%), followed by companies with the financial sector (19,6%) and discretionary goods (15,6%). E-commerce platforms are also included in the discretionary goods.
It is worth noting that there is no representative of the banking sector among the eight largest components of the index. On the other hand, companies selling products dominate E-commerce, holders super-application, chip manufacturers and manufacturers of consumer electronics.
There were 2021 companies in the index at the end of October 1417, with an average capitalization of more than $ 5 million. The median capitalization of the index companies exceeded $ 606 billion.
Be sure to read: Investing in Super-applications - the phenomenon of Asia and the Pacific [Guide]
iShares Emerging Markets ETF
However, an investor cannot invest directly in the MSCI index. The way out of this situation is to take advantage of ETFs offering exposure to this index. One of them is iShares Emerging Marketswhich is one of the most traded ETFs in the US market. The mentioned ETF was established in April 2003. At the end of November 2, assets under management totaled $ 29,99 billion. The ETF consists of 1237 companies. Average price/Profit (P / E) on November 2 was 19,0. It is also worth adding that the rolling dividend yield was 1,5%. The annual management cost is 0,7%, which is quite a lot for an ETF. Due to the fact that the ETF replicates the index physically, the distribution of sectors and the largest positions in the portfolio is very similar to that of MSCI. For this reason, below we present a list of the top 10 positions in the portfolio and a brief overview of selected 5 companies.
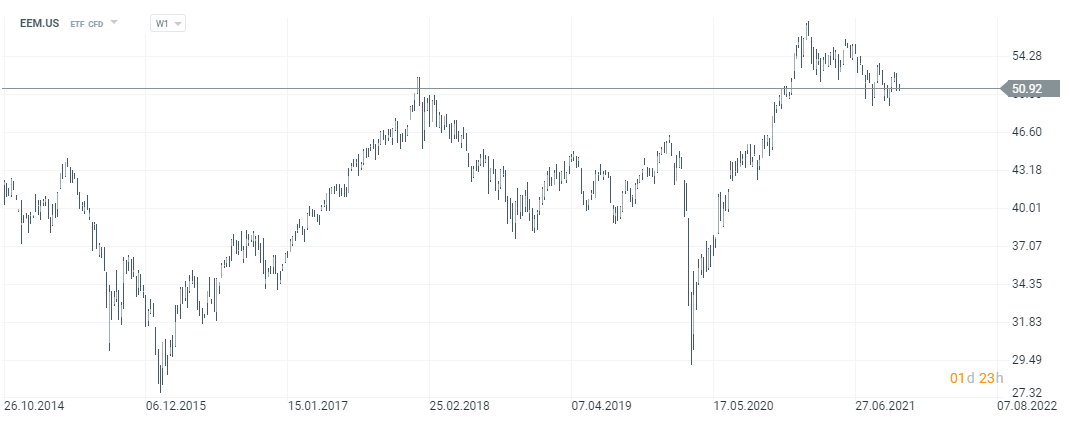
IShares Emerging Markets ETF CFD Chart, Interval W1. Source: xNUMX XTB.
Top ETF positions as of November 2:
| Company name | Participation in the index |
| Taiwan Semiconductor Manufacturing | 6,51% |
| Tencent Holdings | 4,26% |
| Alibaba Group | 3,91% |
| Samsung Electronics | 3,61% |
| meituan | 1,74% |
| Reliance Industries | 1,19% |
| Infosys | 0,96% |
| JD.com | 0,87% |
| Housing Development Finance | 0,83% |
| China Construction Bank | 0,81% |
Tencent
Tencent is one of the most important technology companies in China. The company has the largest social networking platform in this country - Weixin (WeChat), which has over 1,2 billion MAU (monthly active users). Tencent is also the largest game publisher in the Chinese market. Tencent also has the largest online library of books in China and is the largest music provider in China. In addition, Tencent also has a leading payment service (WeCht Pay) that allows you to pay for purchases by scanning a QR code. It is also the second largest cloud provider in China. Games, payments and advertising account for the largest share of revenues. It is worth mentioning that Tencent is active in the field of acquisitions. It has, among others, the developer and publisher of Riot Games. In 2020 alone, Tencent acquired or acquired minority stakes in 31 companies in the gaming industry.
| CNY million | 2017 | 2018 | 2019 | 2020 |
| revenues | 237 760 | 312 694 | 377 289 | 482 064 |
| operational profit | 70 447 | 78 011 | 96 572 | 128 071 |
| operating margin | 29,63% | 24,95% | 25,60% | 26,57% |
| net profit | 71 510 | 78 719 | 92 602 | 159 444 |
Alibaba
Alibaba is another Chinese technology giant. The basic activity is e-commerce platforms that enable the purchase of goods via the Internet. The largest are Taobao, T-mall and Aliexpress. The company generates most of its revenues in China, but is trying to expand geographically towards Southeast Asia and Europe (Lazada, Aliexpress). Alibaba is also pioneering the payment revolution in China. Has a minority package on AntFinancial. Ant was supposed to debut in 2020, but just before the debut, the Chinese regulator did not agree to it. Alibaba also holds shares in Ele.me, which deals with online food delivery (foodtech). Alibaba Pictures cannot be forgotten. It is also worth mentioning that Alibaba is the leader in the Chinese cloud market.
| CNY million | 2017 | 2018 | 2019 | 2020 |
| revenues | 250 266 | 376 844 | 509 711 | 717 289 |
| operational profit | 70 363 | 57 750 | 93 004 | 89 678 |
| operating margin | 28,12% | 15,32% | 18,25% | 12,50% |
| net profit | 63 985 | 87 600 | 149 263 | 150 308 |
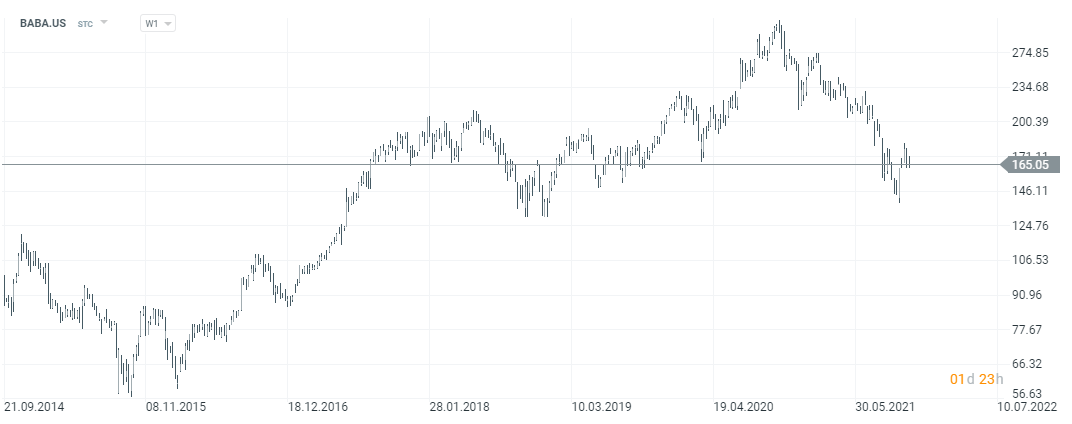
Alibaba stock chart, interval W1. Source: xNUMX XTB.
Samsung Electronics
Samsung is one of the most famous companies in the world. It is one of the famous Korean cheebols that have become one of the world's technology leaders. Samsung is known mainly for its smartphones and electronics and household appliances (TVs, refrigerators, washing machines, ovens, dishwashers, etc.). However, this company is much more than that. It is a producer of lithium-ion batteries, semiconductors, motion sensors, chips, external drives, etc. The largest revenue segment is the sale of mobile devices, which generates over 38% of revenues. The semiconductor segment is in second place, accounting for approximately 28% of the company's revenues. It is worth adding that Samsung has over 40% share in the DRAM market (dynamic memory, ie Dynamic Random-Access-Memory).
| billion KRW | 2017 | 2018 | 2019 | 2020 |
| revenues | 239 575 | 243 771 | 230 401 | 236 807 |
| operational profit | 53 645 | 58 887 | 27 769 | 35 994 |
| operating margin | 22,39% | 24,16% | 12,05% | 15,20% |
| net profit | 41 345 | 38 573 | 18 899 | 22 929 |
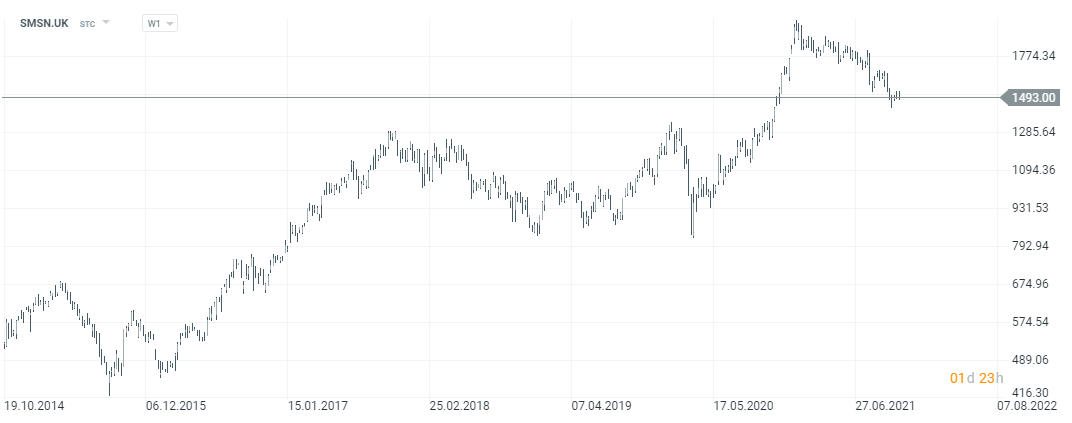
Samsung stock chart, interval W1. Source: xNUMX XTB.
meituan
The company was founded in 2003 and its current headquarters are in Beijing. Meituan is a company that operates in several markets related to ordering products and services over the Internet. The main activity is the segment of food delivery through the application. From the application level, you can order take-out food, groceries and book a courier to collect the package. The Food Delivery segment was responsible for slightly over 50% of the company's revenues in the first half of 2021. Meituan also provides hotel reservation services. The “New Initiatives” segment is developing the fastest and currently generates over 27% of the company's revenues. There are fees charged for the provision of a restaurant management system, Meituan Instashopping, microloans, car and bicycle rental.
| CNY million | 2017 | 2018 | 2019 | 2020 |
| revenues | 33 928 | 65 227 | 97 529 | 114 795 |
| operational profit | -4 462 | -13 472 | 1 347 | -1 931 |
| operating margin | -13,15% | -20,65% | 1,38% | -1,68% |
| net profit | -18 917 | -115 477 | 2 239 | 4 709 |
Infosys
It is one of the largest Indian IT companies. The origins of Infosys were modest. The company was founded in 1981 with a registered capital of $ 250. Infosyst began to develop rapidly and in 1993 it debuted on the Indian stock exchange. In 1999, the company became the first company in India. It was listed via ADRs. The company's revenues then amounted to $ 100 million. In 2017, they already exceeded $ 10 billion. The company offers consulting, development and outsourcing services. Infosys also has its own software that it sells to its customers. Examples include Fiancle, which is offered to banks, and Wingspan (educational platform).
| million USD | 2017 | 2018 | 2019 | 2020 |
| revenues | 10 939 | 11 799 | 12 780 | 13 561 |
| operational profit | 2 670 | 2 731 | 2 748 | 3 350 |
| operating margin | 24,41% | 23,15% | 21,50% | 24,70% |
| net profit | 2 486 | 2 199 | 2 331 | 2 613 |
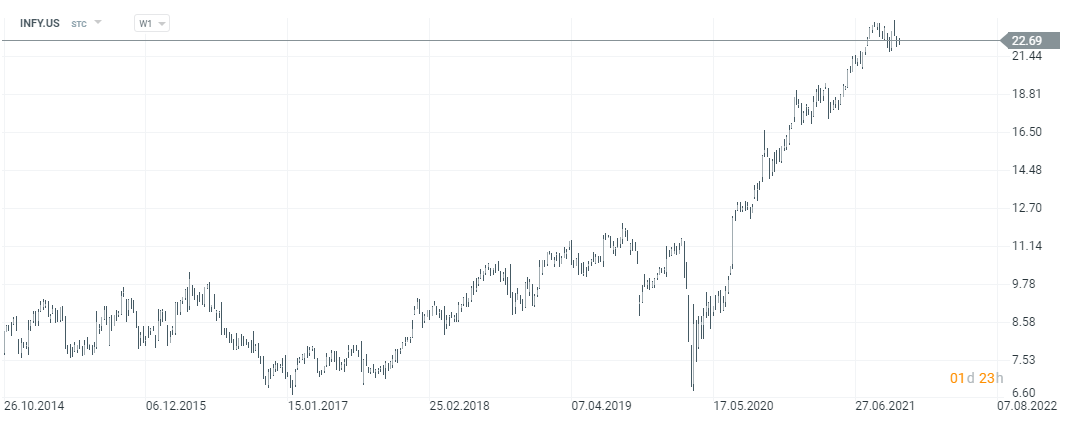
InfoSys stock chart, interval W1. Source: xNUMX XTB.
Check it out: Invest, don't speculate. Passive Investing with FINAX
Additional information about EEM
This ETF is listed in the United States. This means that the investor must have access to a foreign market and be able to invest in foreign ETFs (some Polish brokers cannot offer direct investment in US ETFs to retail investors). The way out is to invest in iShares MSCI EM UCITS ETF, which is listed on several European stock exchanges (including London, Amsterdam, Frankfurt and Milan). Below is a chart of the ETF listed on the Frankfurt Stock Exchange.
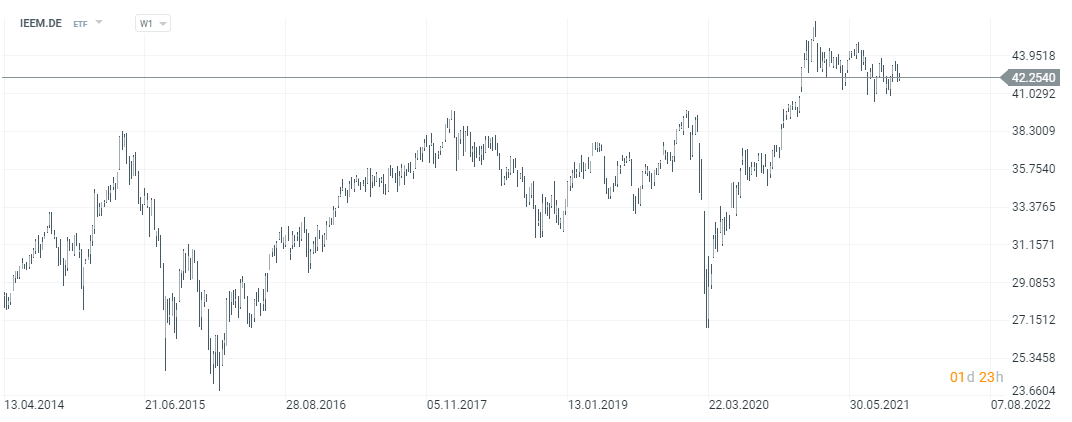
IShares Emerging Markets ETF Chart, W1. Source: xNUMX XTB.
The iShares Emerging Markets ETF (EEM) has generated an annual average rate of return (total return) of approximately 10,4%. However, over the past 10 years, the average annual rate of return has been only 5,5%. This result is worse than the benchmark, which grew by 6,1% annually on average over the last decade. The result is disappointing compared to the rates of return achieved in the market for growth, technology or US companies. However, it should be remembered that past performance is not a guarantee of obtaining similar results in the future. By investing in the ETF, the investor will gain exposure to markets that should develop dynamically in the next 10 years.
Emerging Markets - Where to Invest [Stocks & ETFs]
An increasing number of forex brokers have quite a rich offer of stocks, ETFs and CFDs for these instruments.
For example on XTB Today, we can find over 3500 equity instruments and 400 ETFs, a Saxo Bank over 19 companies and 000 ETF funds.
| Broker |  |
||
| End | Poland | Denmark | Cyprus * |
| Number of exchanges on offer | 16 exchanges | 37 exchanges | 24 exchanges |
| Number of shares in the offer | approx. 3500 - shares circa 2000 - CFDs on shares |
19 - shares 8 - CFDs on shares |
approx. 3 - CFD on shares |
| The amount of ETF on offer | approx. 400 - ETF approx. 170 - CFD on ETF |
3000 - ETF 675 - CFD on ETF |
approx. 100 - CFD on ETF |
| Commission | 0% commission up to EUR 100 turnover / month | according to the price list | Spread depends on the instrument |
| Min. Deposit | PLN 0 (recommended min. PLN 2000 or USD 500, EUR) |
0 PLN / 0 EUR / 0 USD | PLN 500 |
| Platform | xStation | SaxoTrader Pro Saxo Trader Go |
Plus500 platform |
* PLUS500 CY offer
CFDs are complex instruments and come with a high risk of losing money rapidly due to leverage. From 72% to 89% of retail investor accounts record monetary losses as a result of trading CFDs. Think about whether you understand how CFDs work and whether you can afford the high risk of losing your money.


Leave a Response