


 – this cryptocurrency increased in price 2024 times in 20")
 are recording the largest daily outflow of funds in history")

Limiting asset purchases and OPEC decisions negatively affect metals

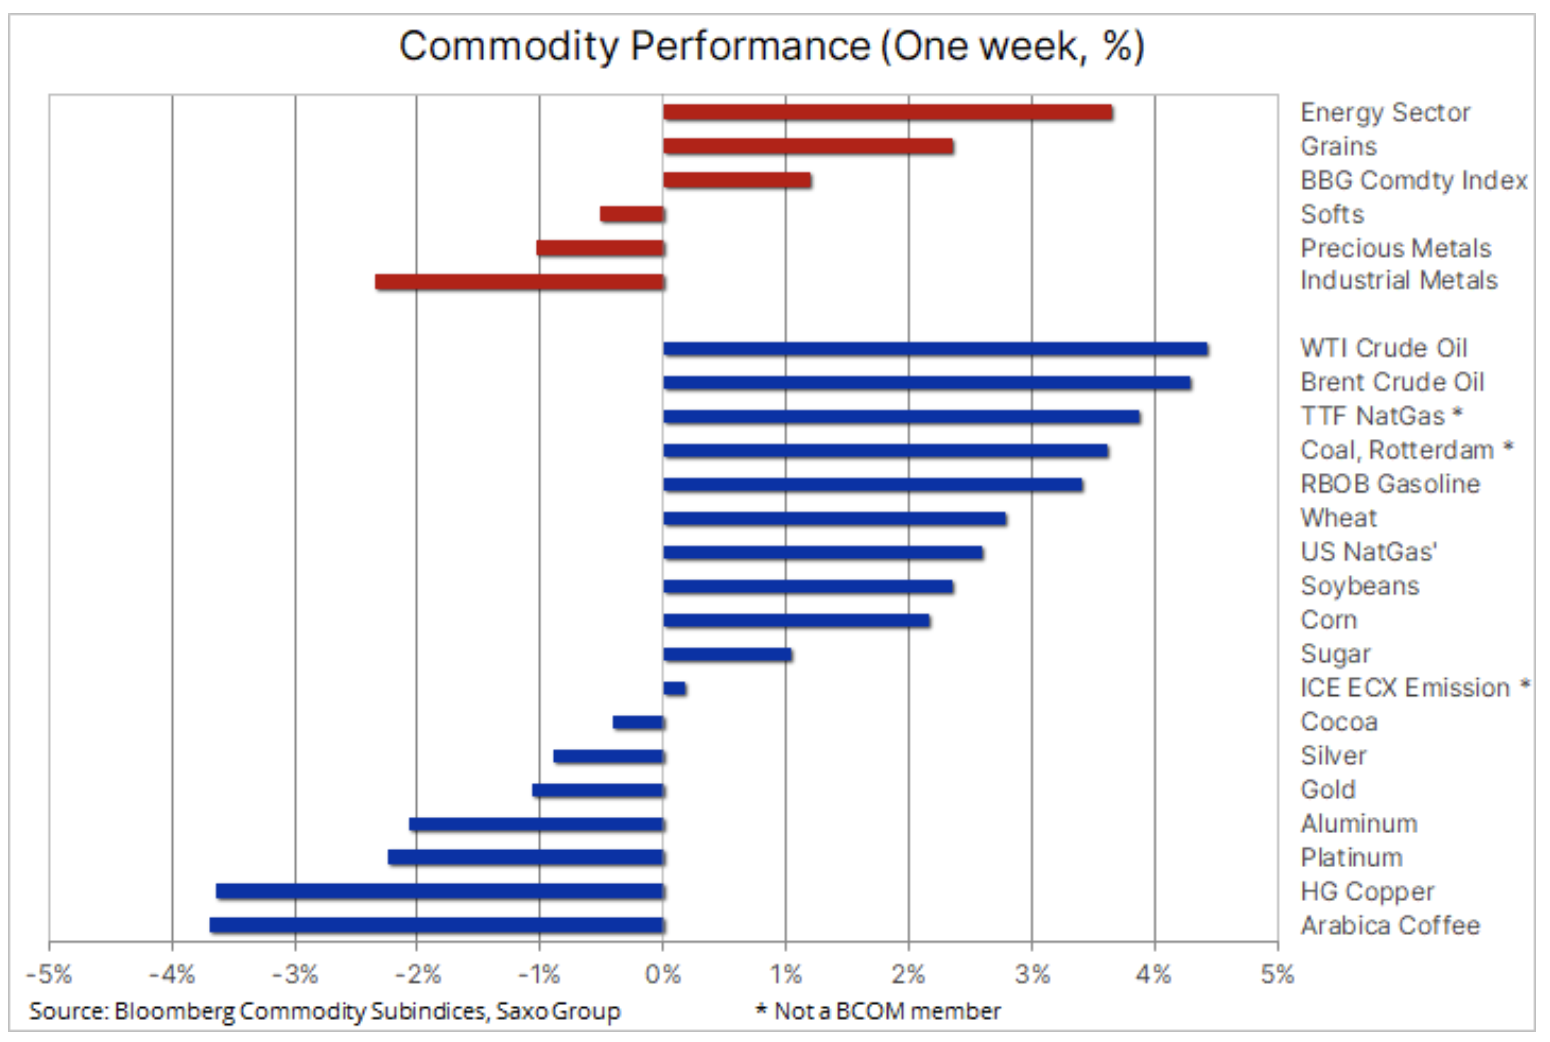
In the first week of June, the commodity market was mixed: for both precious metals and industrial buyers, there was a temporary fatigue, while grains and energy in particular gained. Overall, the Bloomberg Commodity Index posted another XNUMX-year high despite concerns that better-than-expected macroeconomic data on the over-stimulus US economy could drive Federal Reserve to address the issue of limiting support.
About the Author
 Ole Hansen, head of department of commodity market strategy, Saxo Bank. Djoined a group Saxo Bank in 2008. Focuses on providing strategies and analyzes of global commodity markets identified by foundations, market sentiment and technical development. Hansen is the author of the weekly update of the situation on the goods market and also provides customers with opinions on trading goods under the #SaxoStrats brand. He regularly cooperates with both television and printed media, including CNBC, Bloomberg, Reuters, Wall Street Journal, Financial Times and Telegraph.
Growing concerns about inflation, increased demand for metals linked to the green transition, OPEC + supply constraint, and weather conditions may continue to fuel the widespread boom in the coming months. However, in perspective strict In the short term, a number of commodities saw a decline in momentum, while others were heavily bought up, increasing the risk of a sudden correction involving most metals and coffee.
Petroleum
Clothing it surged ahead of the last OPEC + meeting, where the group - as expected - decided to maintain the planned increase in production for July; however, given the prospects for a further recovery in demand and the uncertainty surrounding the Iran nuclear deal, the group refrained from making any suggestions for the next steps. Although the recovery in global fuel demand is still far from synchronized due to concerns about the tightening of Covid-19 restrictions in Asia, in the short term the market is satisfied with focusing primarily on the positive outlook for demand in the United States and parts of Europe.
These factors, however, contributed to tightening market conditions, and OPEC forecasts that in the second half of the year the supply on the world market will be insufficient, while naturally excluding any additional barrels from both OPEC + countries, Iran and American shale oil producers. The recent rise in prices, culminating in Brent crude oil approaching key resistance around $ 72 and reaching 2018 highs for WTI crude, was fueled by WTI crude oil amid a seasonal decline in US gasoline inventories ahead of the projected intense holiday season and with stock levels in Cushing, WTI's oil supply hub, lagging behind the five-year average. This was further compounded by the lack of clear signs of production growth in the shale oil sector, which has collapsed after the original boom and has now shown more discipline in its approach to rising oil prices.
A breakout of Brent crude above $ 72 could mean that the next target will be a trendline resistance from the 2008 high, currently trading around $ 78, as seen in the monthly chart below.

Gold
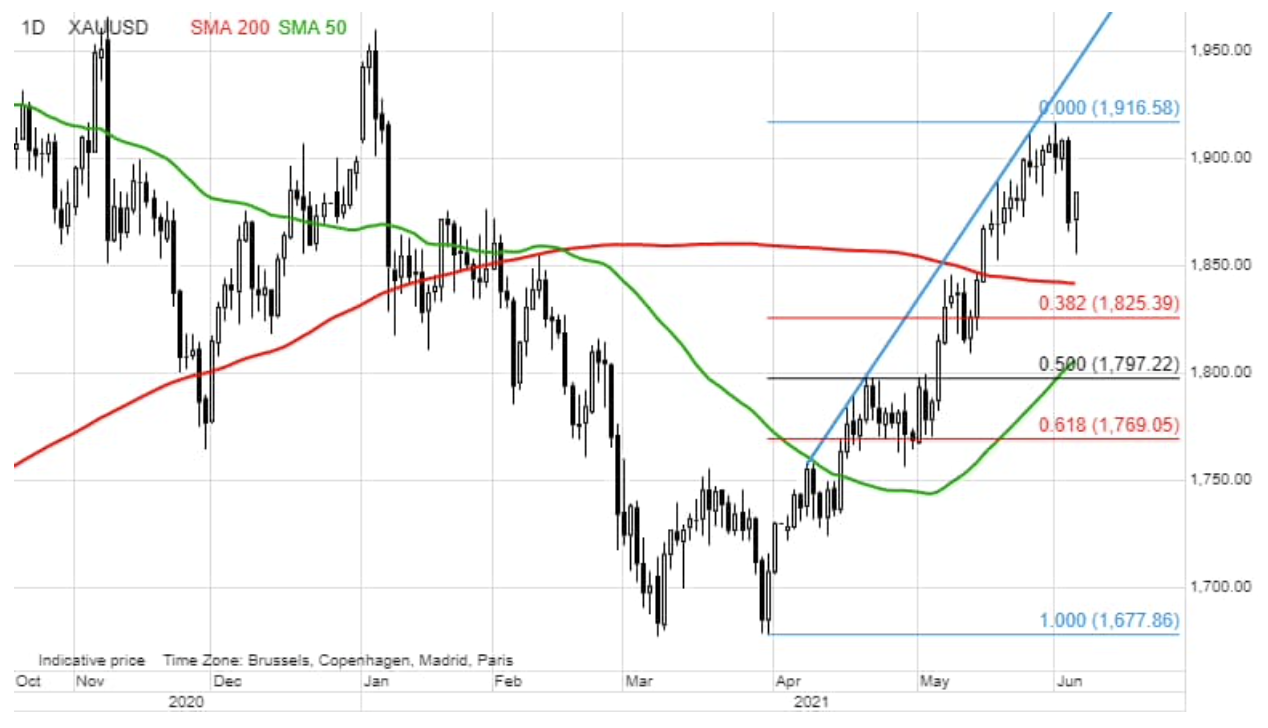
Gold recorded the largest weekly decline since March after a wave of profit-taking finally followed a spell of gains since early April. During this period, and in particular last month since breaking above key technical levels, buy orders from long-term funds kept the pace of the bull market stable. However, after the conditions of overbought over the past two weeks, the risk of a correction went up, and after the execution of the remaining buy orders by the so-called traders FOMO (fear of missing out - fear of missing an opportunity), only one strong reading from the United States was enough to plummet.
Under pressure from a stronger dollar and rising yields after the recent wave of solid US economic data, the market is once again focusing on the risk that the Federal Reserve may start tightening market conditions earlier than anticipated. Gold managed to regain some of its earlier losses following the publication of a worse-than-expected US non-farm payrolls report.
Technically, the loss of momentum below the 1-day moving average highlights the risk of an additional short-term weakening towards the 841-day moving average, currently at $ 1. Should gold rebound before it hit this level, let alone $ 825, a 38,2% retracement from the last rally line, this issue will be seen as a slight correction within a strong uptrend.
Copper
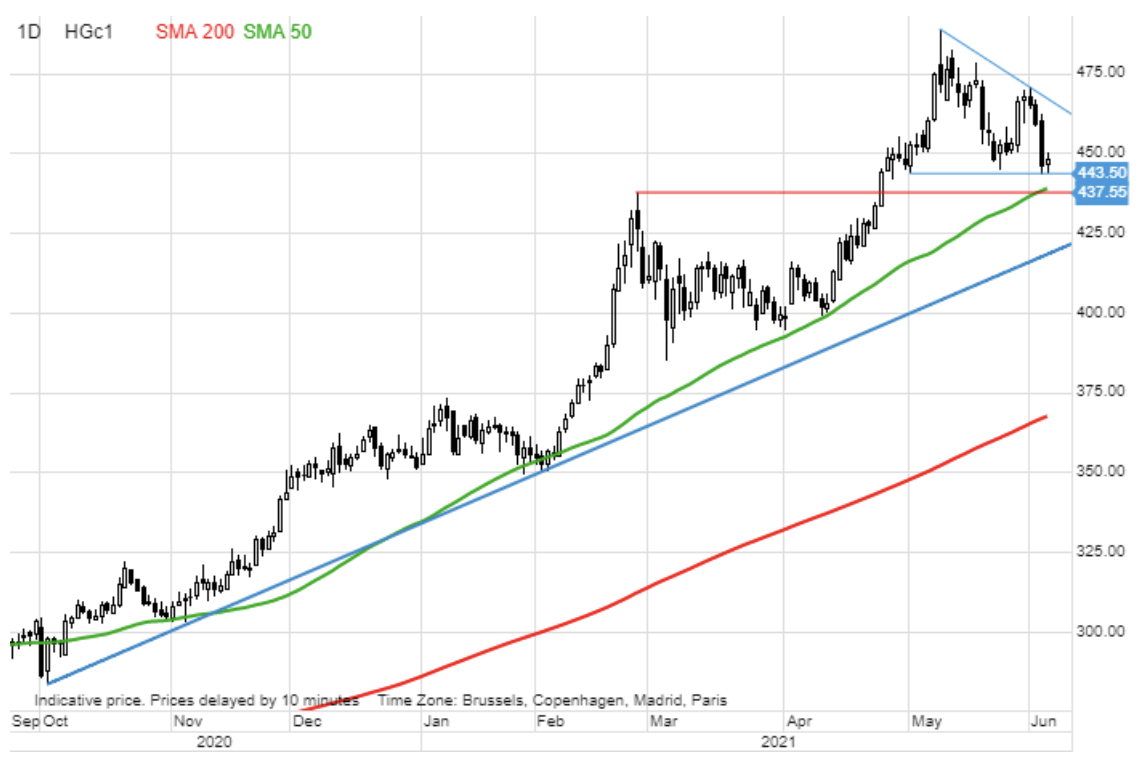
Copper ended the week almost at the bottom of the table, perhaps for the first time since the commodity boom started roughly nine months ago. The recent loss of momentum has increased the risk of a deeper correction by financial investors more focused on short-term technical price movements than on the long-term, which continues to show growth with the stipulation that inelastic supply may struggle to meet anticipated higher demand, including as the electrification process accelerates.
In addition, there has been some weakening in Chinese demand: Yangshan's key premium vs. London has fallen to its lowest level in four years, while the spread between the spot copper price and the three-month contract price on the London Metal Exchange for three weeks shows contagion (oversupply). In addition, stocks in warehouses monitored by exchanges stabilized around the ten-year high, while speculative investors have reduced their net long position by 63% since December.
However, despite the decline in short-term risk appetite, the optimism has not fully faded and we expect buyers to reappear earlier than expected to prevent the price from returning to the trendline in early October, currently at $ 4,18. Until then, the additional support will remain in the five percent range between $ 4,38 and $ 4,43, as seen in the Chart below.
Agriculture
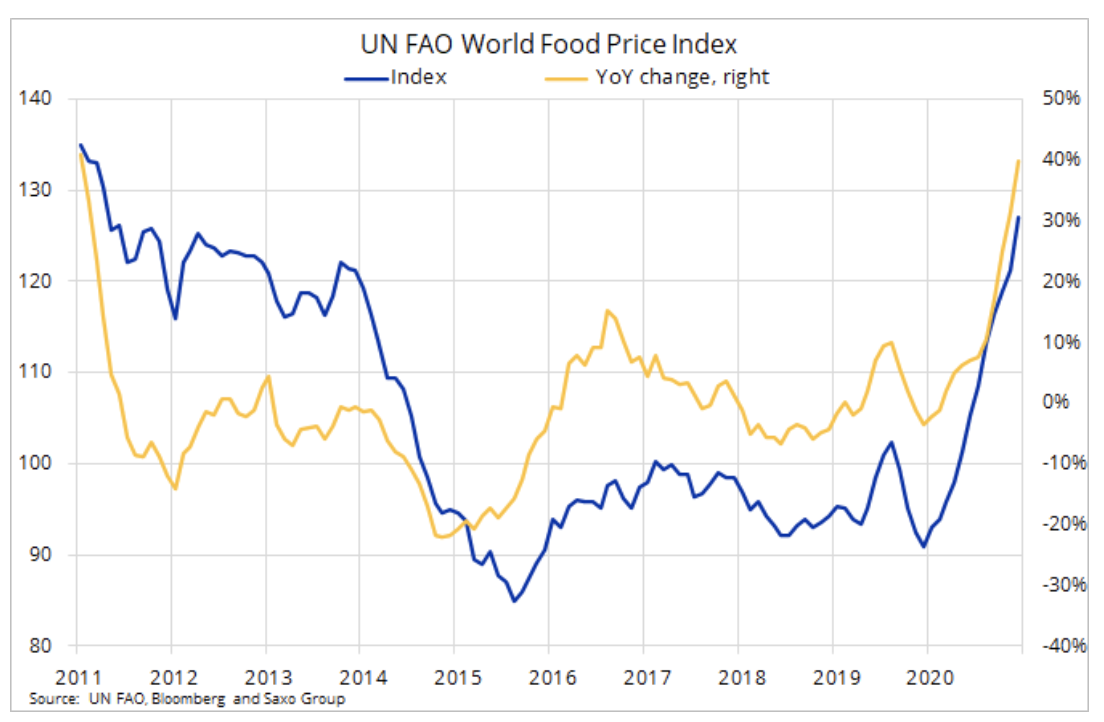
Global food costs rose sharply in May, reaching their highest level in a decade, according to the FAO World Food Price Index, which rose 4,8%, growing almost 40% year-on-year. This index, which covers 95 prices of agricultural products, showed an upward trend in all five product groups, mainly with regard to sugar, oil and meat. The drought in South America, record buy orders from China, and rapidly increasing demand for biofuels made the agricultural market insufficiently prepared for any additional production shocks, which explains the current pressure on weather conditions in key cultivation areas in the Northern Hemisphere.
As was the case ten years ago, the poorest import-dependent countries will feel the consequences of these increases, most of them still struggling with the economic impact of the pandemic. One positive aspect, however, is the fact that, despite the sharp rise in agricultural prices, the prices of wheat, and in particular rice - the world's two most important food products - remained relatively moderate. The high-protein milled wheat listed on the Paris Stock Exchange is 26% above the five-year average, while Thai white rice - a staple in Asian cuisine - climbed just 12%. The price of rice was positively influenced by the fact that its production is intended primarily for human consumption, while other agricultural products are also influenced by the demand for feed and biofuels.