


Tools for trend determination

The trend is a fundamental element of most trading systems, especially trend-followers, where we always follow it. Here, however, there is a problem - how to set a trend? There are many techniques and tools to do this, but which one is the right one? Or maybe there is no one best, but what to do in a situation when both indicate different?
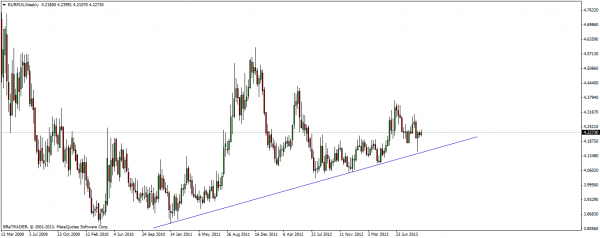
Trend lines
This is the most classic tool used to determine the trend. A straight line running into infinity, which combines common dips (upward trend), peaks (downward trend) or peaks and holes (sideways trend), determines the direction of traffic and at the same time support / resistance on which the course may stop in case of any corrections. Most often, a trend line is set at the minimum and maximum prices. Rarely do analysts use the closing price for this purpose, although ultimately it confirms whether the trend has been maintained or broken.
Price Action method
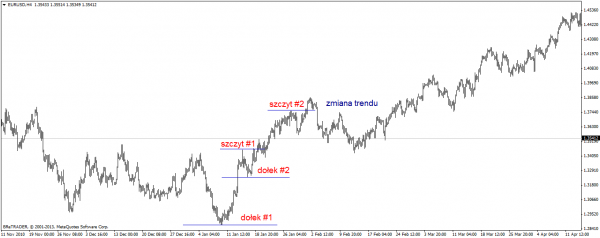
Price Action is a game technique based on a clean chart and price analysis using basic tools. Sometimes a trend line is also used to set a trend, but more often it is based on the observation of successively created highs and lows. It can be said that this is a "by eye" method. This technique is very simple and, contrary to appearances, not very subjective, and its main assumptions are as follows:
- When higher and higher peaks and increasingly high holes are formed on the graph, we have rising trend.
- If the lower and lower peaks form ever lower in the chart, then we observe downward trend.
- If on the graph there are ever lower peaks and ever higher holes or ever higher peaks and ever lower holes then we have side trend.
READ ALSO: Price Action and Price Action strategy according to Nial Fuller
In practice, you have to determine yourself how many improved peaks / wells we recognize that the trend has changed. Too long waiting for confirmation will make the market run away, while too short will expose us to the risk of too quickly diagnosing the change. In my opinion, the second one clear correcting the previous peak / hole is enough to diagnose a change in the trend, as in the example below.
Medium walking
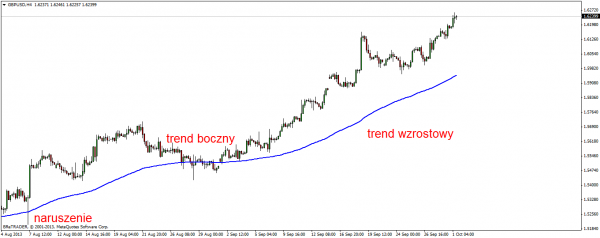
One of the least subjective methods to determine the trend. Moving average is a ratio that counts the average price value from X periods according to a given formula depending on the type of the average (more on Moving Average), which is superimposed on the price chart. The smaller the period, the more accurate the average. The bigger it is, the more reliably it reflects the directional tendency in the long term (in relation to the TF used). The principle is trivial:
- If the price is above the moving average then we have rising trend.
- When the price is below the moving average, we observe downward trend.
- In turn, when the moving average moves close to the price, cutting it alternately on both sides we have side trend.
When diagnosing a trend, closing prices are used, and the crossing of High and Low prices by MA is treated only as a 'breach' of the trend. Its change is only when the Close price appears on the other side of the MA.
Other indicators
Other tools such as price channels (parallel, linear regression, standard deviation) or trend indicators for technical analysis, such as Parabolic SAR, CCI or Average Directional Movement Index, can be used to determine the trend. Each of them shows the same but in a different way and is based on a different mathematical formula, with the exception of channels, which are set just like the trend line.
READ ALSO: Indicators of technical analysis and check it out Base of trend indicators
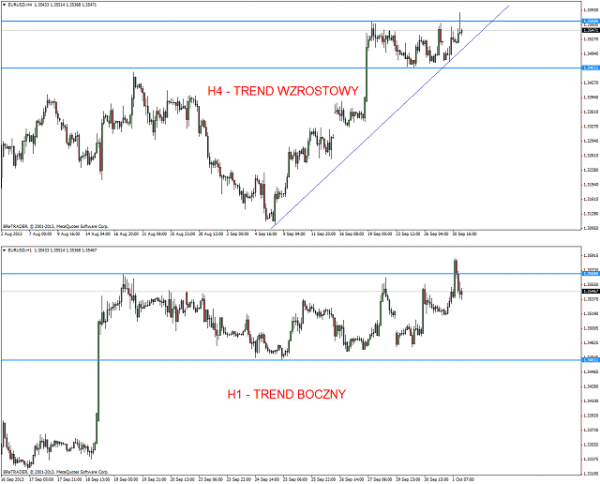
The trend depends on the interval
If you play at several time intervals or operate on a low TF (timeframe - time frame), and you are looking for confirmation at a higher one, you have certainly encountered a situation where the trend direction was different on each of them. The tendency of price changes depends on the time horizon on which we conduct the analysis, therefore when defining it, it is always worth specifying what perspective we are talking about (intraday, short, medium, long).
Which tool to choose?
This question can not be answered unequivocally. Each of the techniques has its smaller and bigger advantages and disadvantages. Not all of the techniques will be suitable for any strategy. First of all, in the automatic system, it will be difficult to implement the trend identification condition based on the trend line or Price Action, while there will be no problem with using the rolling average for this purpose. On the other hand, moving averages must have carefully selected periods and if we use too little, we will all hit the consolidation trap, but too much signal will be delayed. The same will apply to other indicators of technical analysis. However, there is no question of subjectivity, so the analysis itself takes a moment.
The classic methods based on charts require some practice and trained eye to be able to quickly and correctly diagnose the directional tendency. However, this is not so difficult and it is enough to regularly observe the graphs to get to practice quickly.
Other Articles
- Market Mechanics - Analysis of trends based on demand and supply zones
- Ross hooks. A way to follow the trend
- Determining the direction of the trend - Victor Sperandeo method
- How to distinguish a trend market from consolidation [Tips]
- Key concepts in the context of changing trends. Exhaustion and reversal
- Trend lines - 3 techniques to make trading easier
- Multi Trend Signal - as many as 9 indicators in one [MT4]


