


Holiday news on the JForex Dukascopy platform

JForex platform Dukascopy in the latest version with the designation "3", it is regularly expanded and equipped with new "goodies" as well as functions useful for most traders. Despite introducing a number of revolutionary changes at the very beginning (the first year since the debut in December), the list of functions continues to be extended. In this article, we will present you the most important modifications and novelties that have appeared in the last two months.
Be sure to read: Review of the JForex 3 Dukascopy transaction platform
Changes in the JForex Dukascopy order window
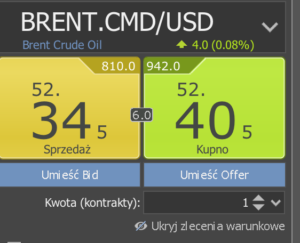
New color options have been introduced in the left module for placing orders. So far, users have been doomed to red and green in the "faded" version, known from the previous version of JForex. Now we have 8 settings at our disposal, 3 of which concern dynamic setups (the window changes color depending on the price change up or down).
In this window, it was also possible to quickly change the type of displayed volume of items (millions, flights, thousands, units). Previously, to make such a modification you had to enter the platform settings.
Changing the color and volume units is available by right-clicking on the relevant part of the window.
Another improvement is displaying in the upper part of the window (just above the "BUY" button) the daily change of the instrument in pips and as a percentage.
The icing on the cake of changes is the ability to increase / decrease the volume with the scroll of the mouse. It is enough to hover the cursor over the volume and start "scrolling" - the value changes every 1000 units. To return to the default volume, just right-click on one of the arrows (no matter which one).
JForex Dukascopy
A tool for drawing candles
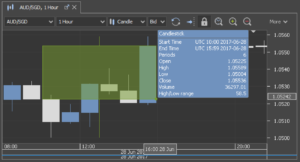
A brilliant tool! This is how they can be briefly described. There is a new "toy" for drawing on charts. In the "Drawing" section, in the last position we have "Candlestick", which allows us to mark any period on the chart based on which it creates one candle (eg one candle from 15 H1 candles). The selected range can of course be modified or moved on an ongoing basis.
Depending on whether the candle gives a "down" or "up" effect, its color automatically changes to red or green.
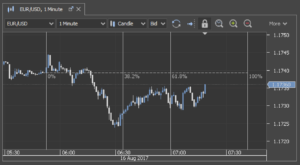
Fibonacci levels on the graph
In the configuration options of Fibonacci orders, the possibility of choosing which parameters are to be displayed on the chart has been added:
- labels,
- percentage levels,
- price levels.
A convenient option for people who use the laying grid.
Indicators - cloning, GMMA, Fibo time zones
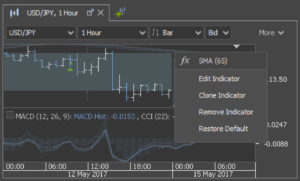
An option has been added cloning indicators already imposed on the chart. Thanks to this, we can quickly duplicate all indicator settings, including parameters, window sizes and colors.
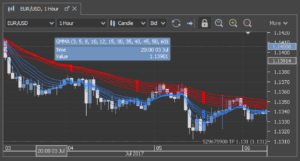
The list of available indicators includes a popular tool - GMMA - i.e. a set of moving averages on one chart with different time intervals.
The Fibonacci Time Zones index has also been added, a tool for determining time zones based on Fibo numbers.
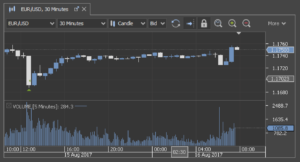
Indicators with lower TF visible at higher
That's right, exactly as in the topic :-). On JForex we can already display tool indications from lower time frames on higher ones, for example, the volume indicator for the M5 interval may be visible on the M30 interval (it is only "squeezed" appropriately).
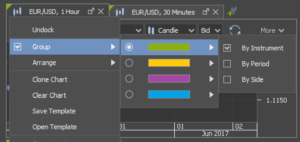
Grouping of charts
By right-clicking on the graph header in the list of options, it was possible to group them. Grouping can take place according to three categories: instrument, time interval or page.
Next updates
The latest version of JForex has the 3.2.15 designation. This is certainly not the end of work on improving the ECN platform of the Swiss broker. We will inform you regularly about new products!


