


Round price levels - Use them in your analysis [JIM PONIAT]

Every day I get a lot of questions about investment strategies and techniques to identify changes in the market. In this series of articles I would like to present the most important topic with which we meet unconsciously - a wonderful "helper" on the market, which is momentum.
Trading using Price Action methodology is, contrary to appearances, extremely difficult. After all, we never know how the price will behave in the future, and in practice it quickly turns out that the analysis of the candles themselves is insufficient. Support and resistance levels come to the rescue. This is one of the techniques that every trader gets to know at the beginning of his trading adventure.
Human emotions and investor behavior
Fear, greed and instinct, topics that often arise when discussing financial markets. This is because human emotions are largely responsible for price changes on the stock market. The price chart can therefore be treated as a graphical representation of emotions such as fear, greed, optimism and pessimism, as well as human behavior, such as the instinct of a whole group of traders. Price charts show how market participants react to price changes and what they expect.
There is a huge range of supports / resistances that we can look out for in our analysis: key highest / lowest prices, trend lines, moving averages, elevation levels, tilting points and more. Became an integral element of every market, which the price respects and most importantly, you do not need any additional tools or perform complex analysis to determine them.
We grow up in the decimal system - currency, speed, weight, distance are expressed in this system. We also tend to round the exact value: when the price of a product is 1238.87 we say it costs 1200. If the market price is 1.32876 then we say the price is 1.33. This is dictated by our psychology, we love simplicity, and maybe we even have it encoded in our DNA.
If we look indifferently at any market chart, we will notice that it is at round levels that the price always has problems: either it bounces and reverses its course, or passes to test a given level as the opposite pole in a moment. When the price is approaching on EUR / USD to levels 1.1300, 1.1400, 1.2000, each trader pays special attention to whether the price will not stop and slow down the changes or simply reverse its direction.
The price is the basic and very important information available to every investor. In trading, most traders have no idea where the price is going. For most people, predicting price changes is an impossible task. Setting support / resistance at the last peak or hole is a simple guessing and often fails. In this case, we are guided by our perception of the market - it seems to us that this level will definitely work. We introduce an additional unknown to our trading algorithm. The determination of horizontal levels of support / resistance should be repeatable and independent of our perception or our thoughts.
Bill Williams always said:
"Want what the market wants."
The market will show us where and how the price will react to specific levels, and we traders will respond accordingly.
"Roaring" fifties
There is some anecdote about Fibonacci levels.
What is the most important level of laying down according to Fibonacci? - Fifty percent.
It's just that fifty percent is not Fibonacci.
What is the common theme of outstanding traders: Munehis Homma, Seiki Shimizu, Burton Pugh, Edward Dobson, Charles B. Goodman, WD Gann, Richard Wyckoff, Andrews?
The 50% rule tells us that the price will find support or resistance at the level of lifting 50% of the previous swing. The logic is very simple. At the 50% level, there is a balance of power, all buyers and sellers agree. Half of buyers and sellers made a profit, half of buyers and half of sellers have losses.
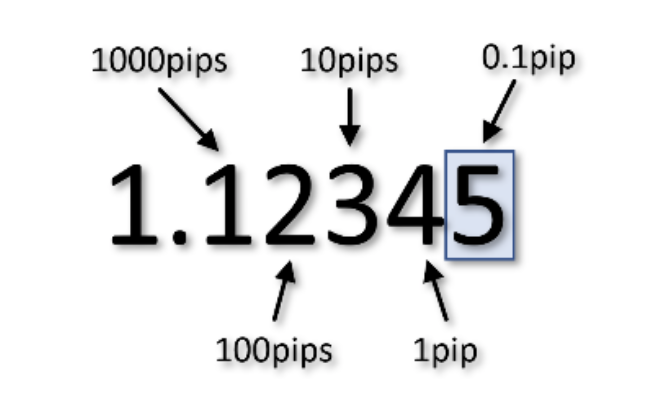
We'll take a closer look at the price of currency pairs. The place after the decimal point indicates the size of the next price step.
Let's look at the chart how the price will behave between these levels.
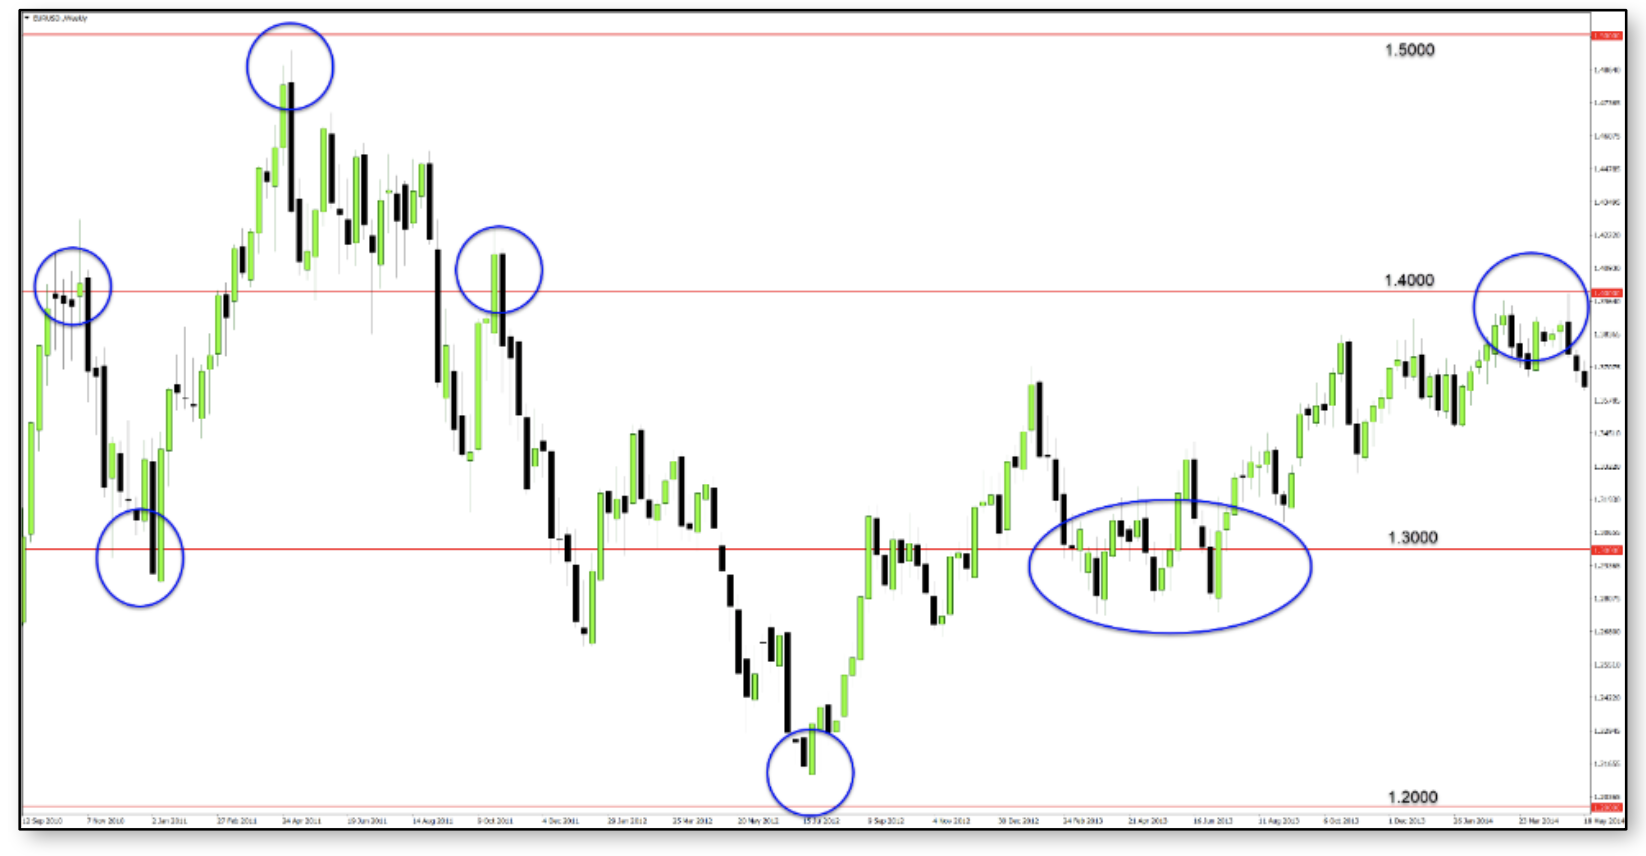
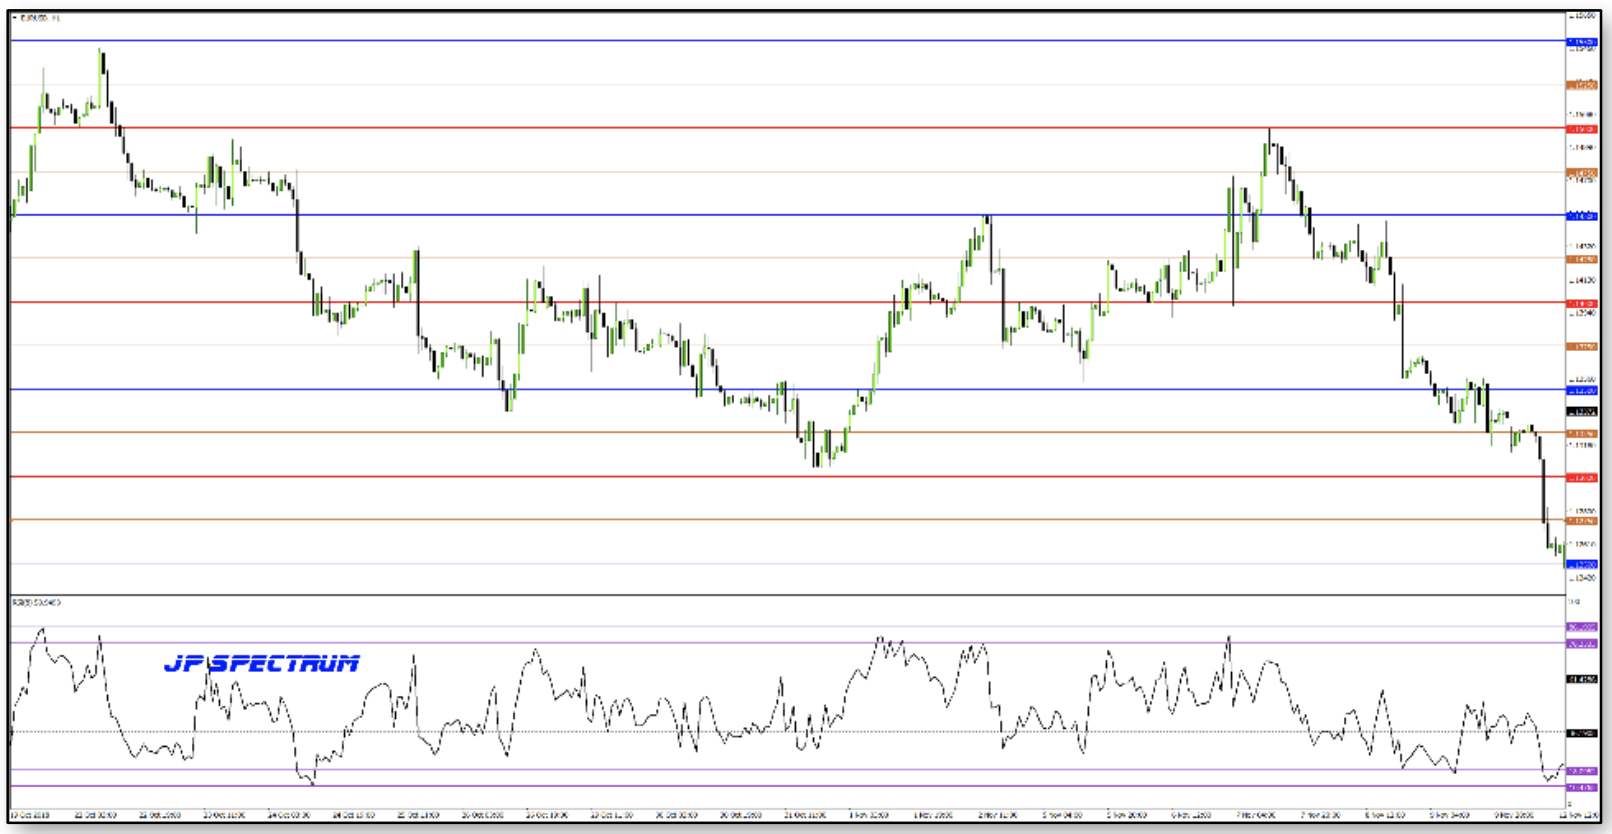
Set 1000 levels.
The distances between the red levels are 1000 pips. The distance is very long. Far too big for day trading. In blue ellipses, the price behaves in a very predictable way.
- The price reaches the level of 1.4000 and stops, moving into lateral movement, the level of 1.4000 resists strong resistance to further price increases.
- The fall in price is stopped at 1.3000. the price slightly breaks our level to break the price up on the next candle. Consider what the candle that is made of the last green and black candle will look like? There will be a nice hammer - a signal of rising prices.
- From ellipse 2, the price reaches 1.4000 for a moment stops (black candle) and the next green candle definitely closes above this level. On the next 2 candles, the price tests 1.4000 as a support and goes up. The price is approaching 1.4000. the green candle shows us the upper long shadow weakening of the momentum. another black candle (creates a bear hug) is a strong signal of a price drop. It reaches the level of 1.4000 and crosses our level with a firm move, then the price increases.
- The green candle just before closing indicates a long upper shadow - no further impetus. Another black candle forms a bear hug and the price falls below 1.3000 in strong movements, the price rises above 1.3000, creating a corrective swing
- The price falls to 1.2000. The last two candles form the embrace of the bull - a reversal formation and a signal to open a long position. Then the price slows down the changes and goes lateral.
- The course reaches the last ellipse, which indicates how the price slows down the growth and at the same time we see a slowdown in momentum, the last candles are characterized by long upper shadows.
Candles of impetus
When the price breaks through the designated levels, it does so using candles with long bodies that close above / below levels. If we set the levels using only the lowest / highest price (as the rest of the crowd does) we would definitely have problems with our analysis.
The above analysis was made only on the basis of price changes.
The next chart is now more realistic. Look carefully at how the price behaves within the designated levels. The levels were determined at 100 pips.
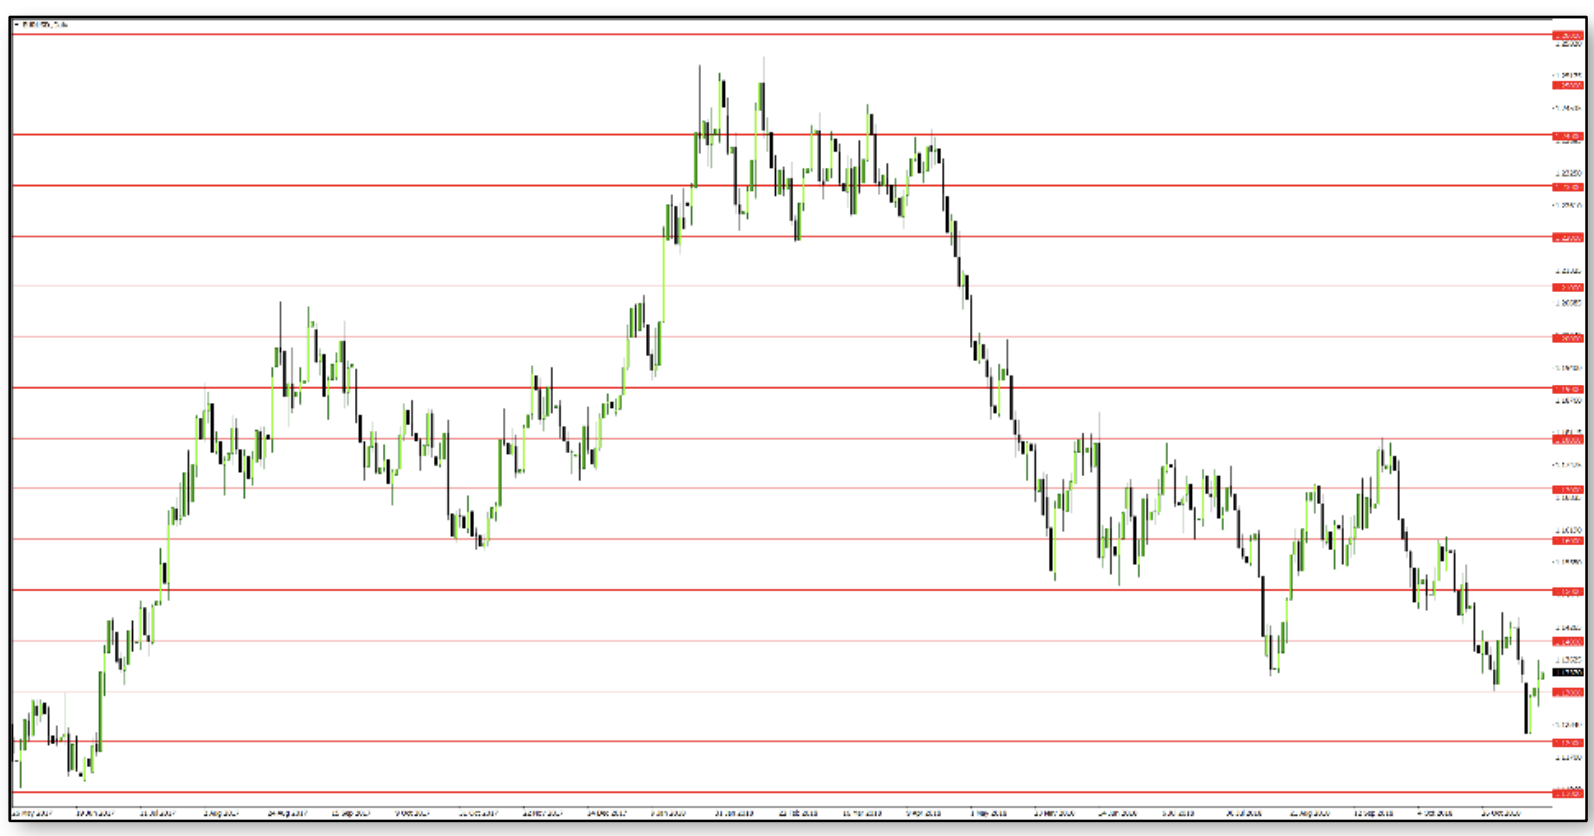
Levels set every 100 pips.
It is very clear where the price will slow down, stop or cross our support / resistance level.
Set levels every 100 and 50 pips.
The above graph has 100 pips and 50 pips determined.
The next chart has levels of 100, 50 and 25 pips. Each subsequent level can be divided into ½ subsequent levels, the price will also be respected. If you scalp and trade on the M1 chart, it is also worth applying the next levels by dividing 25 pips by ½ - this will be the level of 12.5.
As WD Gann described it during his courses - he divided the gradients into 8 parts, which in effect gives us exactly the same effect, dividing subsequent distances into half - 50%. Fifty percent occurs in many of my techniques. The more levels we determine on the chart, the more precisely we will see places where the price will show us the possibilities of trading.

And now a chart with the same levels along with the impetus analysis technique - JP SPECTRUM.
Round levels with JP Spectrum.
JP SPECTRUM is a powerful technique supporting impetus analysis, it has a lot of additional functions. You will learn more about it from subsequent articles.
Each trader tries to set a profit to loss ratio. By using our levels we have excellent insight into our price targets:
- We know the distances between them: 100, 50, 25 pips.
- We know how the price reacts, the price behavior before reacting to the level will explain to us how the price will react to this level - whether it cuts or stops and changes direction.
- JP Spectrum is helpful here because it indicates whether the price has reached reversal zones.
Very often these are levels where the price decelerates and goes laterally through several consecutive candles, showing candles with long shadows, without even reaching the levels. Because no price action trader takes into account the element without which price changes do not exist - impetus.
Marking support / resistance zones using the highest price in recent highs and the lowest price in recent lows is a baseless guesswork that is very often… wrong. We are looking for the beginning or the end of a rapid price movement. It always starts with the specific ones levels (not zones) because they are based on momentum or weakness. Strong momentum is characterized by a long candle - shine momentum.
This unique effect helps to define not only the points where we can open a position with almost no risk, but also the place where we can close positions with maximum profit. There are many ways to identify support and resistance, but many traders don't notice these places even though they are right in front of their eyes.
Let's look at a typical market situation and a couple GBP / USD with number levels.
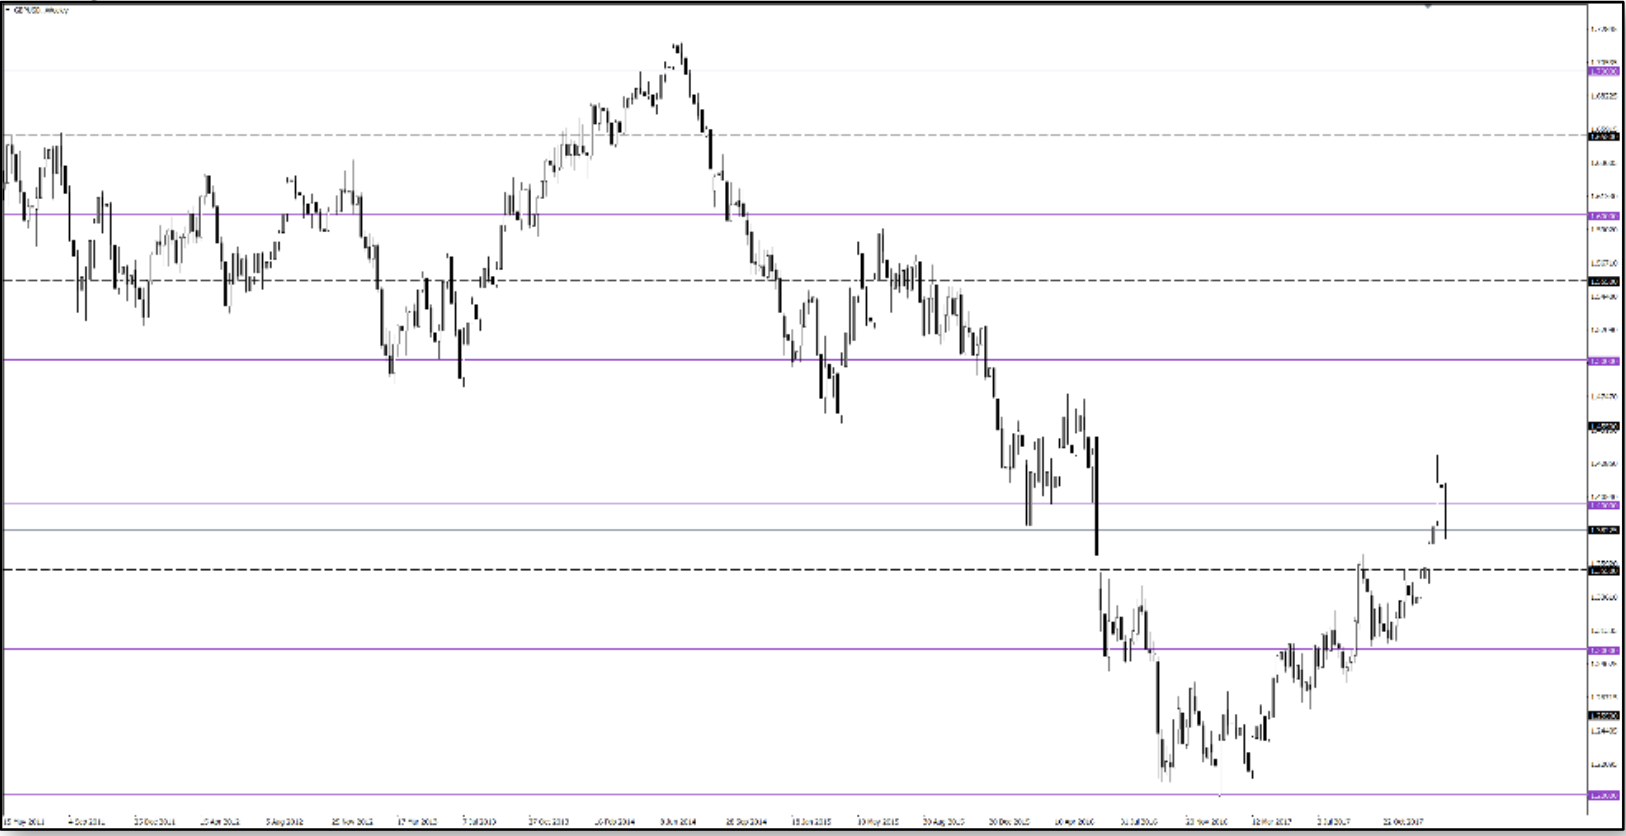
Weekly chart, GBP / USD currency pair with 1000 levels marked on it.
The distance between levels is 1000 pips. You can specify when the price will stop or turn away from the round number. Let's add 50% levels to the chart to see if it improves our analysis.

Weekly chart, GBP / USD currency pair with 1000 and 500 pips marked.
Thanks to this simple procedure, we can see much more details about prices and its retreats. Very often you will see a price exceeding the real support / resistance levels and then returns below / above this level. This is the effect of momentum and specific price movement. One group of traders must close all orders and other open orders in the opposite direction. If a candle appears at any of these levels, we can expect a reversal. Formation like a hammer, shooting star, bears or bull hug.
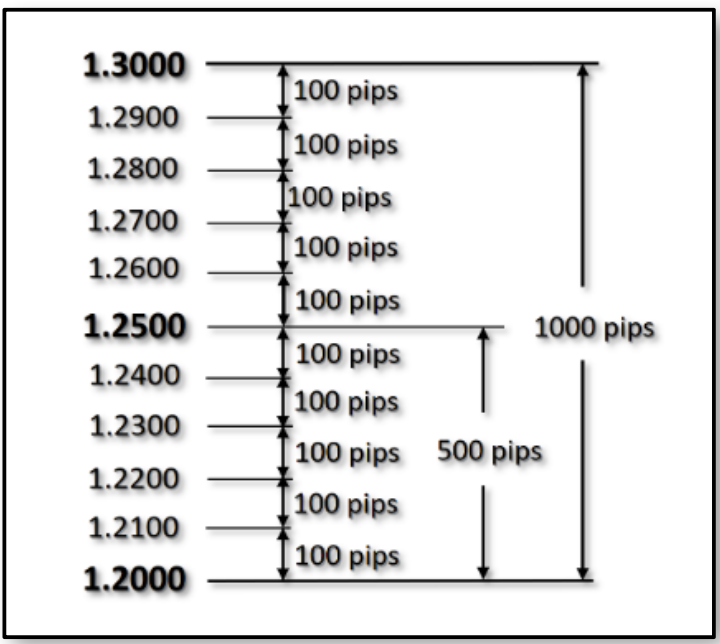
Price table and reference to round levels.
The importance of round numbers as support and resistance
There is a price trend to stop or fall using round numbers. Traders tend to think in terms of important rounded numbers, such as 10, 20, 25, 50, 75, 100, 1000. Therefore, these round numbers will often act as "psychological" levels of support or resistance. The trader can use this information to start making profits because an important level of round numbers is approaching.
One important commercial application of this rule is to avoid placing trading orders directly on these obvious round numbers. For example, if a trader tries to enter a short-term market decline in an uptrend, it would make sense to place orders with a limit just above an important round number. Because others are trying to buy the market after a round number, the market may never get there. Traders who want to sell after a bounce should place sell orders just below the round numbers. The reverse would be true when placing stop loss on existing positions. In general, avoid placing stop loss on obvious round numbers.
In other words, the protective stop on long positions should be placed below the round numbers and on short positions above such numbers. In market trends, respecting round numbers, and especially the more important numbers mentioned earlier, is one of those special market features that can be most helpful in trading and should be taken into account by a trader with advanced impetus analysis techniques.
It doesn't matter where the highest / lowest price is. Most traders observe price behavior according to Fibonacci levels, in particular level 61.8. What matters to us is how price reacts to the level of support / resistance.
Round price levels and market behavior
The intersection of these levels is done by shining momentum. The impetus candle has a long body. Very often, after breaking our support / resistance level, the price goes back to the level to rebound from it again. It confirms to us that the price will continue the path it has taken after breaking our level.
Let's look at a typical analysis based on round levels of support and resistance.
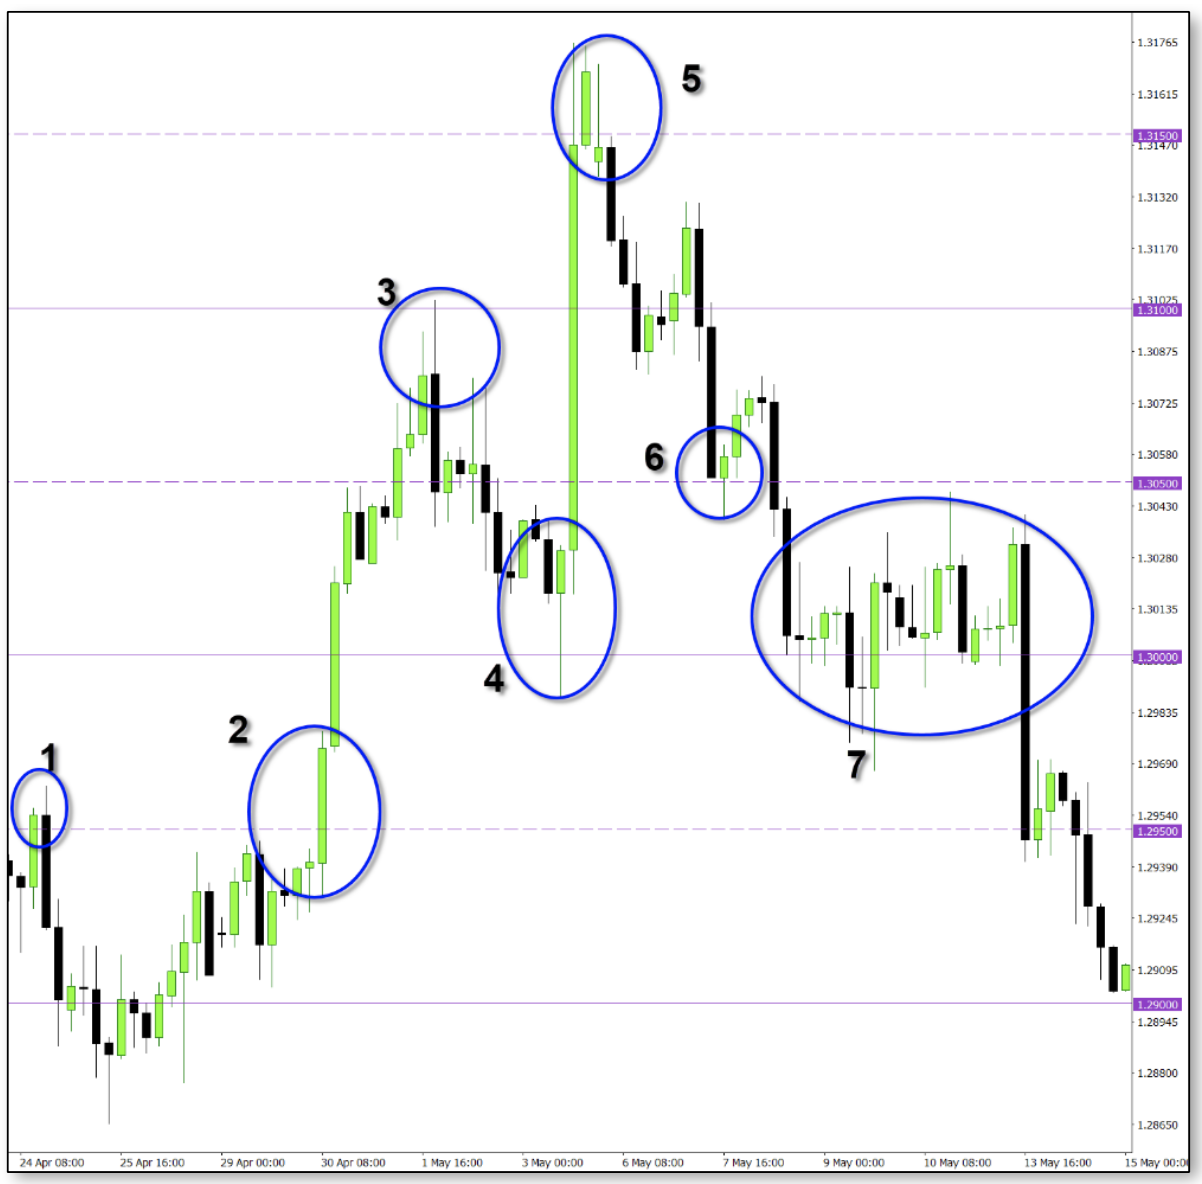
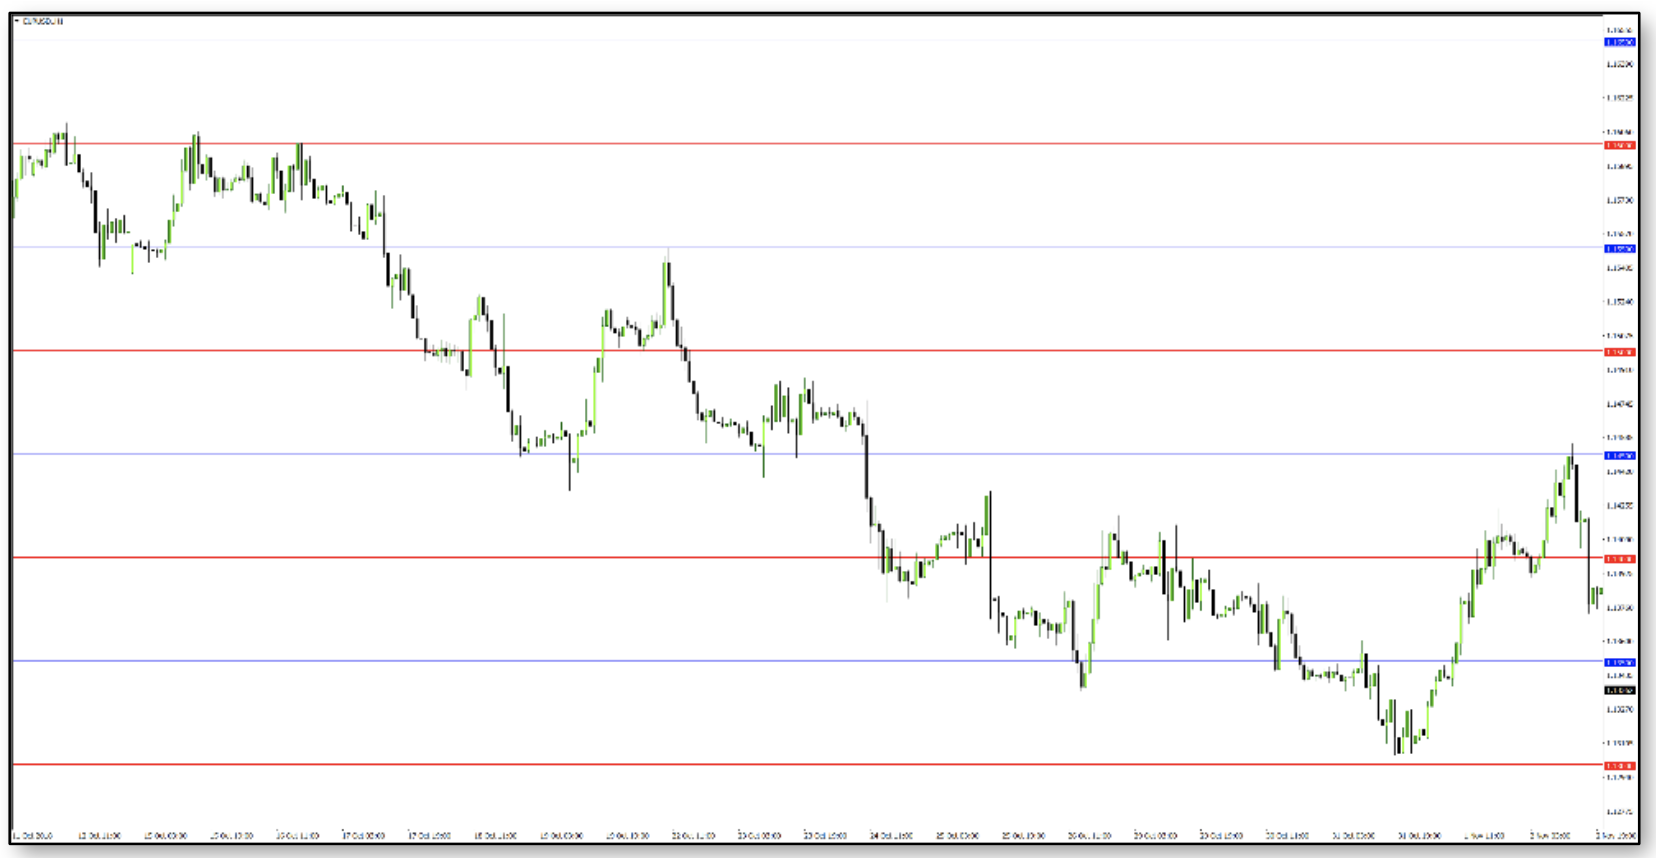
Chart H4, GBP / USD currency pair. Round price levels.
Let's look at a simple analysis of the graph above:
- The price reaches 1.2950 and begins to fall sharply.
- Here we are dealing with a "candle of momentum". just before its appearance, the market behaves very calmly, but the candle of momentum changes everything, its breaking is the beginning of a rapid profit up to 1.3100.
- The green candle shows market weakness, which is confirmed by the black candle. But the nada market is dominated by strong growth momentum and only falls to 1.3000.
- Actually it does not reach 1.3000 but a little higher 1.3025 (one more level 50%). There is a sharp rise to level 1.3175.
- Here you can see the price drop on the first black candle. This is the signal to close the position.
- The rapid drop in price down to 1.3050 gives us a moment of rest (price rise to 50% of the long black candle, and another sharp drop down to the level of 1.3000. This level is significant, the price remains longer at this level.
This is a typical price analysis for rounded levels. Now draw circular levels on your graph and try to do the correct analysis. More educational materials can be found on my website - www.pl.poniat.com.


We deal with a lot of psychology here. Many consider these levels to be crucial, so this is not the case.
Hello,
Exactly. these levels are not only an indicator of market psychology but also an IMPACT MARKER. Impet is the most important element of the entire trade puzzle.
if there is no momentum in the market there is no price change. it's so simple…
Regards,
Jim