


When using the platforms of several brokers, even if we are talking about demo accounts, it is impossible to get the impression that sometimes the presented charts differ from each other. By checking the quotes of the same instrument, on the same time interval, for example, we can see a gap for 10 pips in chart A, and a shadow for 15 pips in chart B - and in the same place. This leads to unclear situations in which we wonder whether to play under the visible pin-bar or, however, for closing the gap. Sounds familiar? So how is this possible? Where do the differences in the charts come from? And most importantly - which chart shows us the truth? We explain.

Differences in the appearance (and amount) of candles between brokers
"The broker is cheating on me"
 For many years there has been a legend among traders about the manipulation of candles on the chart by brokers. This action is allegedly primarily intended to cut their stop-loss orders, drown out "good" trading signals and mislead traders. Well, perhaps such deliberate actions occasionally occur with more greedy brokers. However, in 98% of cases, the difference in quotes is due to something completely different. The awareness of traders is too great, and information spreads too quickly around the world, so such a banal and insolent way of manipulation quickly becomes visible and affects the reputation of the entire company.
READ: Dirty plays by brokers - TOP 5 | The biggest failures of brokers - TOP 5
Such actions are not worthwhile. Not only that, although some may not believe the broker does not know which way the course will go. Therefore, the theory of "confusing the trader" is extremely unlikely.
4-hour candles
One of the popular problems is candles on the 4-hour interval (H4). The brokers' server hours vary from time to time. Usually we are talking about a difference of 1-2 hours for European companies. The different hours visible on the platform are the result of the server location - if it is located in London, we will see it GMT time zone, in Poland GMT + 1, and in Cyprus GMT + 2. This small detail means that the H4 candle will start at a different time with a broker with a server in Great Britain than with a broker with a server in Poland. The hourly shift makes each candle look different. And we have no influence on it. We can only choose the broker with the "preferred" time zone. But where do the differences in the remaining intervals come from?
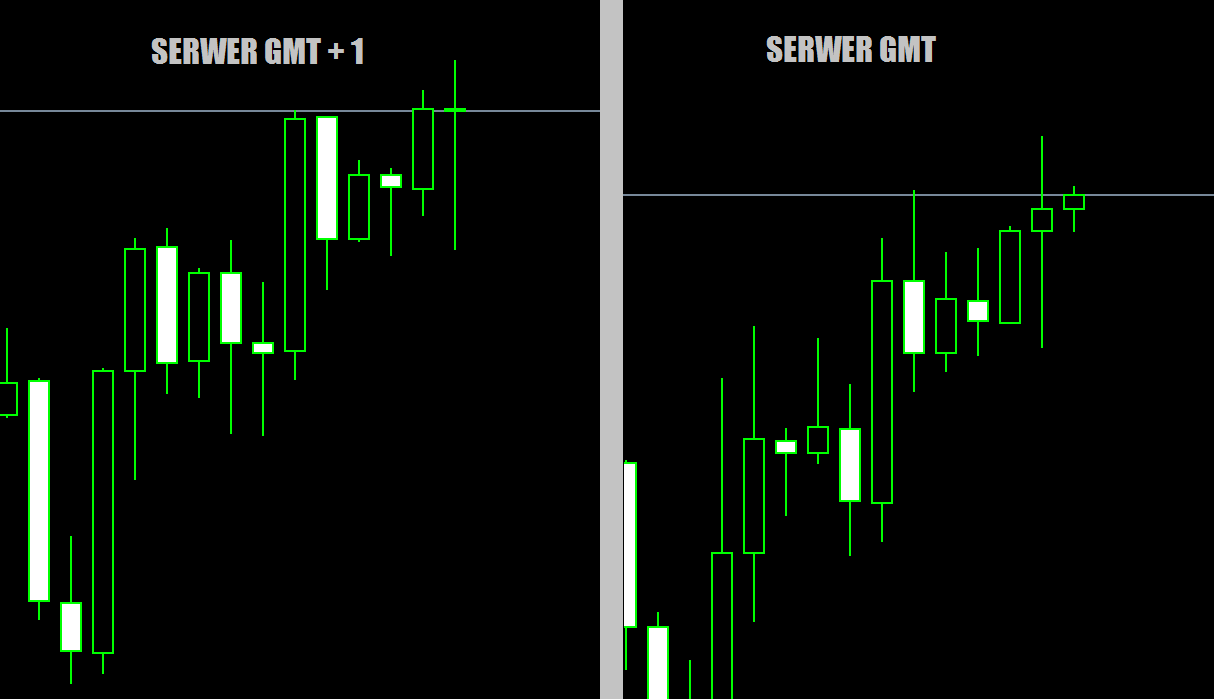
Differences in the appearance of H4 candles between brokers with different server times
Differences in the charts on the remaining intervals
First, let's make one point clear. Saying "Forex market”We should think“ OTC ”. In other words, it is a decentralized market that is not supervised by a single clearing house (such as in the stock or futures market), which would standardize the entire world turnover. Thus, we are not dealing with a concept either "One right price"which should appear at all brokers at the same time.
READ ALSO: Timeframe Forex. We choose the time interval.
95% of the time the rates will be almost identical and we will see a discrepancy of 1.0-3.0 pips at best. Such small discrepancies in the appearance of candles on TF (with ang. TimeFrame) above the M5 will not be too noticeable and should not disturb us. But for the 5% remaining time, there are some exceptions. So what influences the differences in the appearance of the charts?
Spreads
Differences small, because if we assume that the typical spread on EUR / USD in the Forex broker is 1.0, using the less competitive offer we will have to deal with max. 2.0 pips. But what about the publication of macroeconomic data?
During this time, miracles can happen on the market. Also with spreads. With the Market Maker broker, the spread can be artificially expanded to a fixed value, even a moment before publication, and return to the standard size only after the market situation has calmed down. However, with STP brokers, it will depend on their liquidity provider to which they direct clients' orders. From a colleague in MTF and ECN models it is the liquidity concentrated within a given broker that will dictate the terms. This means that the spread values when publishing macro data can assume (and assume) a different size for each broker, even when comparing companies operating in the same model (e.g. different spread with ECN broker # 1 and different spread with ECN broker # 2).
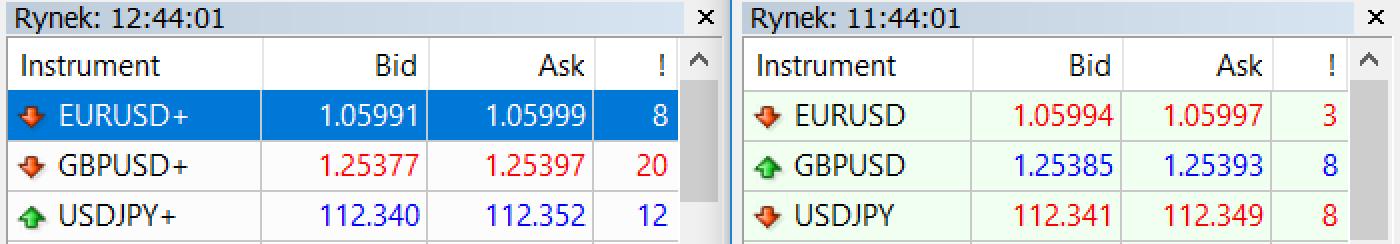
Different spread values for STP / ECN brokers at the same time
Liquidity
Access to a large amount of large orders volume makes quotes smoother and spreads tighter. In STP (Indirect), ECN and MTF models, this will have an effect on the quotes displayed in the chart. Very low liquidity will cause the quotations to change more abruptly, and thus, especially at low intervals, we will be able to observe more mini-gaps.
Impact of low liquidity on quotes
data feed
In other words, the source of quotations, i.e. the "place" from which the prices of financial instruments on the platform are taken. There are at least a few quote providers. Now imagine a situation where we have two Market Maker brokers who use different sources. Not only that, the data can be additionally filtered by them. Filtration has two tasks:
- catch and eliminate erroneous quotes that have nothing to do with reality. It is worth adding here that the effect of insufficient filtration or too many incorrect quotes in a short time is the occurrence of the so-called bad tick.
- offload the broker servers. The huge amount of quotes flowing to the platform, especially during periods of increased volatility, may have a negative impact on the work of servers.
READ ALSO: What are Badetic and where do they come from?
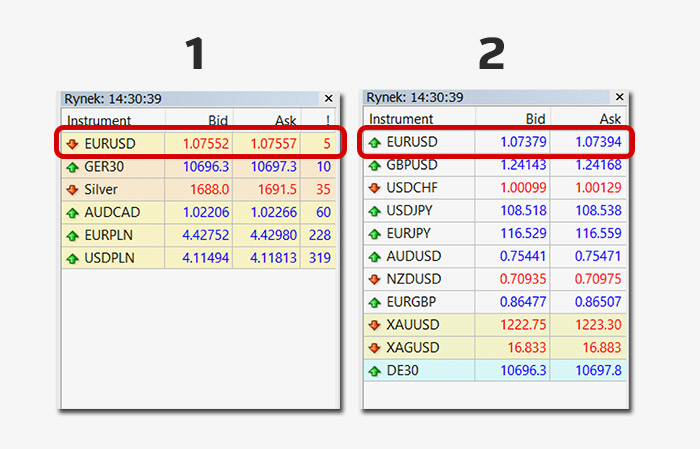
The difference between EUR / USD quotes from two brokers
Therefore, taking into account these factors, we must understand that, inevitably, differences have the right to occur and occur.
A series of incorrect quotes
Broker servers
This is a small nuance but it can also affect the appearance of the charts, especially at low time intervals. If you run the Forex platform on one 10 screen and observe the server time displayed on the platform (on MT4 it is just above the quotes) then you can see that not all clocks go evenly. Some are left behind by 1, 2, sometimes 3 seconds. And now imagine a situation in which quotations of the instrument change very dynamically, even several times per second. The 2-3 latency guarantees that each candle will close and open at a different level than other brokers. On the H1 chart, we will probably see this only in extreme cases, but in the case of M1 it will be a particularly noticeable phenomenon.
Breakdowns
An ideal broker is one that… does not exist. Even when we have already found our perfect offer, in the long run there is a high probability that there will eventually be a failure. The result is usually stress, complaints, but also "holes" in the charts. A quote break is almost inevitable. Admittedly, brokers zazwyczaj they fill in the gaps within 24 hours, but if we do not register ourselves that it is the result of a failure, we may have a problem with the actual rate analysis. The easiest diagnosis is to check the number of candles against the timeline at a lower interval.
Who says how is it really ...
 While reading this article, the thought "who to believe?" Flashed through your head for sure. So many factors that can affect the displayed price give rise to doubts. However, I will repeat again. This is just no more than 5% of the quotes that may differ on the charts, and in practice, for five brokers, only one candle will be noticeably different. Wondering before taking a position whether your broker's chart is showing the truth can only lead to paranoia. But there are differences and they can affect our investment decisions. So what to do with it?
It is not the appearance of the candle that causes the market reaction, but the course itself
This sentence fits perfectly with the differences in the appearance of the candles on the H4 charts, where the server's timezone is only to blame. But it will also work in other cases. As a trader, you need to develop some flexibility and not believe that it is a candle with a long bottom shadow that heralds an upward move. It is the fact that the price has fallen and then turned back quickly, makes us realize that the supply has lost its strength. The candle is only a graphical presentation of behavior, and our task is to understand market behavior. Many professional traders use the so-called combined candles, which convert standard candles to those that go beyond this scheme. And this is the key to success and burying worries about "correct charts". Don't believe that a trader at a large investment bank, looking at the H4 chart, wonders if most of the market is looking at candles starting at 23:00 or 00:00 and which are more important.
Of course, a broker offering quotes with a high degree of filtration or access to low liquidity will offer "inferior quality" charts, which will be important for us when trading at low intervals or using machines. Choosing an offer with quotations that suit us "today" is just a wishful thinking. Today, quotes are better with broker A, tomorrow they will be more favorable for us with broker B. This is a trap that lurks in our psyche. The exception is when we are talking about breakdowns and bad ticks, i.e. keeping priceswhich actually did not occur anywhere but we have no influence on it, because no one can predict such situations.


