


S&P 500 - The most popular stock market index in the world

The S&P 500 is an index of five hundred American companies with the highest capitalization, created by Standard & Poor's. It is probably the most popular stock market index in the world. It is believed to best reflect the state of development of the US economy. The companies included in the S&P 500 account for as much as 80% of the market capitalization of the entire US stock exchange.
CHECK: DAX - IDEAL INDEX FOR DAYTRADING
Other popular indices of the American stock exchange are the Dow Jones Industrial Average, Russell 1000 and Nasdaq Composite.
History of the index creation
The index was created in 1923 under the name "Composite Index"however, it was not until 1957 that it was expanded to its present form, covering as many as 500 companies. The current name of the index refers to the Standard & Poor's agency, which creates financial analyzes.
Below is a chart showing the historical valuation of the S&P 500 index since 1957.
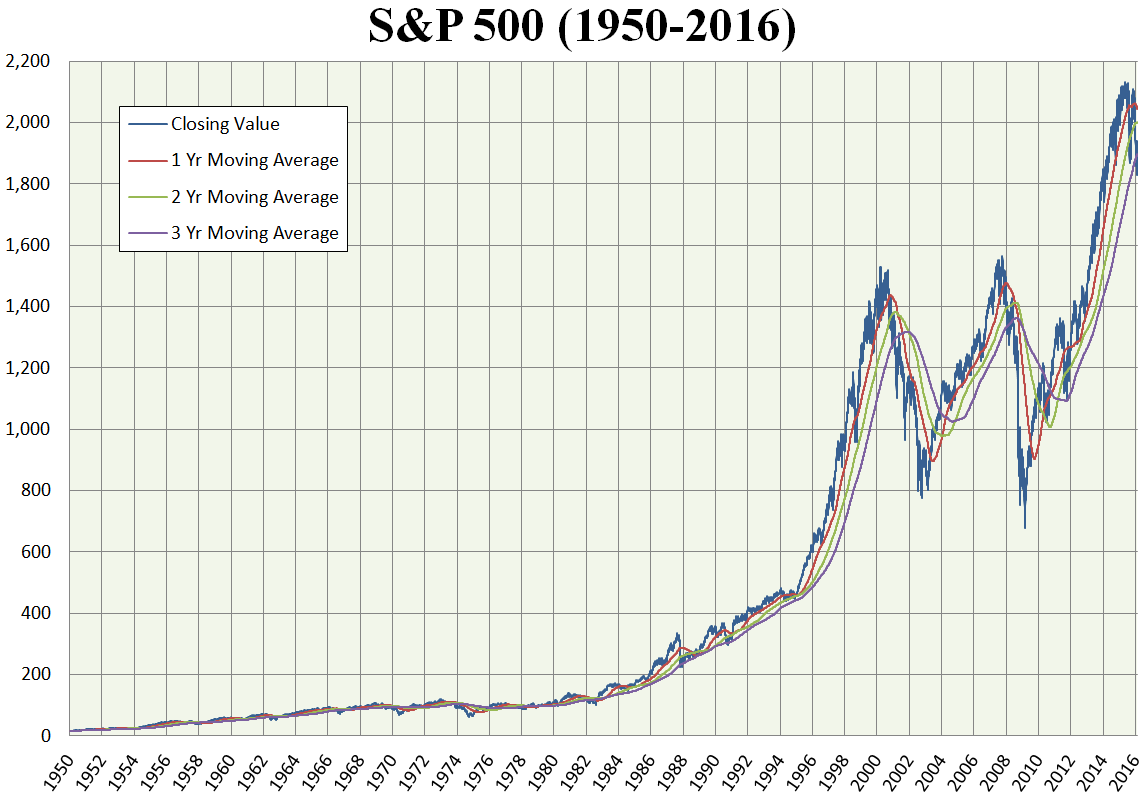
The S&P 500 index chart
Criteria for selecting companies to the index
Unlike the Russell 1000 index, which is strictly defined by the company selection rules, companies for the S&P 500 index are selected on a discretionary basis by the S&P analyst committee. When making their selection, analysts are guided by 8 main criteria relating to the size and liquidity of the company.
-
Capitalization
The company's capitalization must be greater than or equal to US $ 8.2 billion.
-
Liquidity
To ensure that the companies in the S&P 500 are not only large by capitalization but also highly liquid, the company must have an annual turnover of shares at least equal to its capitalization in dollar terms. However, the monthly trading volume must be at least 250 shares for 000 consecutive months.
-
Listed on the NYSE or NASDAQ
For a company to be included in the S&P 500 index, it must be listed on the New York Stock Exchange or Nasdaq Stock Market and their subordinate exchanges, i.e .:
- NYSE Arca,
- NYSE American,
- Nasdaq Capital Market,
- Nasdaq Select Market,
- NASDAQ Global Select Market,
- Cboe BZX,
- Cboe BYX,
- cboe EDGA,
- Cboe EDGX.
-
Principal US activity
S&P recognizes that a company is US and conducts its main business in the US when: it is listed on one of the aforementioned exchanges, it completes US tax returns, and most of the company's fixed assets and revenues are in the US.
-
Structure and type of action
The company must be a free float corporation. The S&P index cannot include limited liability companies (LLC, LP, MLP), closed funds, ETFs, ETNs, bonds, preference stocks, etc.
-
profitability
The company must report profit for the past four consecutive quarters.
-
Time of listing the company on the stock exchange
A company must be listed on the stock exchange for at least 12 months before it can be added to the S&P 500 index.
-
Number of free float shares
The amount of free-float shares is calculated using an indicator called Investable Weight Factor (IWF). This ratio must be at least 0.10, which means that at least 10% of all shares must be available for trading and trading by individual investors.
Composition of the S&P 500 index
The composition of the index is updated every 3 months. The share of companies in the index is proportional to their capitalization, which means that the companies with the highest capitalization have the largest share of the S&P 500. Only the number of free-circulation shares is taken into account when assessing a company's capitalization. Shares held by the company's shareholders or employees are not taken into account when calculating the company's capitalization.
The table below presents the top 10 companies of the title index, data as of September 2020.
| Company name | Symbol | Weight in the index | trade |
| Apple Inc. | AAPL | 6.38% | Electronics, Software |
| Microsoft Corporation | MSFT | 5.73% | Computer hardware, software |
| Amazon | AMZN | 4.88% | E-commerce |
| FB | 2.25% | Software | |
| Alphabet Inc. class A | GOOGL | 1.64% | Software |
| alphabet inc. Class C | GOOG | 1.60% | Software |
| Johnson & Johnson | JNJ | 1.41% | Cosmetics |
| Berkshire Hathaway Inc. class B | 1VOC | 1.38% | Insurance |
| Procter & Gamble Company | DAI | 1.2% | Cosmetics |
| Visa Inc. Class A | DBK | 1.17% | Finances |
The ten largest companies in the index account for nearly 1/3 (27.64%) of the capitalization of the entire S&P 500 index. The software and cosmetics industries dominate.
The top 10 of the American index is clearly dominated by relatively young technology companies, established in the 90s or the beginning of the 150st century. However, apart from the industry of new technologies, we also find several companies with over 1886 years of tradition. These are Johnson & Johnson founded in 181, Berkshire Hathaway founded 1839 years ago in 182 and Procter & Gamble founded 1837 years ago in XNUMX. As you can see, the strength of the American stock exchange and economy is not only keeping up with trends and producing technology that is used by the whole world, but also reliable companies with great resources and a history of existence despite changing times and markets.
S&P 500 - Dividend Aristocrats
In 2005, S&P created an additional index: S&P 500 Dividend Aristocratwhich includes companies that are part of the S&P 500 and at the same time consistently pays dividends for at least 25 years.
The easiest way to invest in "Dividend aristocrats" the US stock exchange is buying ETFs. The most popular are The ProShares S&P 500 Dividend Aristocrats ETFabout the symbol #NOBL and Cboe S&P 500 Dividend Aristocrats Target Income Indexfound under the symbol #SPAI.
What influences the price of the S&P 500?
The condition of the American economy
The S&P 500 index reflects the state of the US economy in most industries. Good and optimistic news from the US regarding employment and other economic indicators should support further increases in index prices.
Financial results of companies
The greatest impact on the index valuation is the condition and financial results of the companies included in the index. The top ten companies account for almost 30% of the index price movements. It is worth focusing on the news and financial results of these companies.
Inflation is driving prices up
Company stocks are assets whose valuation increases with increasing inflation. Due to rising inflation, ongoing reprinting and increasing welfare programs, one can expect a rise in the prices of the US index in the long run, rather than a decline based on the inflation forecast alone.
ETF on the S&P 500
[VOO] Vanguard S&P 500 ETF
-
- Issuer: Vanguard
- Annual fees: 0.03%
The fund offers extremely low management costs (0.03%). The fund manages $ 163 billion with average spreads of 0.01%. The fund follows the S&P 500 index faithfully and enables the reinvestment of dividends immediately after their payment.
[IVV] iShares Core S&P 500 ETF
-
- Issuer: Blackrock
- Annual fees: 0.03%
Like the Vanguard Fund, this fund also offers annual fees of 0.03% with average spreads of 0.01%. The fund has $ 217 billion under management, can reinvest dividends, and discloses its daily transactions.
[SPY] SPDR S&P 500 ETF Trust
-
- Issuer: State Street Global Advisors
- Annual fees: 0.09%
Another fund that perfectly mimics the S&P 500 index. It is the oldest American ETF with the largest daily trading volume. Unfortunately, unlike the funds described above, it does not allow dividends to be reinvested and the annual costs are slightly higher - 0.09%.
CFDs on the S&P 500
Investors can also speculate on the price of the SP500 index on brokerage platforms by buying and selling CFDs (for price difference) in real time. CFDs offer traders a leverage that allows you to engage only a fraction (typically 5% / leverage 1:20 for this instrument) of the margin required. The S&P 500 is usually found under the symbol US500.
Popular brokers offering the S&P 500
Below is a list of the most popular ones Forex brokers offering the best conditions for CFDs on US indices.
| Broker |  |
 |
|
| End | Poland | Cyprus / Australia / Mauritius | Great Britain, Cyprus |
| Symbol of the S&P 500 | US500 | US500 | US500 |
| Min. Deposit | PLN 0 (recommended min. PLN 2000 or USD 500, EUR) |
200 USD | PLN 100 |
| Min. Lot value | price * 50 USD | price * 1 USD | price * 1 USD |
| Commission | - | - | - |
| Platform | xStation | MT4 / MT5 / cTrader | MT4, MT5 |
CFDs are complex instruments and come with a high risk of losing money rapidly due to leverage. From 72% to 89% of retail investor accounts record monetary losses as a result of trading CFDs. Think about whether you understand how CFDs work and whether you can afford the high risk of losing your money.


Leave a Response