


S & P500: week with one-day gains above 5% in response to lower inflation!

The past week was dominated by lower than expected inflation in the US and strong reaction of financial markets. The S & P500 ended the week in a clear gain. The yields on US 2-year and 10-year treasury bonds fell sharply. The same can be said about the sharp weakening of the US dollar.
In this report, we will also look at the results of the US supplementary elections, which are still pending, but it seems that we are moving towards a divided Congress, which in total could be good news for the markets.
The past week was very successful for the capital markets. S & P500 index During the week it increased 5,90% and is already 11,6% above the bearish bottom from 12.10.2022/16,75/3.01.2022 and only 500% below the peak of the last boom on 15/2022/2009. The chart below shows the S & P2001 index with an overlaid range for the maximum rebound and duration of such a rebound in a bearish market (based on 1974 such uptrends in bearish markets in 2020, 2009, 2002 and 1987). Additionally, we have plotted the average new boom path on the chart (based on examples from 1982, 1974, 1970, 1966, XNUMX, XNUMX, XNUMX and XNUMX).
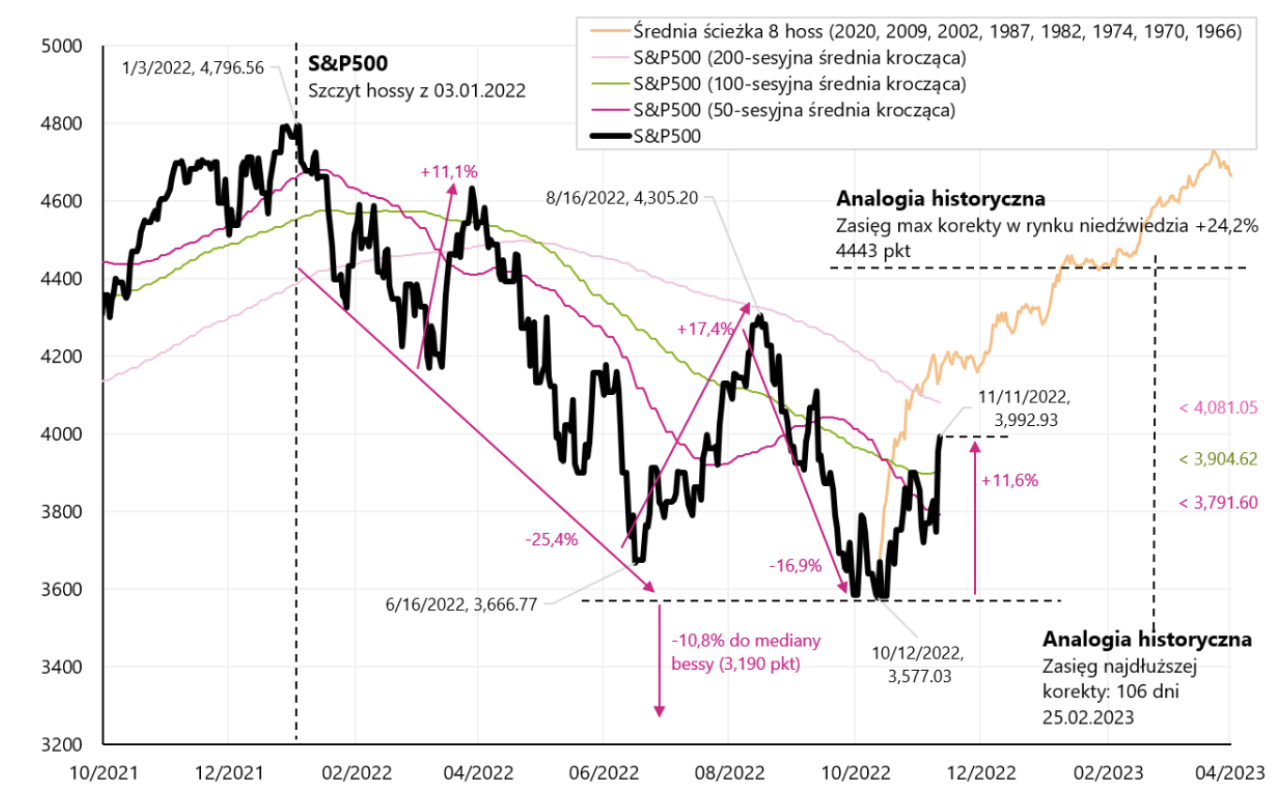
W.1 Index S & P500 until 11.11.2022/XNUMX/XNUMX Source: own study, stooq.pl
The market reaction to the better-than-expected inflation reading was spectacular. The S & P500 rose by more than 5% on Thursday in just one day. This is a lot if the average rate of return on this index from 1948 to 2022 is "only" 7,96% per annum (counting from the peak of the bull market in 1948 to the peak of the bull market in 2022). At first glance, it might seem that such strong gains are a good signal for the market, but was it so historically? Since 1948, we have only had 23 such cases, 14 of which were in a bearish market (meaning the market was eventually even lower), 8 in a bull market (the market was no longer below the close on the day before the increase above 5%). We had the last 23 case in the past week. The next chart details all such situations since 1948 (vertical lines indicate days with increases above 5%).
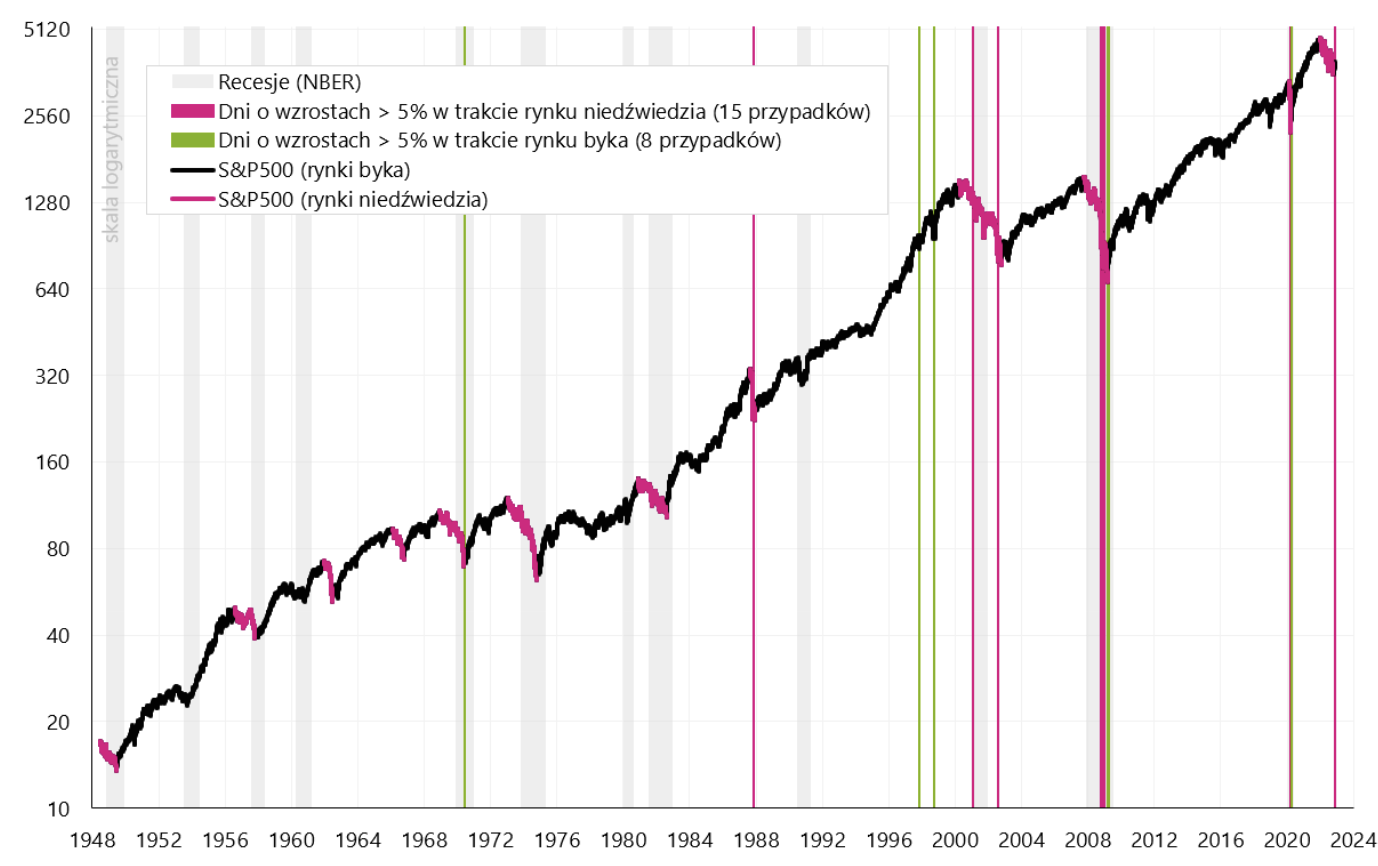
W.2 Index S & P500 from 1948 with the days added, when the index increased by over 5%. Source: own study, stooq.pl
Most cases of increases by over 5% were recorded during the bear market in 2000-2002 and 2008-2009. The next chart "approximates" the period between 1997 and 2004.
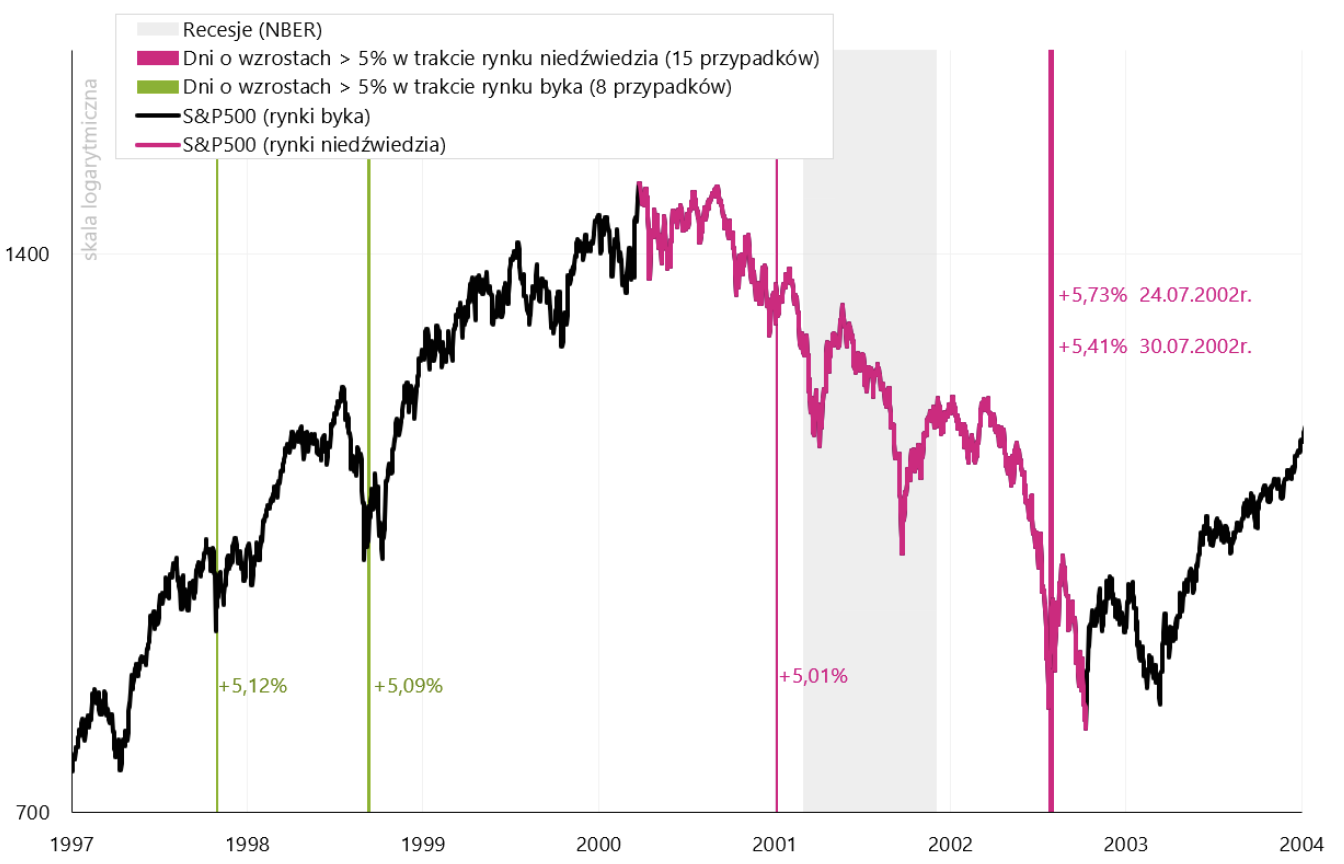
W.3 Index S & P500 from 1997 to 2004 with marked days, when the index increased by over 5%. Source: own study, stooq.pl
In the next chart, we "zoom in" the period between 2007 and 2010, and the next chart shows the years 2020-2023. In general, sessions higher than 5% have historically been more frequent in bearish than in bull market. They can also be related to the beginning of the bull market, but also to the first part of the bear market. During a bear market, we usually deal with greater market volatility, including sharp spikes in the stock market. This also applies to the large one-day drops in the S & P500 index, which we wrote about in more detail in one of the previous ones weekly reports. Summarizing, it can be said that the greater volatility of the markets (big dips and big gains) has historically been more tied to bear markets than to the bull market. Nevertheless, the beginning of a new bull market (after previous strong declines) may also be full of many strong upward sessions.
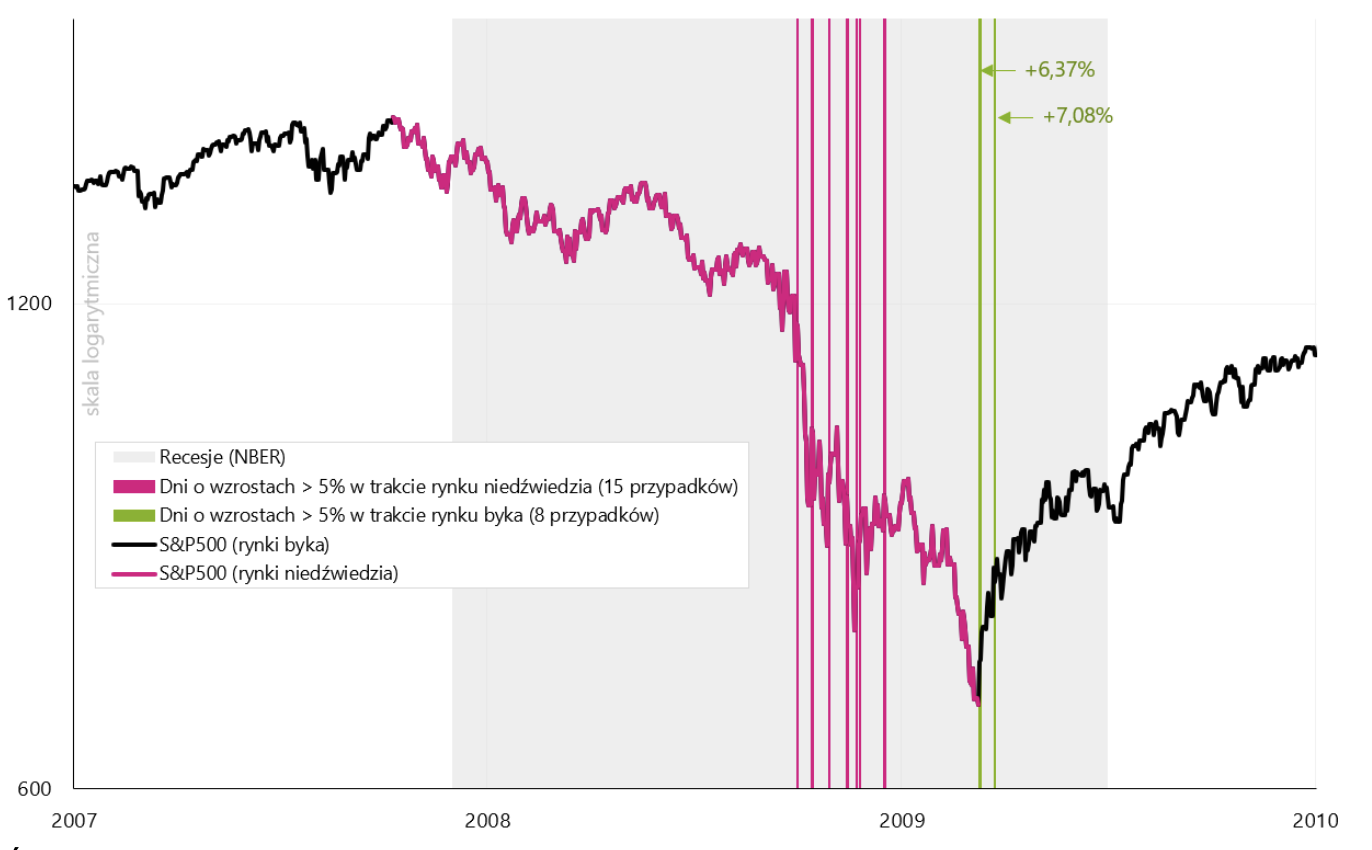
W.4 Index S & P500 from 2007 to 2010 with marked days, when the index increased by over 5%. Source: own study, stooq.pl
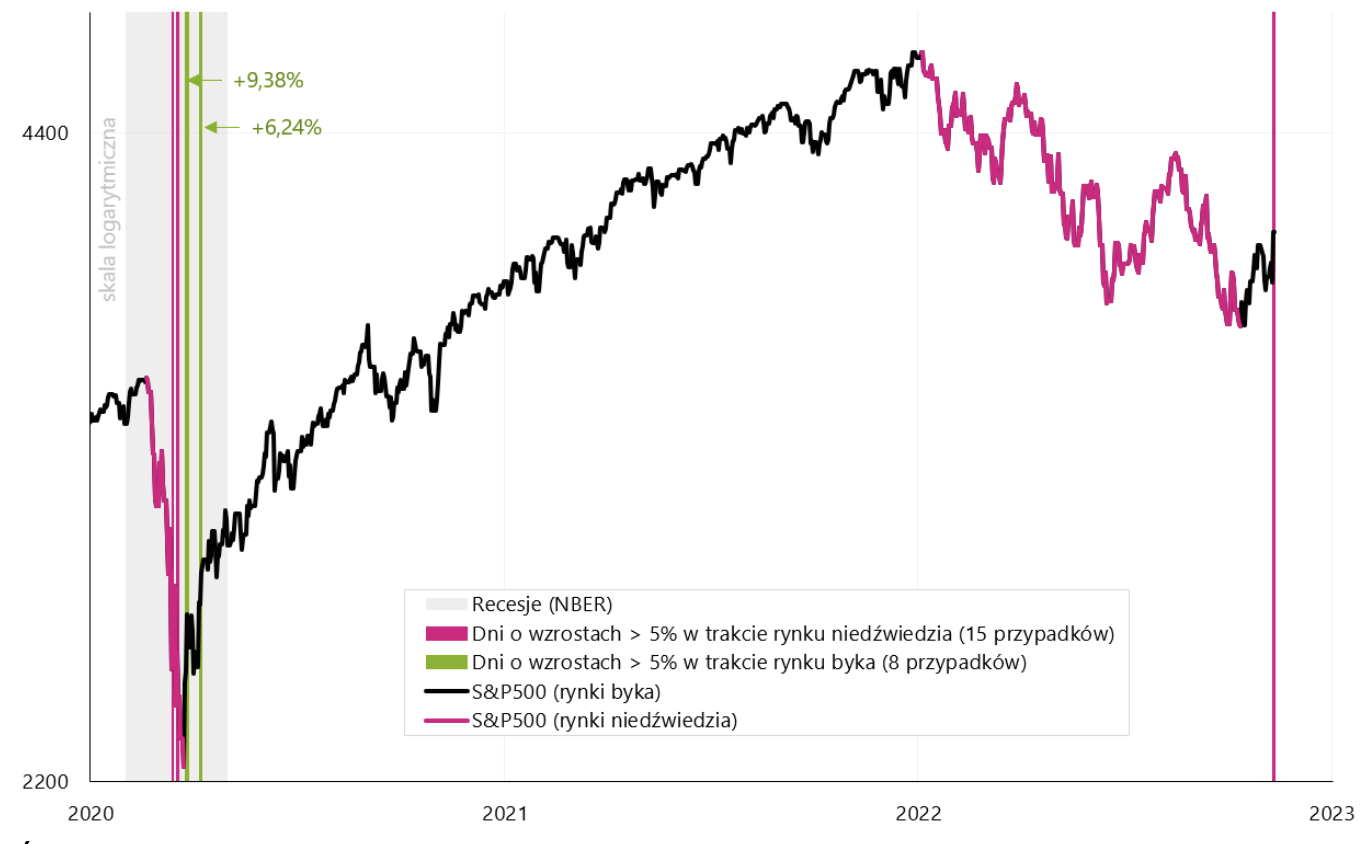
W.5 Index S & P500 from 2020 to 2023 with marked days, when the index increased by over 5%. Source: own study, stooq.pl
Inflation in the US - more details
Inflation remains one of the most important figures in the current cycle, so it is worth following it closely. Main conclusions regarding inflation in the US for October this year we presented in a separate report, however, below we will look at the exact contributions of the annual and monthly changes, as well as changes in the most important components.
Of course, core inflation remains the most important. The decline in the annual rate of core inflation will depend mainly on the pace of decline in core inflation of goods and the "stickiness" of core inflation in services. The contribution of core commodity inflation to the annual change in the entire basket of inflation should relatively easily and quickly fall to zero, or even to negative values (the global economic slowdown will do its job, and the previously occurring problems in supply chains and supply-side constraints seem to be beyond us. ). The chart below shows the impact of core commodity inflation on the annual change in inflation.
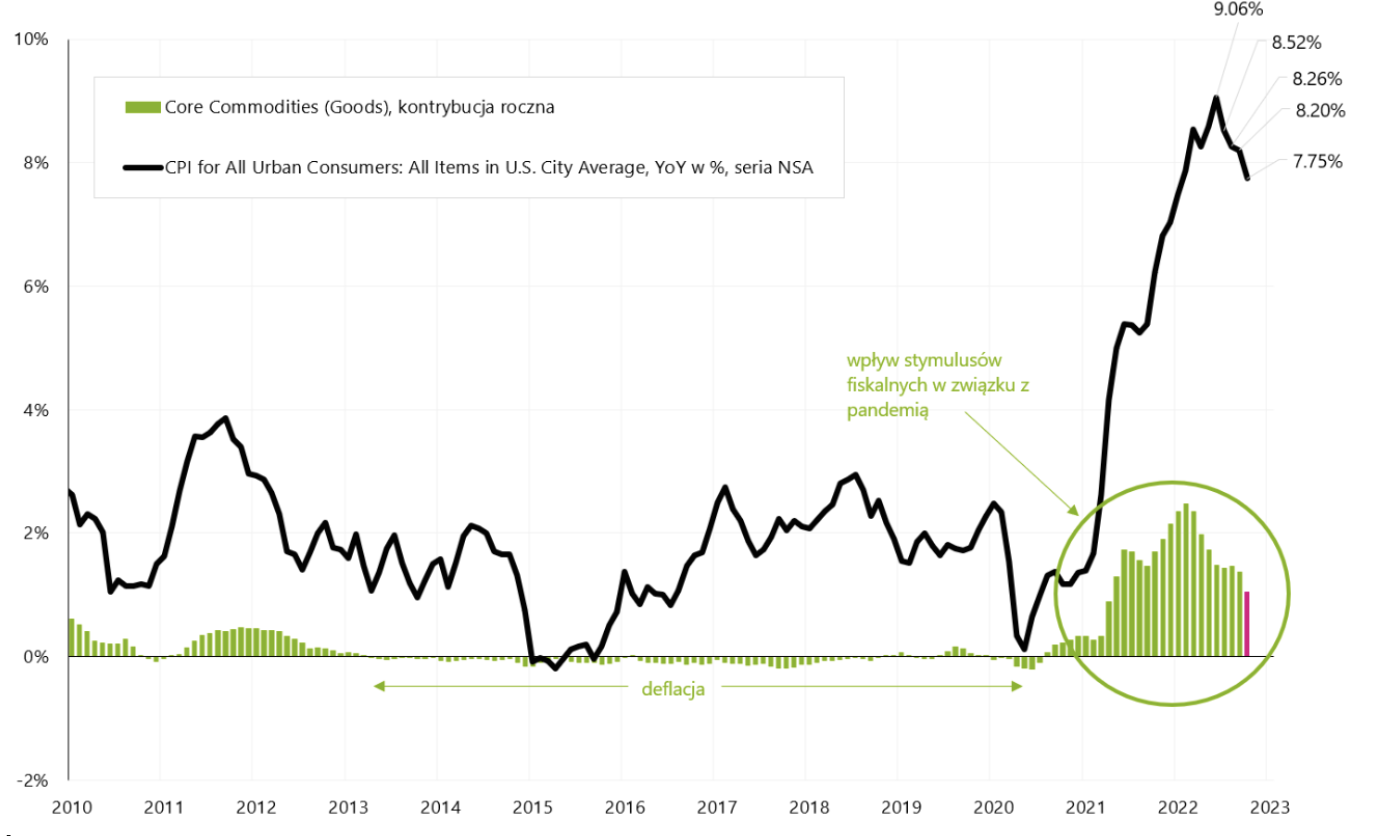
W.6 US inflation year on year and the impact of core commodity inflation (contribution) on the annual change in inflation. Source: own study, FRED, BLS
The following chart shows the monthly change in core commodity inflation. In October this year. in this series we already had deflation of -0,38% month on month.
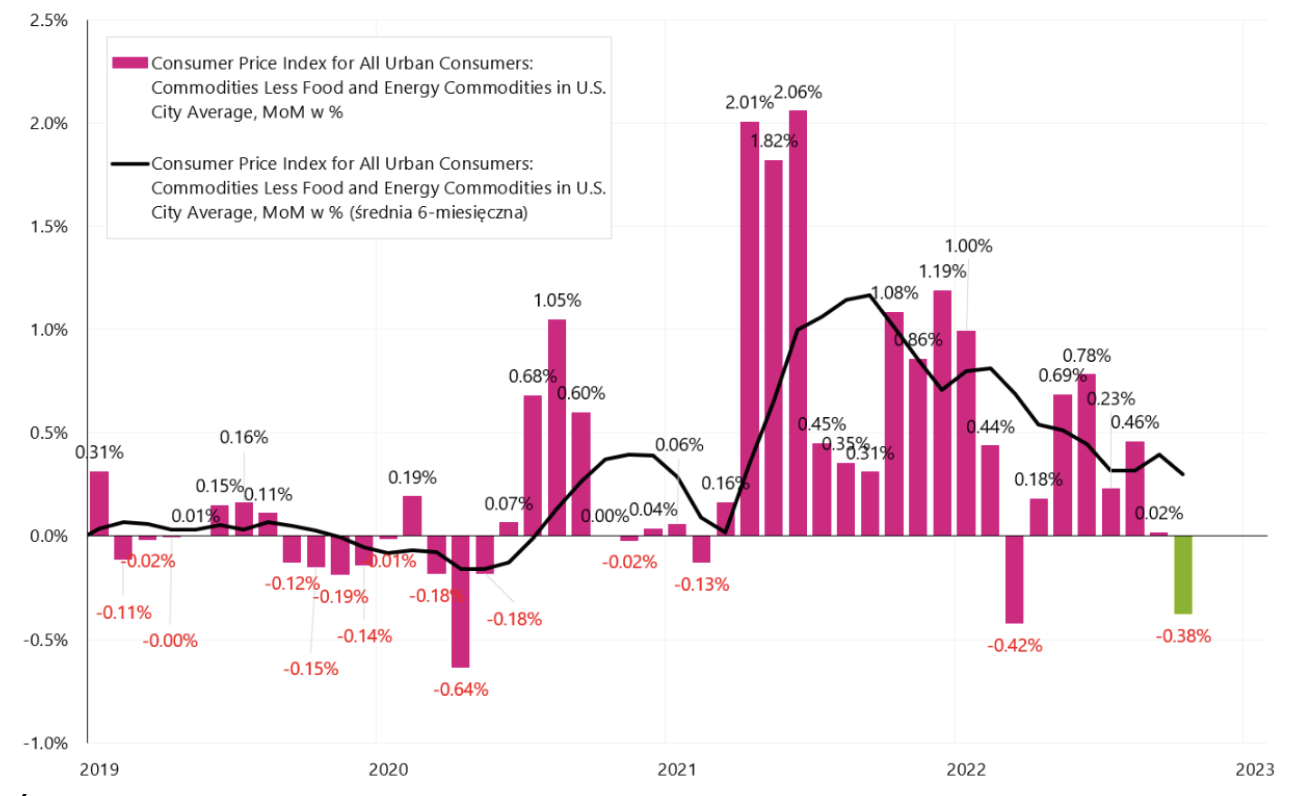
W.7. US core commodity inflation, monthly change, SA series (seasonally adjusted). Source: own study, FRED, BLS
The next chart shows the exact contributions to the monthly change in inflation (for the SA series - "seasonally adjusted"). The middle column shows the monthly contribution of the change broken down into core inflation for services, core inflation for goods, and two components not belonging to core inflation: energy and food.
The monthly contribution of core inflation in services amounted to as much as 67% of the entire change in monthly inflation. The left column shows the monthly contributions of the largest components of core inflation in services, while the right column shows the largest components of core commodity inflation. Noteworthy is the "Shelter" (services), and the series of prices for used cars and trucks (used cars and trucks) in the base inflation of goods. Declines in used car prices have removed almost 0,1 percentage points from the entire basket of inflation, but that is still very little compared to Shelter inflation (services related to the rental of apartments), which added as much as 0,245 percentage point to total monthly inflation.
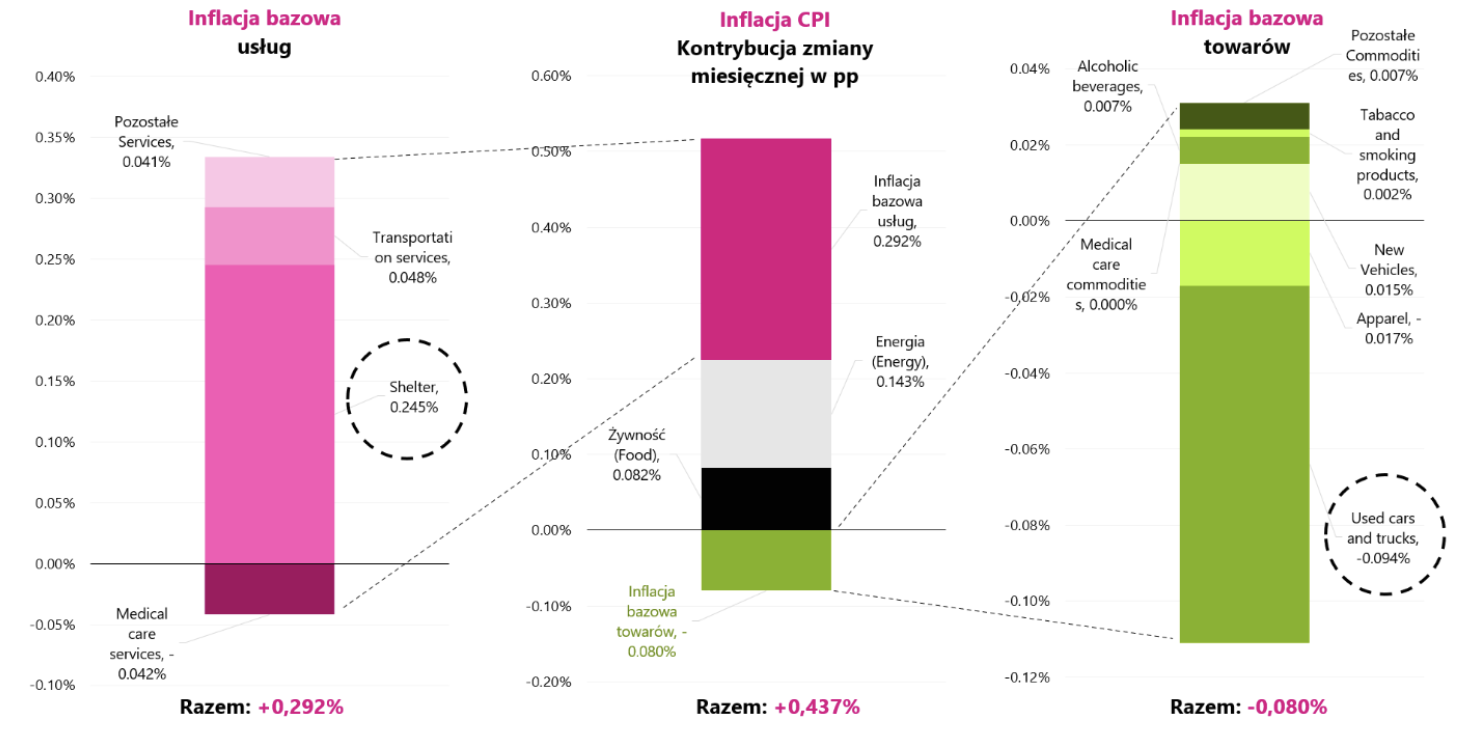
W.8 US CPI inflation, monthly change for October this year, SA series (seasonally adjusted), and contributions of changes in the most important components, broken down by core inflation in services and goods. Source: own study, FRED, BLS
The next chart shows the monthly "Shelter" inflation, which in the last two months has remained at the highest level of monthly change in the current cycle.
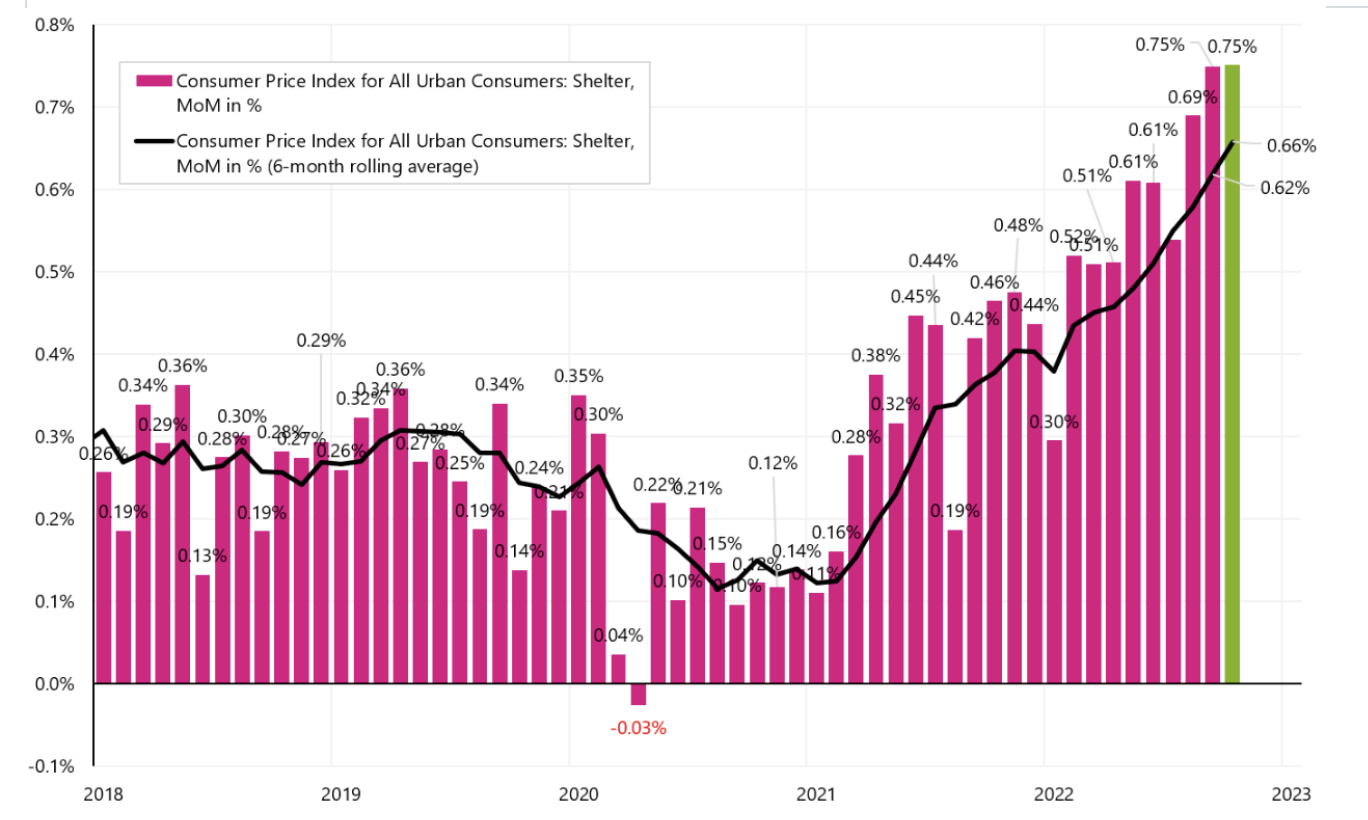
W.9 Inflation Shelter Monthly Change SA Series. Source: own study, FRED
The next chart shows the monthly change in "Used Car" inflation, which fell by 2,42% over the past month.
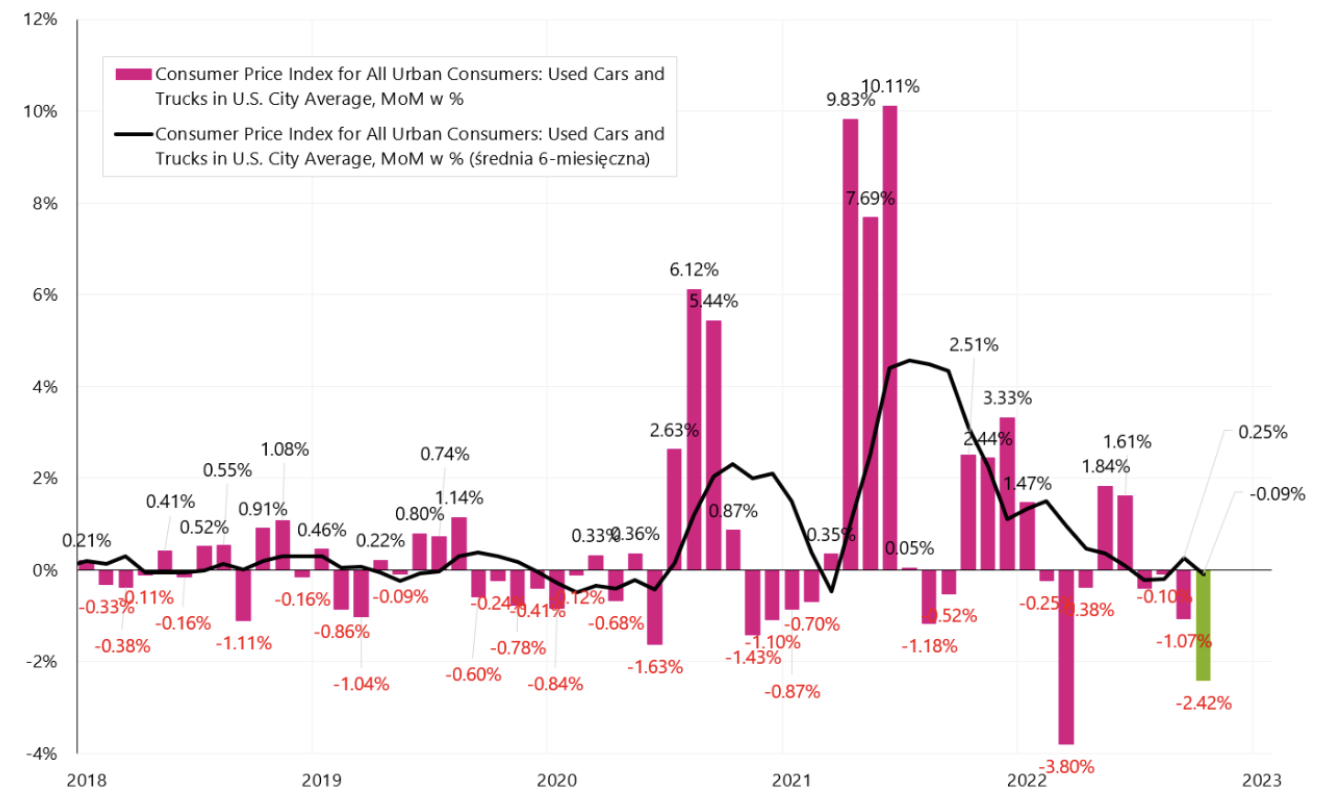
W.10 Inflation "Used cars" monthly change, SA series. Source: own study, FRED
Interestingly, when we look at the chart below, we can see that used car prices dropped from 1995 to 2020. It was only changes in the market caused by the pandemic that caused the prices of new and used cars to soar. The next chart shows the price index for used cars. It can be expected that along with the slowdown in the economy and rising interest rates on car loans, the prices of used and new cars may remain under further downward pressure (which will result in a further decline in core commodity inflation).
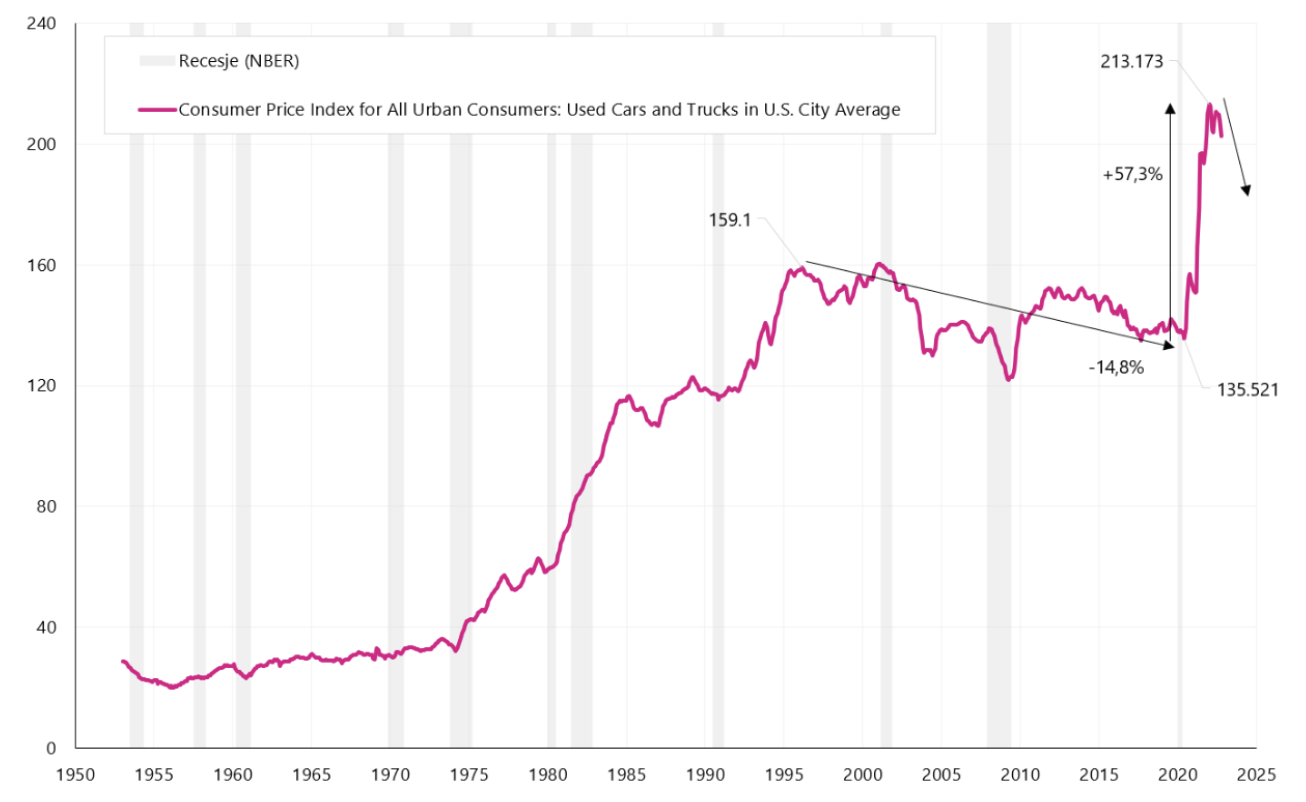
W.11 Series index "Used cars". Source: own study, FRED
The annual inflation dynamics should decline in the coming months. One of the major contributions should be core commodity inflation. But for inflation to move towards the inflation target (2%), a decrease in service inflation will also be needed, which may be problematic. In October this year. the annual contribution of core inflation in services to the annual change in inflation was as much as 4,98 percentage points (the annual change in core inflation in services is 6,7%, while the core inflation in goods is only 5,1%). In other words core service inflation itself generates inflation well above the inflation target Of the Fed.
Results of the by-election (half) to Congress
This year, Americans elect a new composition of the House of Representatives (435 seats) and 35 Senators (out of a total of 100). 418 seats are needed to control the House of Representatives, while the Republicans need 51 seats to control the Senate and the Democrats only 50 (in a 50/50 split, the US Vice President has the casting vote). Before the elections, the Democrats controlled both houses, but with a minimal margin of votes (in the Senate they had 50 votes against 50 Republican, and in the House of Representatives 220 votes versus 212 Republican votes).
At the time of writing this comment, the elections are not yet fully settled. According to the portal FiveThirtyEight (e.g. analysis of polls, opinions, politics, economics and sports) the current results in the Senate are practically 49 to 49 seats, and the elections in Georgia (there will be a second round of voting on December 6) and Nevada (according to FiveThirtyEight the current difference between candidates in counted votes is less than 900, with about 94% counted votes). On the other hand, the elections to the House of Representatives are also pending, and at the moment the confirmed results are 211 seats for Republican vs 205 for Democrats.
If, as a result of the results, we are dealing with a divided Congress, which, paradoxically, this would be good news for the capital markets, because in such a situation it is more difficult to pass more extreme ideas regarding expenses or taxes by one of the political parties.
Summation
US equities ended the week with a big gain and a new "hill" of the current reboundwhich began on 12.10.2022/XNUMX/XNUMX. Since that time the S & P500 index has already increased by 11,6%. Inflation remains the most important for the markets, its decline in October this year. to a greater extent than expectations, it caused euphoric increases in, among others, in the stock markets. Inflation should continue to decline in the coming months, but this does not automatically mean a quick start of rate cuts by the FED.
The results of the half-election to the US Congress are still not fully settled (it is possible for the Democrats to maintain control over the Senate and lose control of the House of Representatives at the same time). Nevertheless, a possibly divided Congress would be good news for the financial markets, because in such a situation both parties will have to cooperate to some extent, and more extreme solutions and ideas will have little chance of being voted down.
About the Author
 Jaroslaw Jamka - Experienced fund management expert, professionally associated with the capital market for over 25 years. He holds a PhD in economics, a license of an investment advisor and a securities broker. He personally managed equity, bond, mutli-asset and global macro cross-asset funds. For many years, he managed the largest Polish pension fund with assets over PLN 30 billion. As an investment director, he managed the work of many management teams. He gained experience as: Member of the Management Board of ING PTE, Vice-President and President of the Management Board of ING TUnŻ, Vice-President of the Management Board of Money Makers SA, Vice-President of the Management Board of Ipopema TFI, Vice-President of the Management Board of Quercus TFI, Member of the Management Board of Skarbiec TFI, as well as Member of Supervisory Boards of ING PTE and AXA PTE. For 12 years he has specialized in managing global macro cross-asset classes.
Disclaimer
This document is only informative material for use by the recipient. It should not be understood as an advisory material or as a basis for making investment decisions. Nor should it be understood as an investment recommendation. All opinions and forecasts presented in this study are only the expression of the author's opinion on the date of publication and are subject to change without notice. The author is not responsible for any investment decisions made on the basis of this study. Historical investment results do not guarantee that similar results will be achieved in the future.


Leave a Response