


Shares seem expensive, but is it really?

In this analysis, we discuss US stock valuations that have recently regained interest from many investors, with the current XNUMX-month leading P / E ratio on the S&P 500 index has been cited as an argument against potential returns on US stocks over the next 10 years. We analyze individual arguments to show why this is too far-fetched an assumption - first, because earnings growth as such is not included in the analysis, and second, because equities should be valued against bonds, which are their natural alternative. Compared to bonds, US equities continue to offer an attractive risk premium, so we continue to hold a significant number of them and maintain a positive outlook for these assets.
About the Author

Peter potter - director of equity markets strategy in Saxo Bank. Develops investment strategies and analyzes of the stock market as well as individual companies, using statistical methods and models. Garnry creates Alpha Picks for Saxo Bank, a monthly magazine in which the most attractive companies in the US, Europe and Asia are selected. It also contributes to Saxo Bank's quarterly and annual forecasts "Shocking forecasts". He regularly gives comments on television, including CNBC and Bloomberg TV.
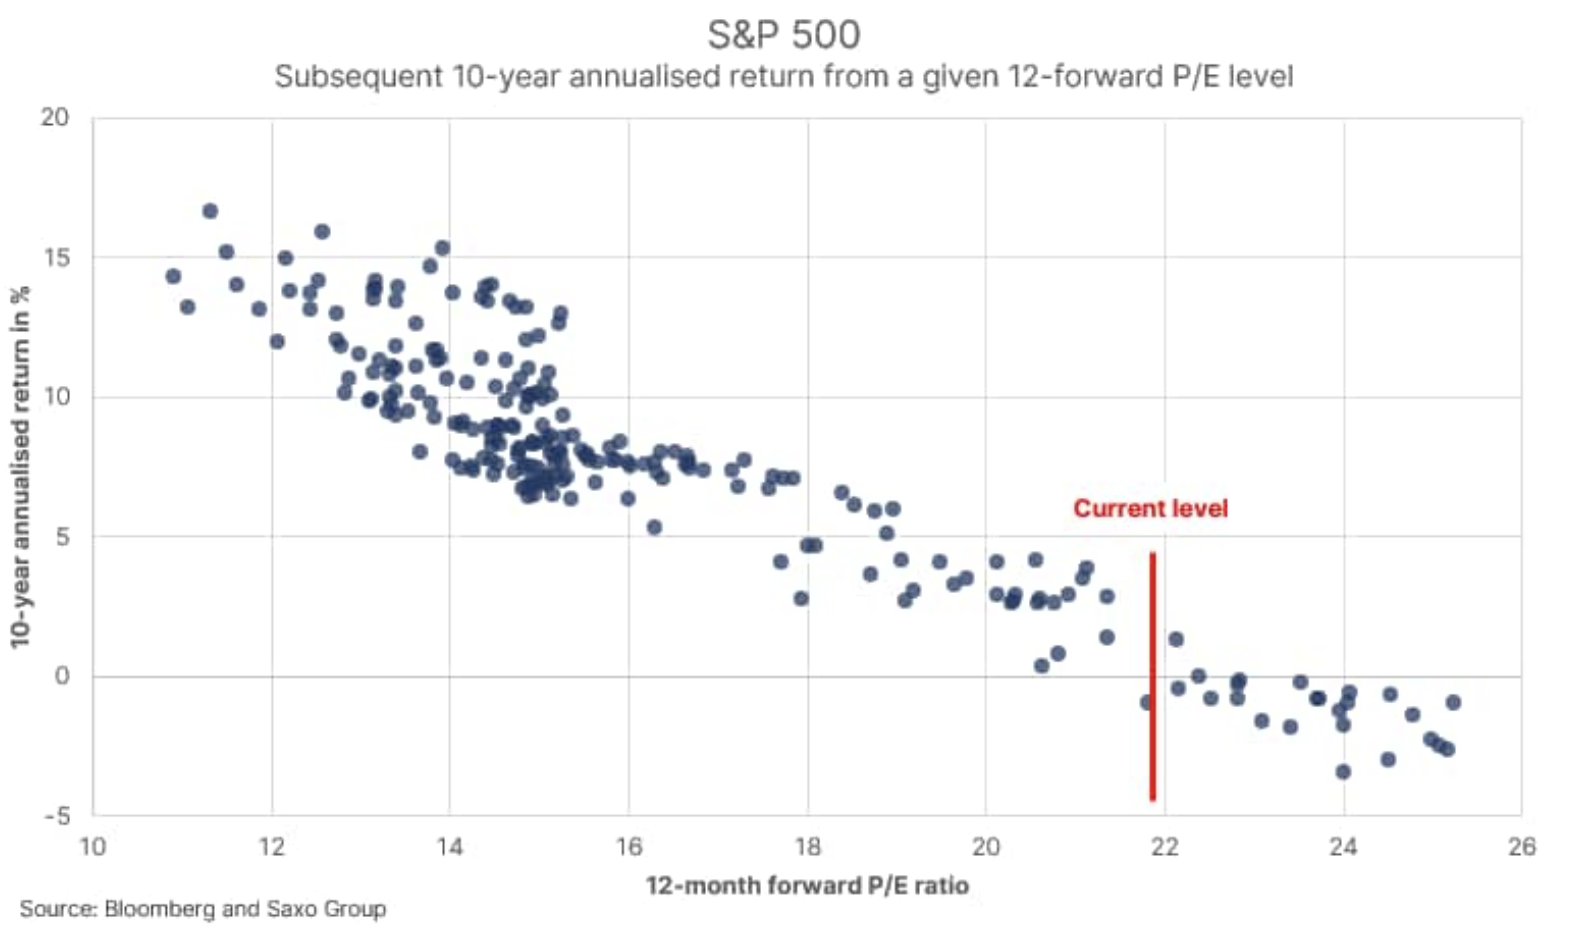
Almost 11 years of professional experience in this industry has taught me that most investors rarely have their arguments fully thought out and tend to use statistics in a highly questionable way. Recently, many news sites and key figures in the industry have presented the chart below. It represents the successive 500-year annualized rates of return from the respective initial level of the 1992-month leading P / E on the S&P 22 Index using data since January XNUMX. The straight line is the current XNUMX-month leading P / E ratio just below XNUMX.
Many market commentators have used a zero return regression line based on historical data to show that US stocks offer an unfavorable risk-reward ratio. However, the statistical truth is as follows: the prediction range around these points is relatively large, and the 2-year annualized rate of return from the current level can range from -5% to + XNUMX%. In other words, the valuation itself is not worth much, it can only serve as a rough estimate of future values.
Another important issue that should be taken into account is the fact that the last profit season (QXNUMX) showed that analysts' estimates were too conservative. The current XNUMX-month leading P / E ratio may prove to be significantly out of date if projected earnings do not reflect the significant impact of earnings increases as a result of the current fiscal regime. As you can see, even such a simple graph is shaped by many variables.
The next step in the analysis is to recognize that equities do not function in isolation, but are part of a complex financial system in which bonds are their primary alternative. If we take the inverse of the P / E ratio, we get profit yield, a simple proxy for the implied rate of return on a stock, and comparing it with the lowest possible rate of return (yield-to-worst) of US Treasury bonds with maturities of seven to ten years, we will get a simple implied risk premium on equities.
This simple model does not take profit growth into account, as the inverse of the leading P / E ratio generates perpetual profit yield. Let us leave this point for a moment as it is a digression in the context of our reasoning; we can now compare the implied risk premium on equities with the risk premium on the successive ten-year annualized returns on US equities, and US treasury bonds with a maturity of seven to ten years. The implied risk premium on equities essentially measures what we can expect in terms of equity return versus bond yield with the current level of equity valuation and prevailing bond yields.
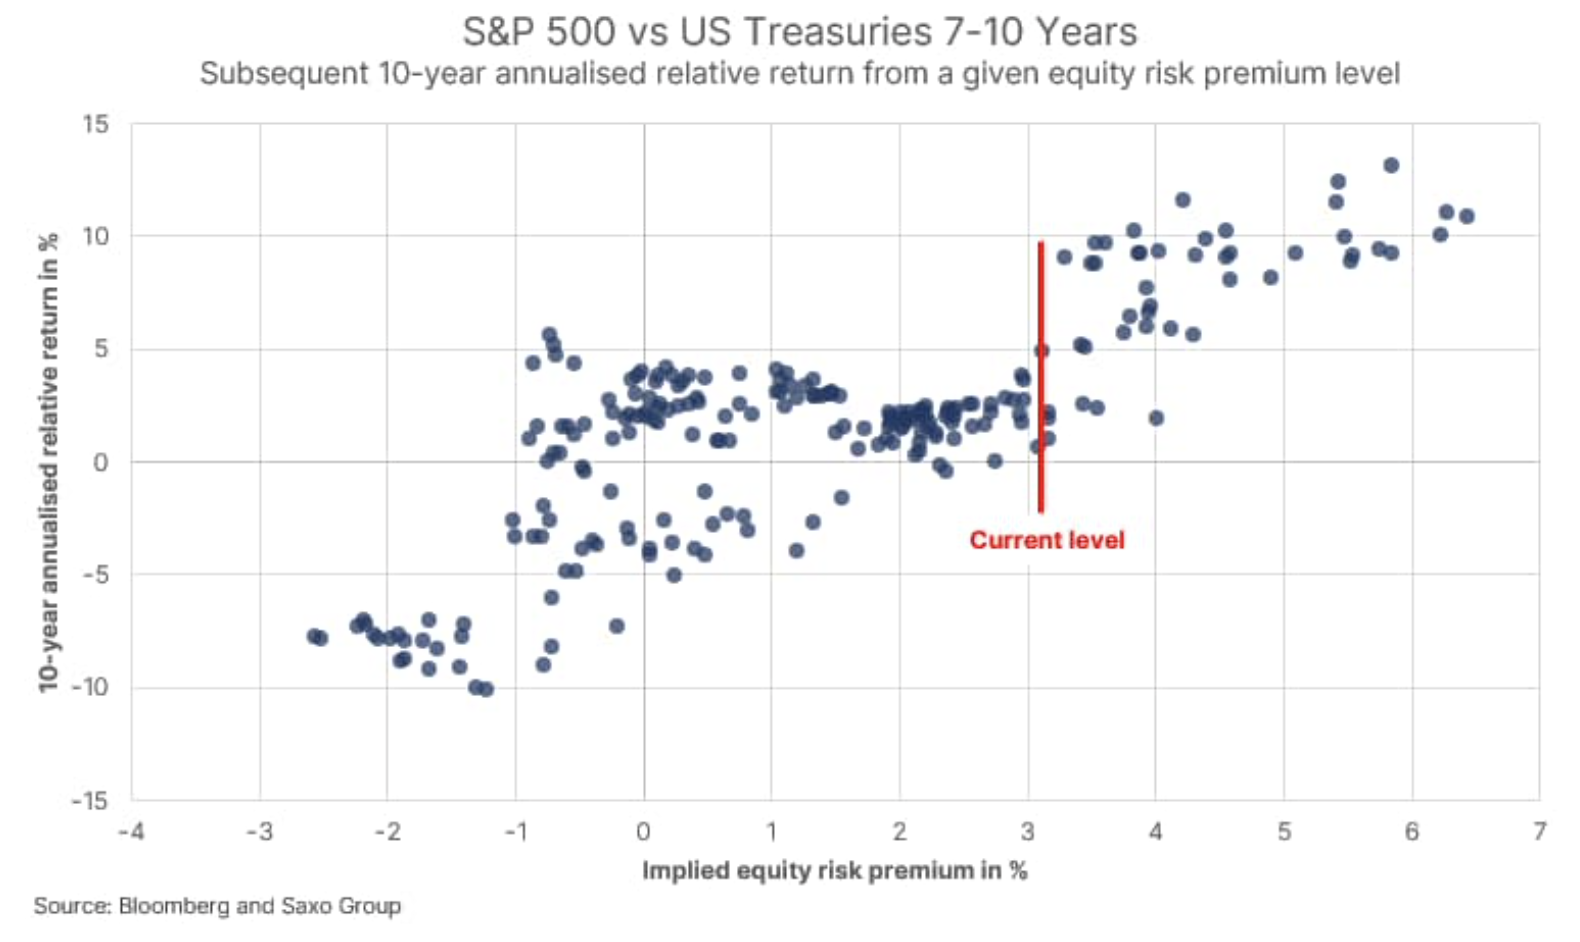
As you can see in the chart, there is a positive relationship here, as it should in theory, which means that the higher implied risk premium on equities is in fact associated with higher returns on equities than on bonds. Profit yield is now 4,6%, and assuming the lowest possible return on US Treasury bonds with a maturity of seven to ten years at the end of April (1,5%), the current implied risk premium on equities is 3,1%.
History suggests that at this level of implied equity risk premium, investors profit by investing in equities at the expense of bonds. If we include profit growth and we will apply free cash flow instead, the current implied equity risk premium will be around 4%, again confirming the positive and constructive outlook for equities. It is clear, however, that as interest rates rise, perhaps due to higher inflation expectations, the implied equity risk premium goes down and investors should then gradually reduce their equity exposure.


Leave a Response