


Forex Strategy: Confirmed High, Confirmed Low Part II

According to the assumption of the first part of the article, which you can find under TYM link, we move on to tools that support the analysis of the chart. At the very beginning, it is worth adding that the indicators that we will use are consistent with the concept available in the first part of the text, based on the levels of support and resistance. They will be an additional confirmation of the sentiment prevailing on the market and a good help in concluding, conducting and closing transactions.
According to the trend
One of the more interesting indicators that are mainly used by people playing with the trend are moving averages. We will plot exactly three EMAs with different settings on the chart. It would be good to color the future ribbon (at least at the beginning) to distinguish the priority of the generated signals. Personally, I use color red to EMA20, yellow to EMA40 and green to EMA100. Taking into account the time interval we focus on (H2 / H3 / H4), the averages reflect three types of traders (short-term, swing trader and long-term). It is enough to multiply the used interval by the EMA period settings to get the time in which each of them has time to potentially contain more than one item. According to this statement, when playing on the H3 interval, the average price of the EMA20 is calculated from 60 hours (20 candles x formation time of one candle - 3h). During this time, the day-trader necessarily contains more than 1 position, therefore the average price we get from the EMA will reflect the short-term sentiment prevailing on the stock.
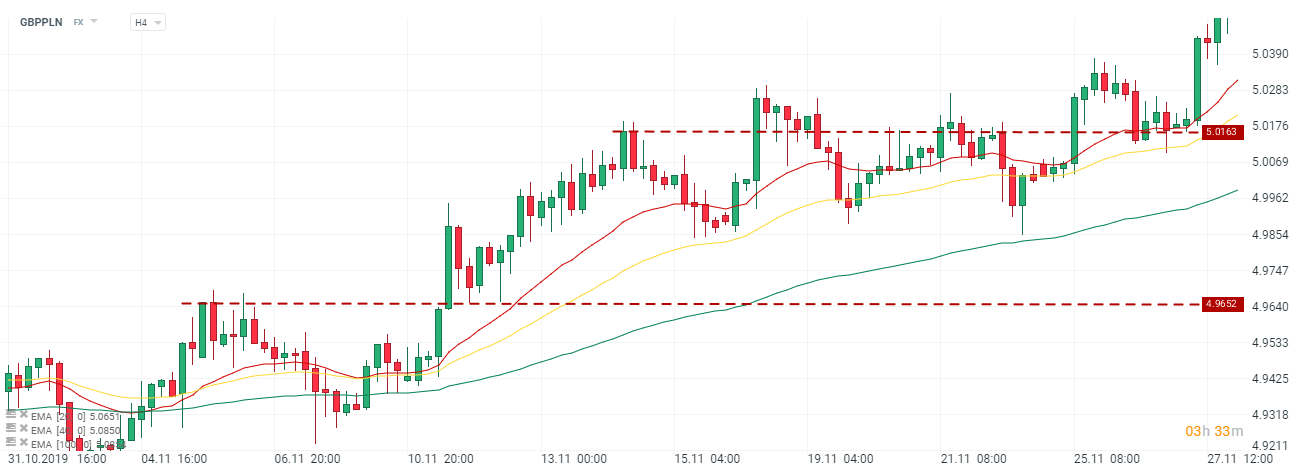
GBP / PLN chart, H4 interval. Source: xNUMX XTB xStation
We put the above-mentioned averages on the same chart. The ideal moment to enter the position would be the intersection of all averages. However, this is only a theory and not being on the market all the time, it is difficult to hit this point perfectly. Of course, the sense of the perfect moment is not absolutely necessary, it can only give us a few-point bonus at the start. Averages are a good help in determining further trends. Personally, I pay most attention to what is happening on EMA 40, which I will explain later in the text. I will only add that it prevents panic reflexes of closing the position when, for example, in the upward trend larger correction movements occur. What's more, EMA is very easy not only to use, but also to understand the mechanism of its creation.
Or maybe MACD?
About that the index we wrote more widely here. Of course, if we are in favor of using this indicator, there is nothing to prevent adding it instead of averages to the chart. Nevertheless, I say subjectively that if it is possible to add pure EMA to the analysis, there is no need to use the indicator that is its derivative (EMA is part of MACD). It is not advisable to use them both at once, due to the possibility of conflicting signals (too fast on one indicator). In this article, we give ourselves a greater description of the uses of MACD.
Keeping positions
In a very general assumption, the position should lead to practically exhaustion of all traffic. Translating this into practice, it's hard to catch over 100 point movement that will not contain a gram of correction. In theory, we should expect (in an upward trend) intersection of averages from above, which will give us a signal for a potential reversal of the trend. However, it is worth considering the main element of the strategy, which is the confirmed summit. If, in fact, the quotations do not set a new peak, it is good to secure the profit collected so far and move on to observe what is happening on average. It may happen that our traffic will not cover even within a few days of the TP we founded. Therefore, it is better to win the small profits earned or close the position at 0 than to (in the worst case) note the loss.
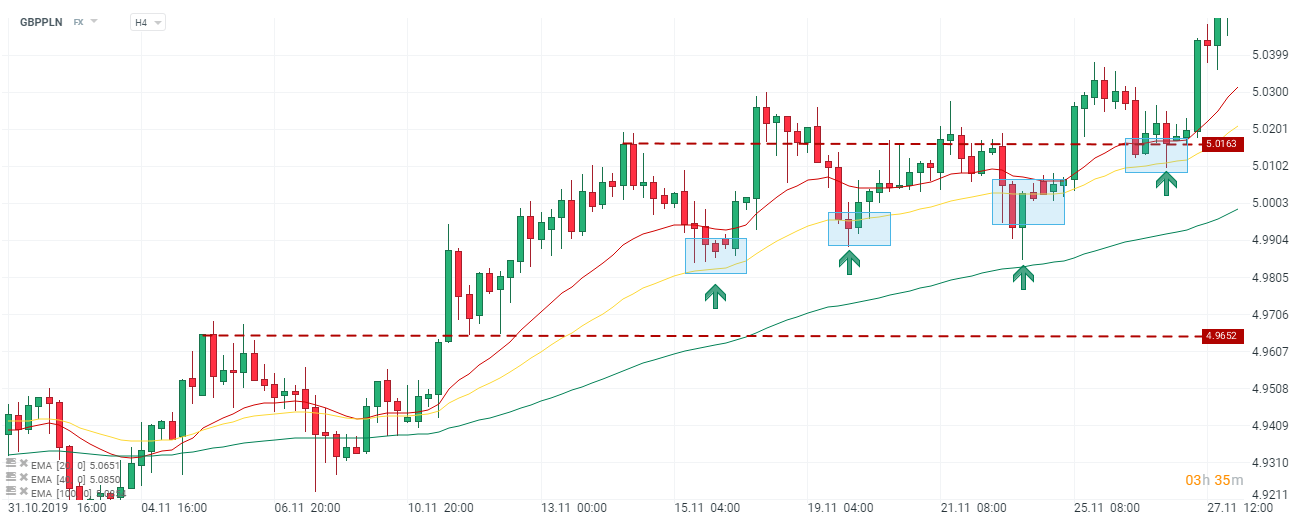
GBP / PLN chart, H4 interval. Source: xNUMX XTB xStation
Earlier in the text I mentioned EMA 40 (yellow line) as the one which is the decision-making average. Most of the corrective movements that appear on the chart with the H3 / 4 interval are "pulled out" from the average price of 40 candles. Until this supply actually breaks through the yellow EMA (i.e. the next candle will not close below it) I will not close the position. It is equally important to observe quotations at designated levels. It may also be that the price of a particular asset meets the closing condition according to the average, but remains supported with a tendency to show further increases.
A safe way would be to close the position by suggesting the average and its possible resumption, after keeping the price well with support. Of course, this move is at the expense of our holy peace. There is nothing wrong with re-entering into a transaction. On the contrary, if we have the opportunity to re-use the trend in the already analyzed chart, we should make the most of our previous work.
Summation
This strategy is simple and requires discipline in its use. In my opinion, the number of indicators and methods used is not overwhelming and their understanding and application does not require outstanding skills or horrendous experience with technical analysis. What's more, the ability to analyze individual candles and formations is extremely useful. You can also find knowledge on this topic on our website.


Leave a Response