


Forex Strategy: Confirmed High, Confirmed Low Part I

Everyone wants to create or apply a strategy that will bring them a satisfactory rate of return, preferably in the shortest possible time and with the least risk. However, we rarely focus on understanding its idea and fundamental assumptions, at least at the beginning, when we absorb the knowledge of virtually all possible methods of analysis like a sponge. I use the strategy that I want to show you today and describe in combination with other simple forms of analysis. Although it is not a market discovery, its clarity and simplicity will certainly contribute to its ease of use. It is intended for swing traders, due to the fact that the position is assumed to last +/- several days. I invite you to read!
Be sure to read: + 22% profit after 14 weeks of the "End of the day" strategy test
One interval
To make trading as easy as possible, I only use one interval in the strategy I have presented. This is usually H3, and if it is not available on some platforms, H2 (it can also be used on H4) due to the length of the traffic it wants to catch. The signals from the higher intervals are more reliable for me because I do not like tracking small movements. By trading actively and observing the market for several years, I was much more likely to read erroneous signals at low intervals. You will probably also notice that at low intervals "a lot" is happening (M1 - M15), which requires ongoing analysis. In addition, one interval causes no contradiction in the generated signals. Why? Previously, I focused on the analysis of D1 and H3. In a large part of the cases, the daily quotations showed a downward trend and there was a buy signal on H3. Having such an image, my head is full of ideas that maybe it is just a correction, maybe a wrong signal, or maybe a breakout will occur… The conclusion was simple - everything needs to be simplified.
Our Forex strategy and its assumptions
It is important to have certainty from the beginning check list assumptions of our strategy. Until we form it in our minds, it will be difficult to talk about effective trading and possible research on its effectiveness. Testing for the first time a few years ago this strategy was for me like any other - what does it mean? This means that it was not making any profits and generating regular losses. Why is he earning now? Because I learned to meet its specific conditions. Even the best playing scenario, which brings at least 80% of good entries, will not be effective if we implement it with a pinch of salt. Therefore, if you know that you have a tendency to stretch the situation for selling or buying just to be in a position, I recommend that you make a list of conditions that must be met by a given situation in order for you to take a position.
Stop loss and take profit
One of the assumptions is keeping positions for several days. We will look for such moments on the chart so that any supply / demand movement will be used until the end or TP assumed by us. Usually, I want to get 120-140 points from the market (we are talking about the forex market and value e.g. EUR / USD) loss usually limited to +/- 30 points. Of course, you can use the lower intervals to narrow the profit range, albeit enough to make the ratio of profit to loss 4: 1. To put it very simply, we can make a mistake 4 times and end the transaction on a loss, and one good position will make up for a potential series of defeats. Stop loss I usually set it with the conclusion of the position and move it to 0 when it goes in the direction I assumed. Of course, its value matches the instrument, remembering the 4: 1 ratio.
The question now is whether to set TP for yourself? Honestly, I rarely do it. If it is already, it is on average 20 points away from the place. If our position reaches the 120 points assumed by us, this is where my stop loss is. I always try to use the traffic to the end or let it move a dozen or so points. We do not lose anything on such play (in case SL will close our position on the desired profit), and any bonus for patience can be quite good.
What is this confirmation?
The strategy I am describing can be successfully used at any interval, but its effectiveness can be different and depends on the capital employed and the time of market tracking. Nevertheless, my subjective opinion in this matter is to use its potential for H2 and up, analyzing one interval. Even without superimposing the indicators and lines I describe on the chart, you will quickly see (jumping between intervals) that using even two for analysis, effectively distracts and builds up a mass of unnecessary, often contradictory scenarios.
Knowing what interval we want to analyze, the first thing we do is to set a trend in quotations. This is not a mysterious and knowledge-intensive knowledge, because we will see trends with the naked eye. Being in an upward trend we draw horizontal lines at the tops, while in a downward trend we set them on the holes. In total, it is the designation of support or resistance places.
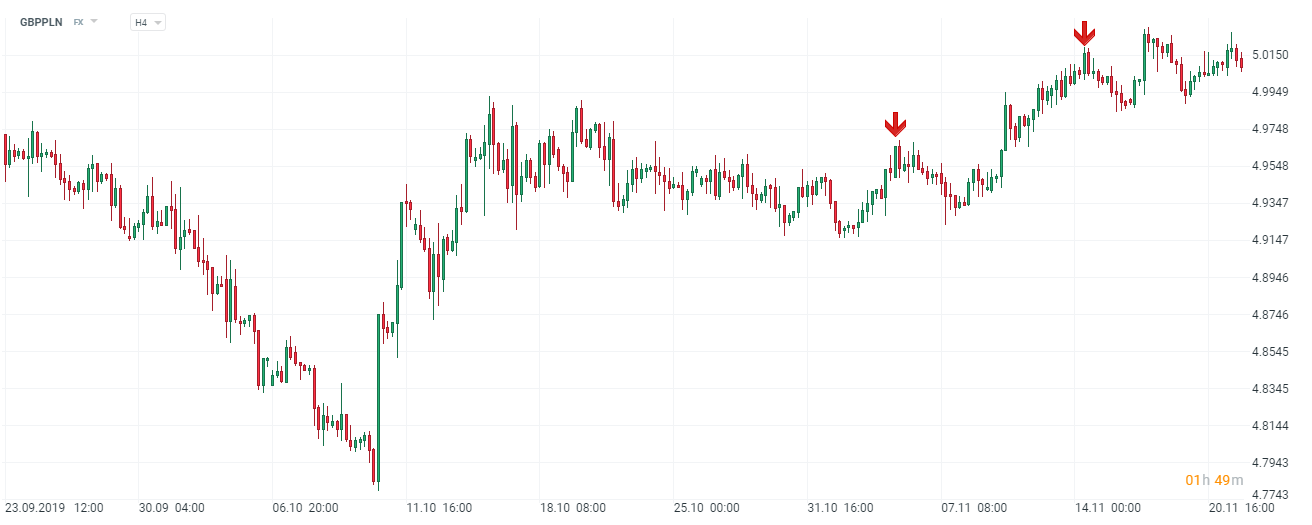
GBP / PLN chart, H4 interval. Source: xNUMX XTB xStation
In the chart above, arrows have marked the peaks on which we will base in the further part of the analysis. Importantly, if we designate them once, we do not have to do it again with each new analysis. Just extend the horizontal lines, which will continue to serve us well during subsequent transactions. Here comes another conclusion that it is worth limiting the game to several instruments, analyzing them well and waiting for the right moment for the transaction. It is also very important not to contain them by force or after half-fulfilling the conditions. Lack of position is also a position, often less lossy than the one in which we could be.
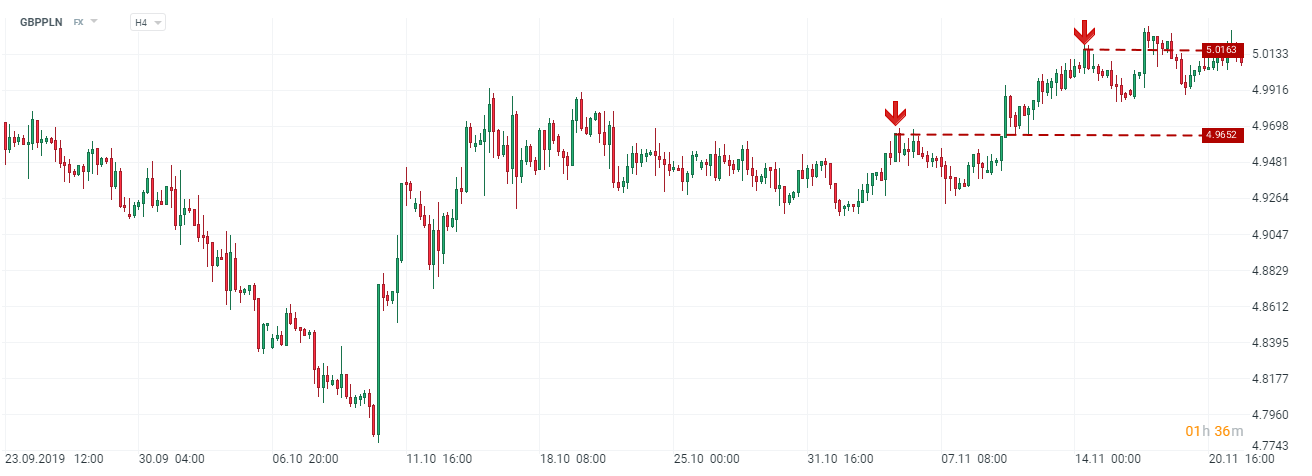
GBP / PLN chart, H4 interval. Source: xNUMX XTB xStation
This is what the graph looks like when marked on (in this case) tops of horizontal lines that will provide us with levels of support or resistance. Why do we design them? They provide me with a good base for monitoring a specific trend. Here I use the principle known to all traders that we talk about an upward trend when the next peak is higher than the previous one, and about a downward trend that the next hole is lower than the previous one. Therefore, in order to consolidate in the direction of movement, the easiest way is to observe whether (and how!) The quotations behave at the price of the last hole / last peak.
Where can we find confirmation?
Confirmation is nothing more than a place where quotations exceed and inevitably confirm the market trend. We will use the example of a chart here.
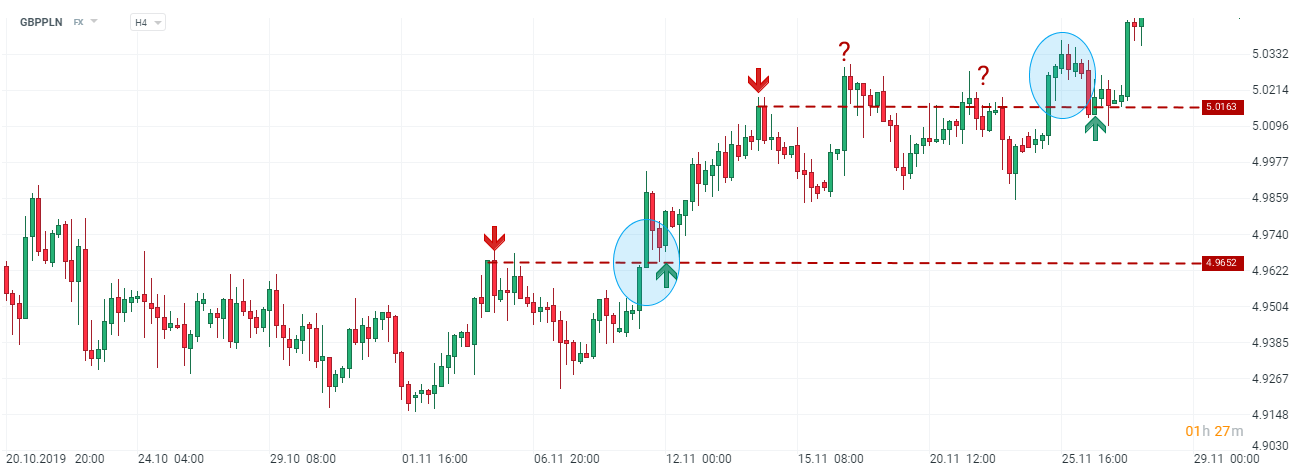
GBP / PLN chart, H4 interval. Source: xNUMX XTB xStation
Taking as a reference point what I wrote above (horizontal line breakthrough point) it is worth considering where the actual confirmation is. Let's take to the workshop the first summit created. Its confirmation (and also a signal of continuation of upward movement) can be found in the place marked with a blue ellipse. You can see that the quotations, despite the formation of two red candles, bounced off our designated level. At the second summit, a bit more happens and here we can face the first doubts in the application of the strategy. Why aren't the places marked with question marks the summit confirmation places? Please note that despite breaking the red, dashed line, the GBP / PLN exchange rate did not stay above its level. Only the third time the buyers managed to maintain this price.
Only part of the strategy is described in this text. Nevertheless, it can be used as well as a ready-made game recipe according to the analysis of support and resistance levels. The second part of the article is coming soon - I will describe additional tools that I use to increase the effectiveness of the methods presented here.


Leave a Response