


Investment strategies based on fractals [List]

Investment strategies based on fractals
The Fractal Indicator is one of the most popular tools created by Bill Williams. Its exact operation and components that make it up we described in the previous article. The simplicity with which it is used in everyday trading attracts crowds of beginner traders. Over time, however, it turns out that it generates such a large number of signals (especially at lower intervals) that it is even difficult to filter them.
Wskaźnik Fractal is rated as one of the effective trading tools, which in combination with other elements of the analysis complements them perfectly. High compatibility and the lack of generating conflicting conclusions from the analysis made this tool very good "Hook" in strategies based on trends and support in analyzes that focus around the oscillators themselves.
What indicators and technical analysis tools are worth using a fractal? Can it be effective as the only element on the chart? How to filter signals coming from it? In today's text we will try to answer all the questions. We will also analyze several strategies that use this tool. We invite you to read!
Only fractal
In the entry about the indicator itself, we said that using only this tool in the chart is not very effective. Today, however, we will take a closer look why it is worth combining it with other elements of technical analysis. Let's take a look at the graph below.
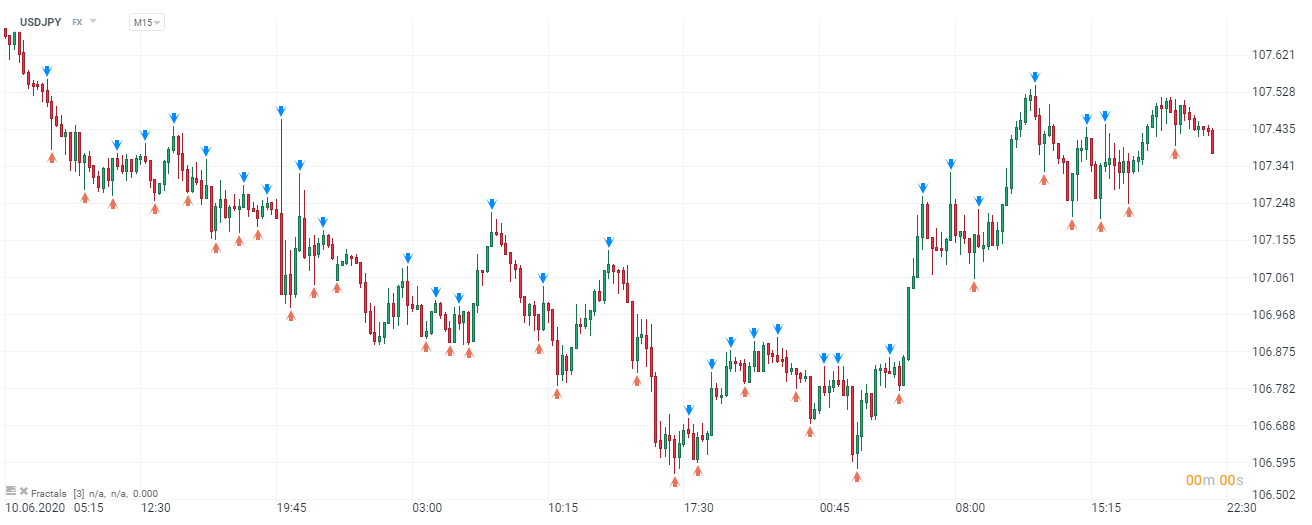
Platform fractal indicator xNUMX XTB xStation.
We used the fractal on the M15 interval, steaming USD / JPY. The number of signals generated by the indicator is really impressive, and filtering them can be (especially at the beginning) extremely difficult. Of course, I still claim that you can base your strategy only on the indicator itself, but there is some difficulty associated with its use in practice. If we feel strong and can analyze a clean chart, looking for trends or places with high accumulation of demand or supply, Fraktal can serve us as a good confirmation (or not) of our assumptions.
Another downside to using Fractals themselves is the time they form. At least two candles before it is created and two candles after the place where they can potentially form must be lower (in the case of upward) or higher (in the case of downward) than high / low. Therefore, it is not an indicator on the basis of which it will simply make immediate decisions. It takes a while to create a fractal, and this generates some delay.

Platform fractal indicator xNUMX XTB xStation.
Let's look at the indicator used on the H4 interval on the same instrument. At first glance, the signals are a little less, and the whole graph looks less chaotic. If we insisted on using the Fractal as the only tool on the chart, we recommend using it at higher intervals. It is true that the creation time will be much longer, but fewer signals are easier to filter and analyze.
Fractal + moving averages
There is a widespread belief that the simpler the investment strategies, the more effective they are. Moving averages are one of the simpler tools. Averages are often used in a variety of strategies, both swing trading and daytrading. Regardless of whether it is EMA or SMA, we use them (de facto we draw signals) in a similar way. We can base on the intersections of two or more averages or lead positions in their direction, according to the prevailing trend.
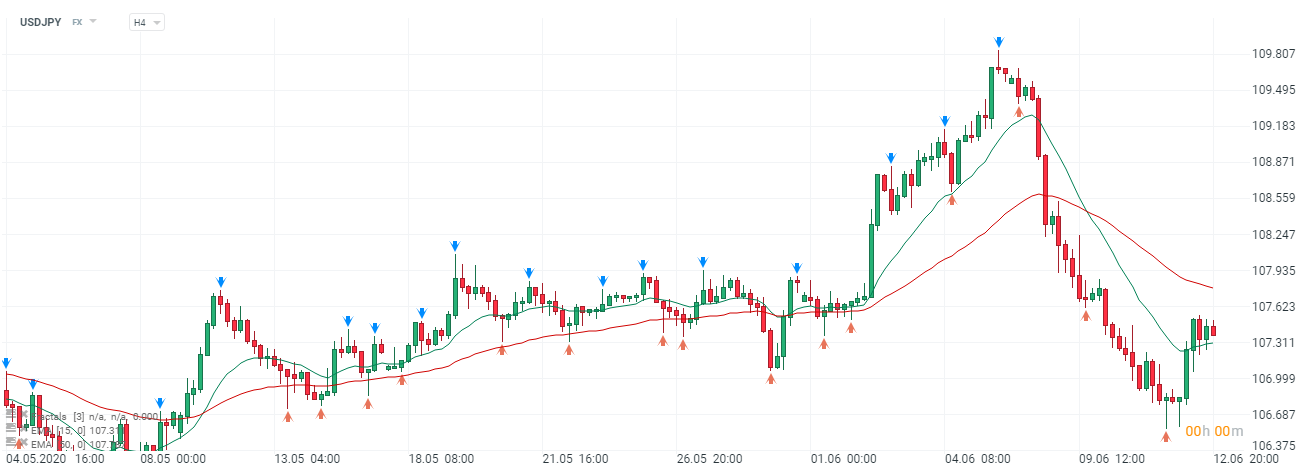
Fractal indicator in combination with moving averages on the platform xNUMX XTB xStation.
Looking at the chart above, it looks a bit more "overwhelmed". Averages determine the direction of the price movement, therefore the periods of consolidation and the Fractals formed on their occasion can be treated as a place of sale / purchase in the prevailing trend.
An interesting idea when our broker is XTB, there will be a drawing in the places of the created horizontal line fractal. Thanks to this, we gain space in the form "Little support / resistance"that supports trend-based strategy. We run it on average, and the Fractal filters us in places where we can increase our position or simply follow price behavior.
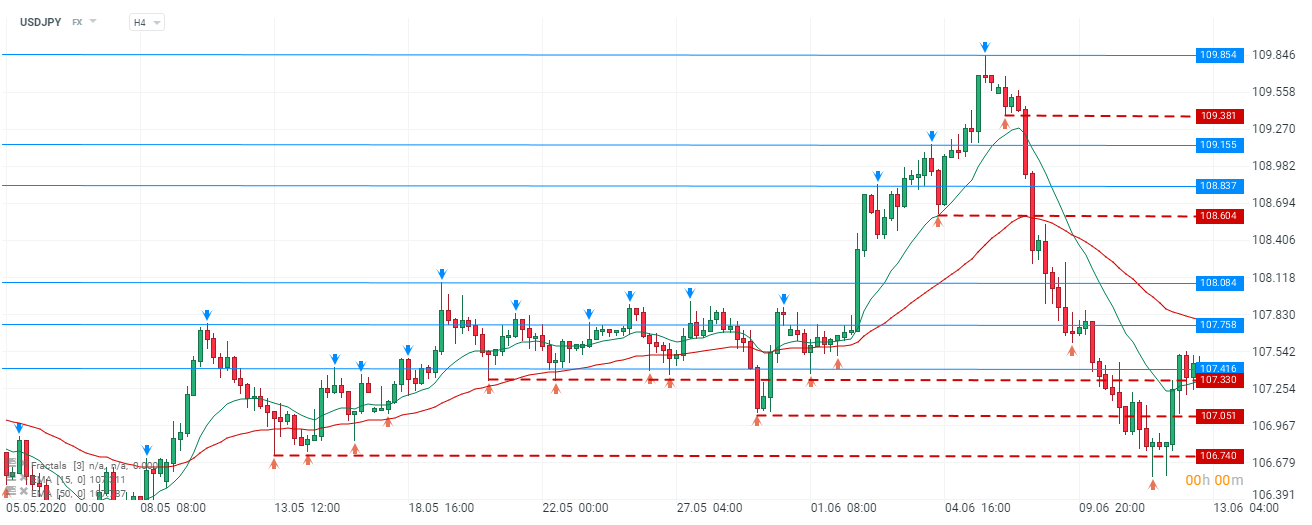
Fractal indicator in combination with horizontal lines on the platform xNUMX XTB xStation.
The first thing that can be noticed is a large number of horizontal "dashes", which makes the chart unreadable at the first attempt. We marked growth fractals with blue lines, whereas decreases with red lines. When breaking through the levels of support and resistance determined in this way, we can follow the trend. What's more, when it changes, fractals generate forward signals. In this situation, however, it is worth caution, because not every move that pierces the downward signal generated in this way must suggest a reversal of the trend. It is extremely important to observe previous behavior of the price or, for example, recently tested high (in the case of an upward trend).
Bill Williams investment strategies
One of the most popular fractal applications is to use it with another indicator created by Bill Williams called Alligator. At first glance, it looks like moving averages, more smooth and structured than ordinary EMAs. In fact, the Alligator is three moving averages, simple (SMA), shifted 8, 5 and 3 periods forward, respectively. Each one has its own name, referring to the animal. We stand out in the ribbon jaw (SMA 13 - min and max, shifted by 8 candles), in order to (SMA 8 with min and max, shifted by 5), lips (SMA 5 with min and max, shifted by 3 periods). Added on the chart look like this:
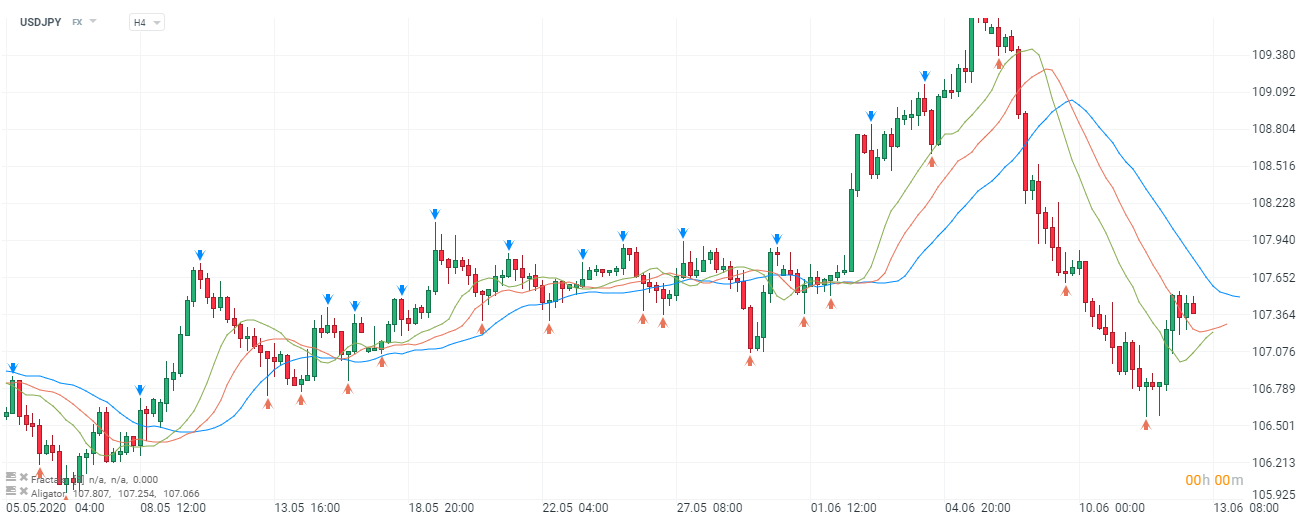
Fractal indicator in combination with the Alligator indicator on the platform xNUMX XTB xStation.
Signals flowing from the use of the Alligator can be read like those flowing from the use of ordinary averages. There are also strategies that preclude opening a position, be it buy or sell, when the Fractal is created e.g. outside of the Alligator's jaws. However, these are strictly personal transaction systems that use many of their own assumptions. Considering only the standard Alligator analysis, we should focus on analyzing its three phases (sleeping, hunger and satisfaction). These phases illustrate consolidation, breaking out and trend change. It is therefore possible to use Fractals as certain levels, even price channels, the breaking of which can be a confirmation of specific phases.
Investment strategies - Summary
Certainly, the possibilities of using Fractals we have mentioned are not the only options to use them in transactional systems. There are many combinations that can be supported by oscillators. The range of possibilities is therefore really wide and it is entirely up to us whether we want to enrich our strategy or improve it with the help of the technical analysis tool, which is the fractal.


Leave a Response