


US inflation scared the markets, but not the stock markets

Despite strong gains in the equity markets during the week (it was similar in the previous week), the shares finally returned to the low of the current cycle. The ever stronger dollar makes itself felt in the form of mounting tensions in the financial markets (currency interventions in Japan, defense of the weakening forint by the Hungarian central bank, or dollar-denominated liquidity loans taken by the central bank of Switzerland at the US central bank FED). And on top of that, inflation readings are above expectations.
A new hole on the S & P500
The main one in the past week S & P500 stock index marked a new low this year. According to Wednesday's closing prices, the decline from the bull market was -25,4%. At the same time, on Thursday after the publication of the US consumer inflation data, the S & P500 plunged around 2% to levels below 3500 points (closing at this level would mean a decline from the boom of 27,0%). Fortunately, we had a 5% increase from Thursday's lows to the day's close. These "things" can happen in a bearish market. Let me just remind you that the bearish upward corrections may reach even more than a 20% rebound. And changes in one day ... even more than 16%! On Wednesday, January 3, 2001, the Nasdaq Composite stock index rose by 16,2% from lows to the close! The day before, it marked a low in the bearish market. What was the reason for such a strong rebound? Let's treat it as an interesting puzzle - the answer can be found in the "Summary".
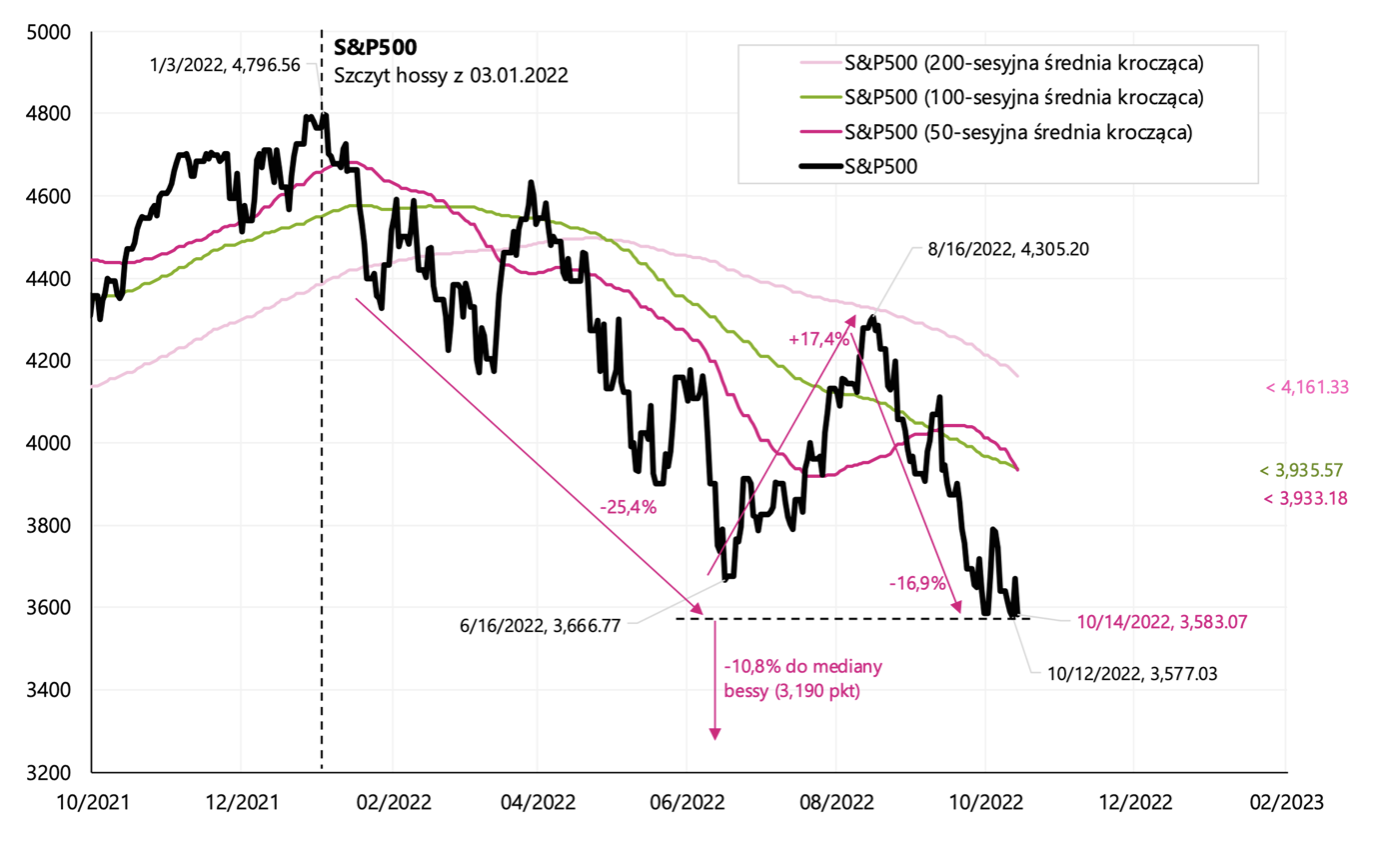
S & P500 index in 2022. Source: own study, Stooq.pl
The strong rebound of the S & P500 lasted only for one day. On Friday, the market closed only 0,2% above the low of the cycle set two days earlier. Let's take a look at the chart showing this year's decline in the S & P500 against the previous bearish markets. We are slowly approaching both the median size of declines from the peak of the bull market and the median length of the bear market (calculated in calendar days).
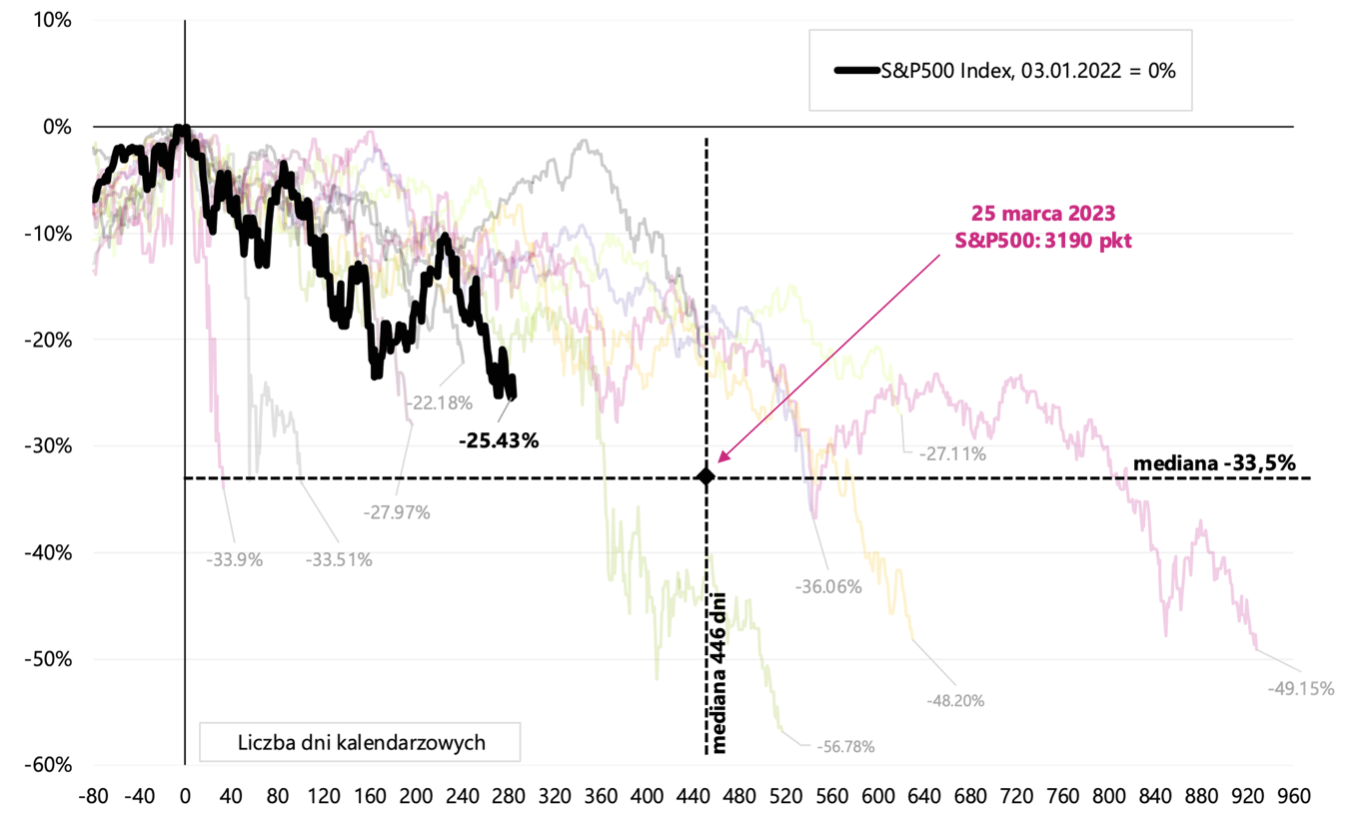
The size of the decline in the S & P500 in 2022 against the background of historical bear markets (from 1948). Source: own study, Stooq.pl
The situation for the technological index is also interesting Nasdaq Composite on an identical chart. In the case of this index, we are already below the median of declines and much closer to the median length of the bear market (it falls on 1 December this year). The close on Friday marked a new low on this index in the current cycle.
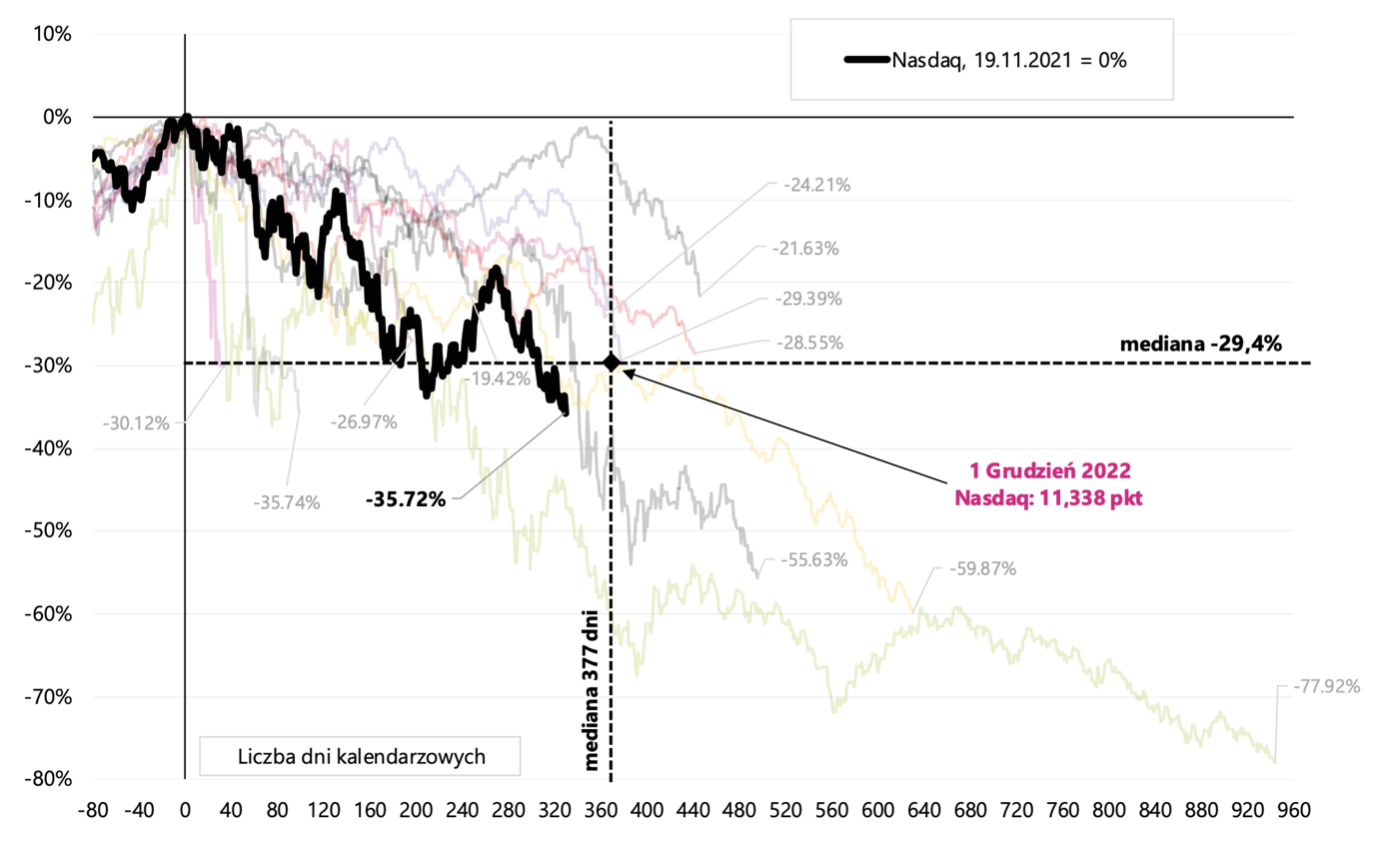
The drop in the Nasdaq Composite in 2022 against the background of historical bear markets (from 1948). Source: own study, stooq.pl
Stock markets are cyclical and declines are followed by increases. Nobody has a glass ball and each cycle can be different, but historical comparisons can also be one of the many clues to increasing the amount of stocks in our portfolios during a bearish market. At least from a historical perspective, the greater the drops and the longer they last, the closer we are to the bottom. An example of how to use the historical analogy is presented in the next chart.
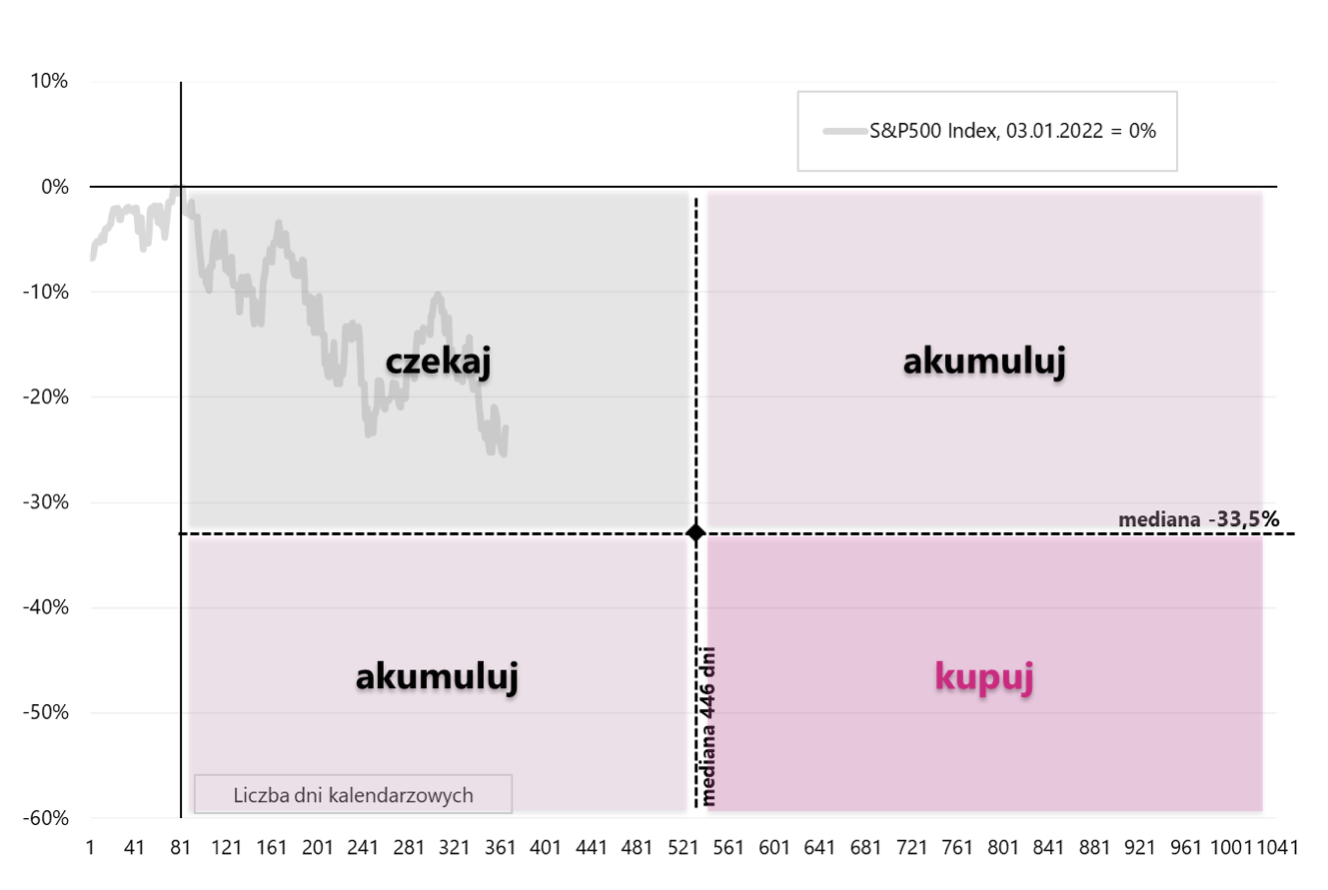
An example of how to use historical bear markets (breakdown into medians). Source: own study.
US inflation scared the markets, but not the stock markets
Another inflation reading in the US (for September this year) and again above market expectations. The reaction of the markets was unequivocal, at least initially. Then the stock market decided to rise sharply and the S & P500 closed the day with over 5% increase from the lows immediately after the publication of inflation data. However, a day later there was not much left of these increases. As a result of higher inflation, the market also raised its expected target interest rate Fed by about 0,3 percentage points up to 4,9% (in April 2023). It is not much less than in Poland today!
What unpleasantly surprised markets with US inflation? Especially those components that are the most persistent ("sticky") and it is very difficult to cause them to drop once they start to grow. We are talking about core inflation, and within it, about services. We discussed the composition of the basket in another reportbut in terms of services, the largest item is "Shelter" (items related to renting a flat), whose share in the entire basket is about 32%. In September this year. Shelter grew by as much as 0,75% (a record in this cycle).
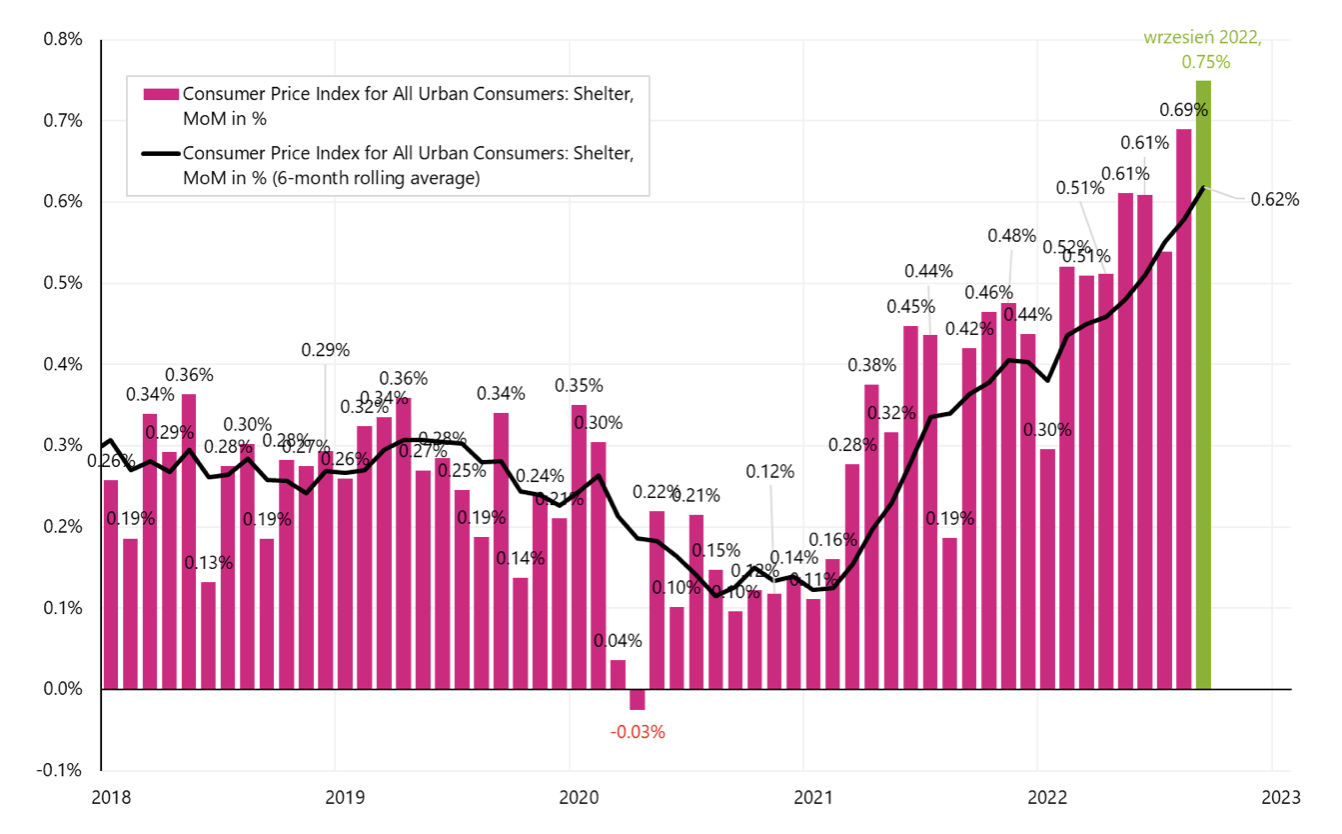
Monthly US Shelter Inflation Movement and 6M Moving Average (seasonally adjusted series). Source: own study, FRED
There are also the first positive news in the US inflation. Durable goods within core inflation (21% of the entire basket) did not change in September (for the first time in 5 months, this component has not increased). Additionally, in September this year. according to data Redfin we had the first monthly decline in the average rental price in the US in a long time (-2,5% to the level of USD 2), and in addition, the annual dynamics has been falling for many months (fortunately, the "madness" on the rental market in connection with removals and remote work caused by the pandemic is already behind us). This bodes well for future Shelter inflation (practically the entire component is related to the cost of renting apartments). But the bad news is that it usually takes months to see the effect of falling market rental prices in the inflation data. But it's only a matter of time.
Inflation in the countries of our region
Last week we learned the inflation readings for September this year. for the Czech Republic and Hungary, and the final lecture in Polandwhich confirmed quick respect of 30.09/XNUMX. In all countries, inflation turned out to be higher than expected. So let's check how exchange rates reacted to inflation readings, and then how some central banks reacted to exchange rates.
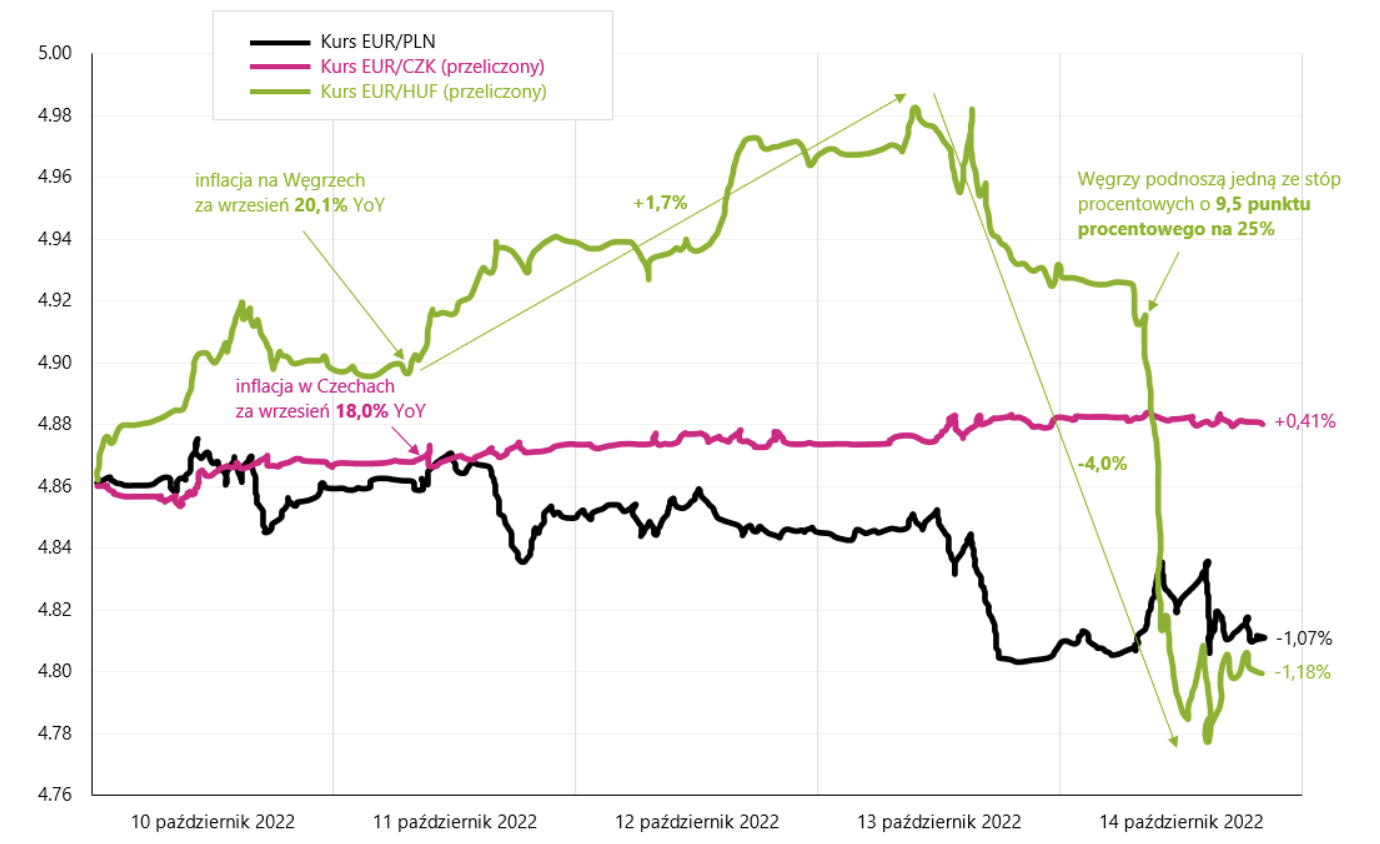
Change in exchange rates of the Czech Republic, Hungary and Poland in the past week. Source: own study, Stooq.pl
After reading inflation, the Czech koruna only slightly weakened in the following days. However, in Hungary after announcing inflation above 20%, the forint depreciated by 3% against the euro for the next three days (in total, since June 2021, it has already weakened by over 22%). This turned out to be too much for the Hungarian central bankwhich on Friday at an unscheduled meeting raised one of the interest rates (secured O / N loans) by as much as 9,5 percentage points from 15,5% to 25,0%! He made this move to defend the weakening forint, which at least for today brought the intended effect of strengthening the forint by about 2,55%. But looking from a longer perspective (e.g. from the beginning of the rate hikes cycle), this is a slight strengthening. This is shown in the next chart.
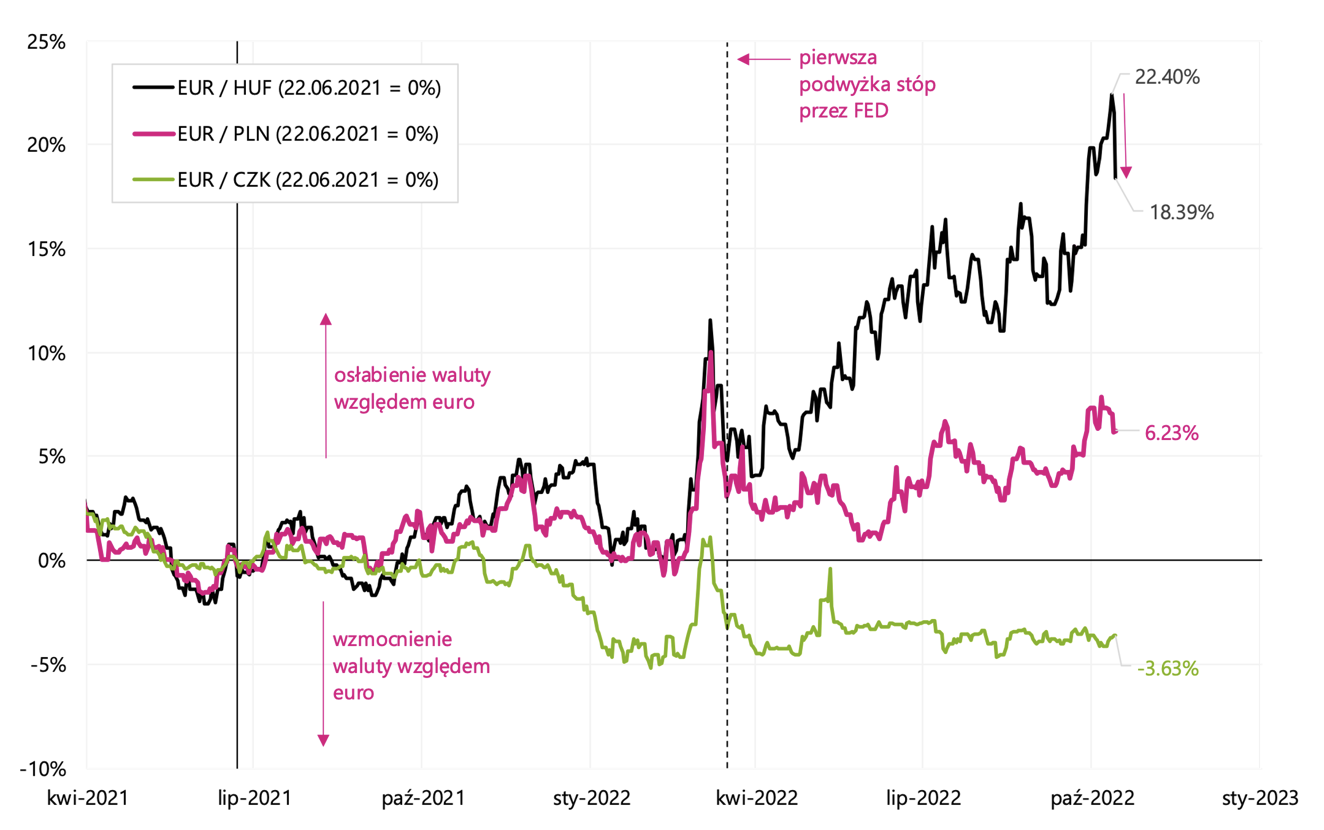
Change in the exchange rates of the Czech Republic, Hungary and Poland since the first interest rate hike in the region (June 2021). Source: own study, stooq.pl
Was it an effective intervention? We will see in the next and subsequent weeks, but if we look at, for example, the effects of the recent intervention of the Japanese central bank (similarly, it was about stopping the fall of the yen), the intervention lasted only for less than 3 weeks.
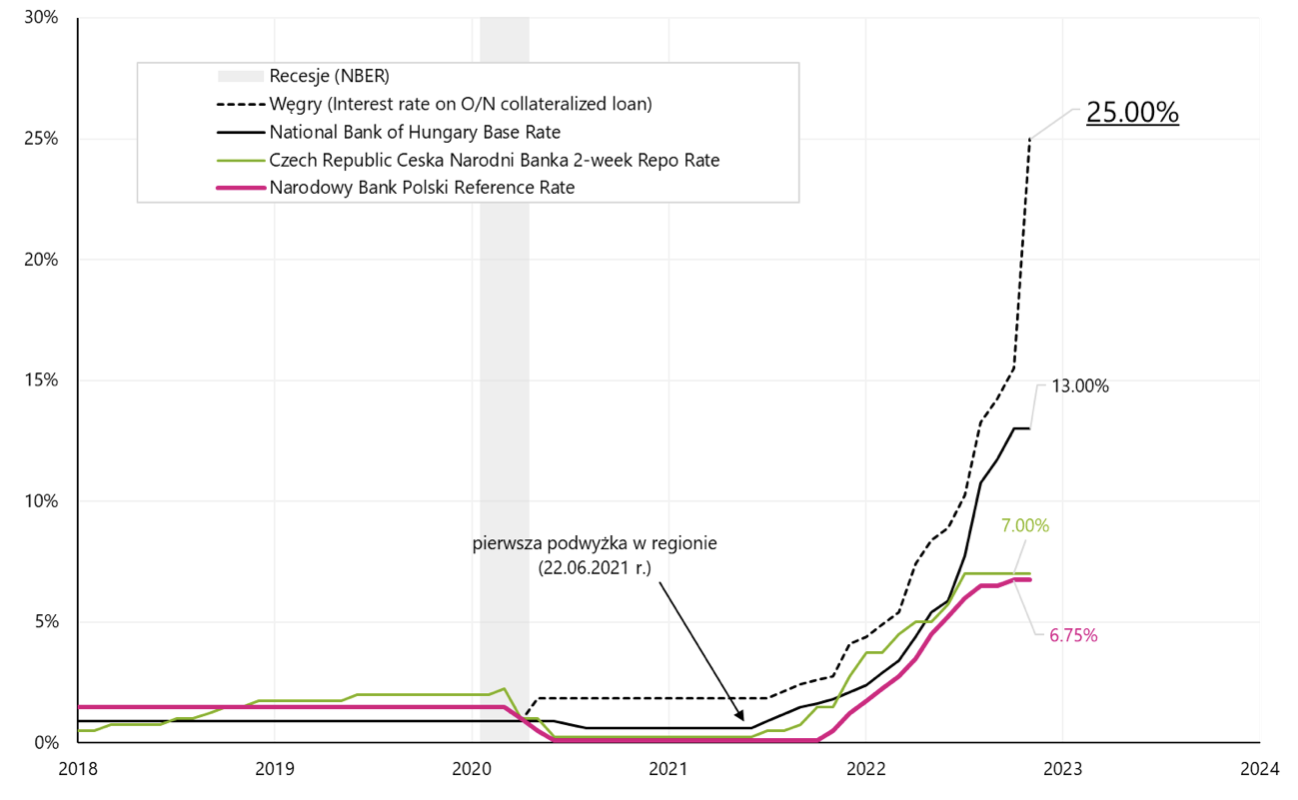
Main interest rates in Poland, the Czech Republic and Hungary. Source: own study, stooq.pl
Problems with the availability of dollars - the Fed helps
In the conditions of the global slowdown, the struggle of central banks with inflation and raising interest rates (including relatively stronger by the US central bank FED) and the increasingly stronger dollar - the effect is one ... slowly begins to "run out" of dollars. More specifically, cheap dollar financing that may be needed to serve both the real economy and finance positions in the financial markets. In these situations The Fed lends dollars to other central banks (these are the so-called "dollar liquidity swaps"). This is, of course, a signal of mounting tensions in the global financial system. In the past two weeks, the Fed first lent USD 3,1 billion to the Swiss Central Bank (SNB), which was increased the following week to USD 6,27 billion. Someone in Switzerland needed the central bank's help to get short-term dollar funding. Interestingly, this is the highest single amount granted to the SNB in recent years.
Generally, these amounts are not high yet and at the moment they concern one country, but it is worth monitoring them for further growth and also for other central banks. Historically, the largest US dollar loans were made by the Fed during the recession. The chart below shows the total of the Fed's liquidity loans to other central banks.
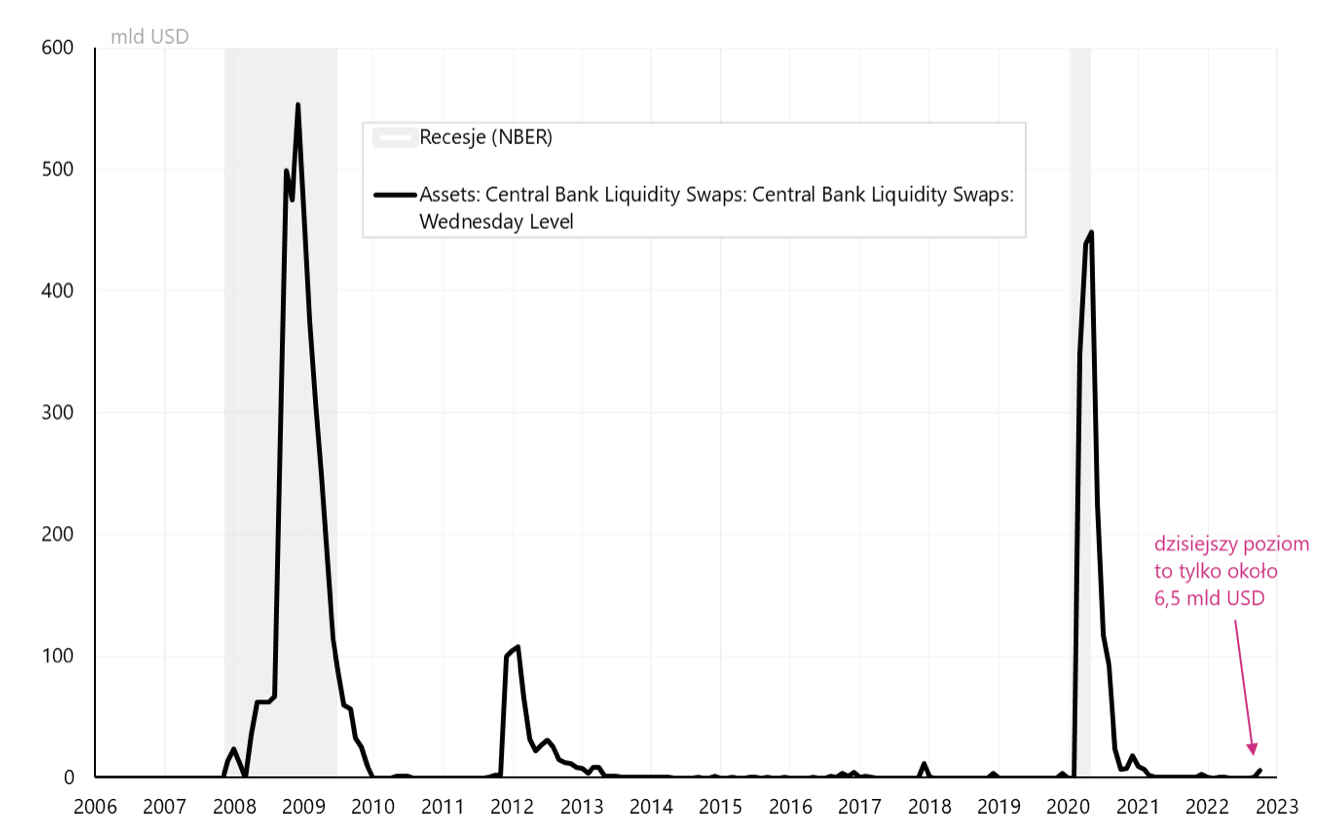
Level of liquidity dollar swaps (short-term dollar loans) extended by the Fed to other central banks. Source: own study, FRED, Federal Reserve Bank of New York
Summation
First, the promised solution to the puzzle of January 3, 2001. Probably some guessed ... that it was the reason for such strong gains unexpected cut in interest rates by the US central bank FED at an unannounced meeting. It is very interesting from today's perspective when the market "lives" with the narrative of changing the Fed's policy (the so-called "pivot"). I recommend that you read the summary of the day on Wall Street at the link above. The market would like to receive exactly the same gift from the Fed today! Nevertheless, it should be noted that in January 2001 it was still a long way from the bear market.
Inflation readings in the US and in our region for September this year. unfortunately they were above expectations. Though in the US, falling market rental prices bode well for inflation in the coming months.
However, from our perspective, the situation in Hungary may be disturbing, where the central bank launched a vigorous defense of the forint by raising one of its interest rates to a fairly high level of 25%.
Disclaimer
This document is only informative material for use by the recipient. It should not be understood as an advisory material or as a basis for making investment decisions. Nor should it be understood as an investment recommendation. All opinions and forecasts presented in this study are only the expression of the author's opinion on the date of publication and are subject to change without notice. The author is not responsible for any investment decisions made on the basis of this study. Historical investment results do not guarantee that similar results will be achieved in the future.
About the Author
 Jaroslaw Jamka - Experienced fund management expert, professionally associated with the capital market for over 25 years. He holds a PhD in economics, a license of an investment advisor and a securities broker. He personally managed equity, bond, mutli-asset and global macro cross-asset funds. For many years, he managed the largest Polish pension fund with assets over PLN 30 billion. As an investment director, he managed the work of many management teams. He gained experience as: Member of the Management Board of ING PTE, Vice-President and President of the Management Board of ING TUnŻ, Vice-President of the Management Board of Money Makers SA, Vice-President of the Management Board of Ipopema TFI, Vice-President of the Management Board of Quercus TFI, Member of the Management Board of Skarbiec TFI, as well as Member of Supervisory Boards of ING PTE and AXA PTE. For 12 years he has specialized in managing global macro cross-asset classes.


