are recording the largest daily outflow of funds in history")


Rebound on the oil market or maybe a change of trend?

Brent oil prices are back above $77 a barrel after ending the longest streak of declines in half a decade last week. Currently, oil prices are supported by Russia's decision to limit oil production and concerns about the possibility of disruption of the transport of this raw material through the Red Sea.
Trend correction or change?
In monday morning Petroleum Brent cost $77,18 per barrel, rising 4. Another day after last Wednesday, the price of this raw material dropped to $72,43 and was the lowest since the end of June this year. and $24 lower than at the end of September, when the oil market marked its last local peak.
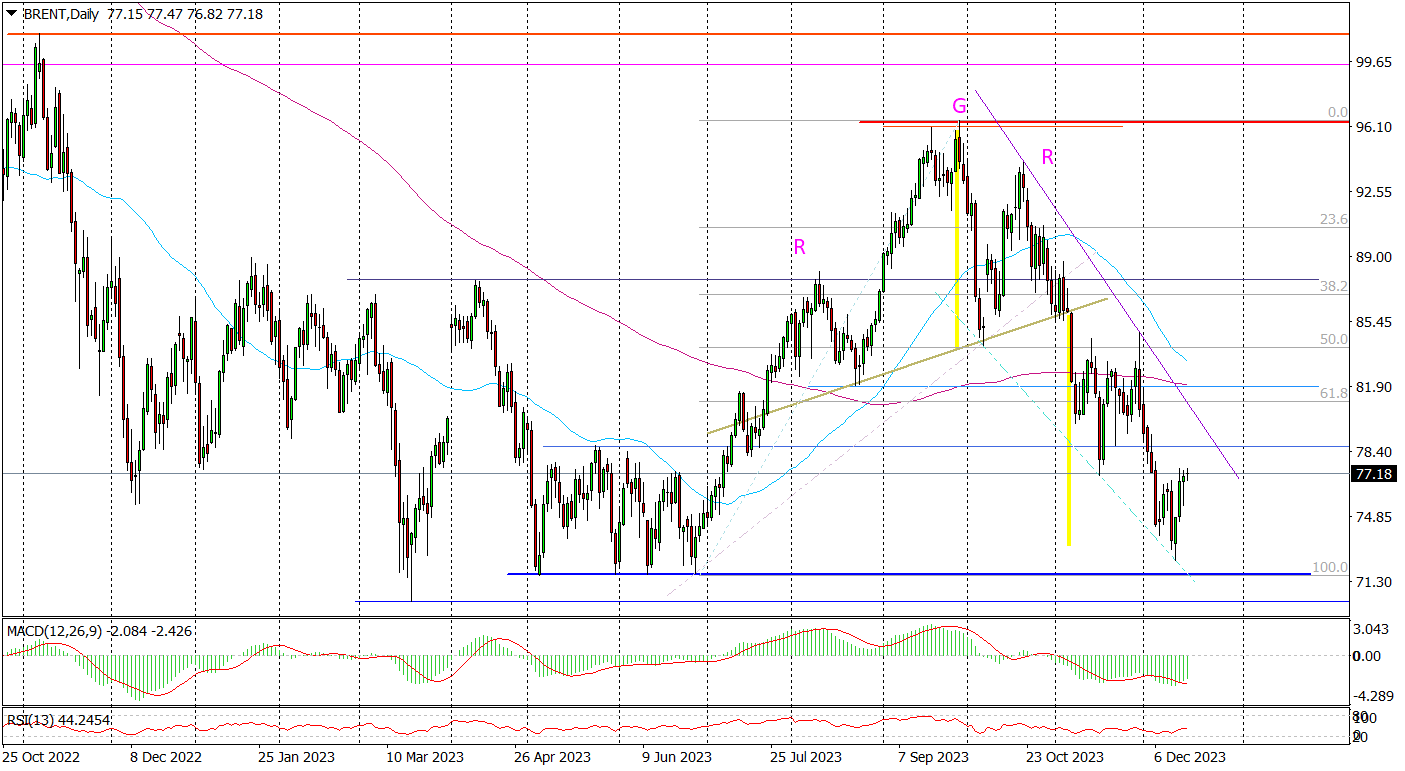
BRENT crude oil daily chart. Source: Tickmill
Currently, oil prices on global markets are supported by Russia's Sunday decision to limit oil exports by an additional 50 tonnes. barrels per day or more.
The second factor influencing the increase in oil prices are concerns about the transport of this raw material through the Red Sea, after the Danish container company Maersk announced over the weekend that it was suspending the movement of its ships through the Red Sea due to the latest series of attacks on ships carried out near Yemen by the Yemeni Houthi movement.
Last week, oil ended a seven-week losing streak, the longest such period in half a decade. Since the end of September, when oil prices reached their local peak at $7 per barrel, oil has become cheaper in total by as much as $96,44, which has increased hopes for the acceleration of disinflationary processes in the global economy, while contributing to the acceleration of the global boom observed in recent weeks. stock exchanges.
Oil prices are rising for the 4th consecutive day today
The current situation on the daily chart does not yet provide a clear answer as to whether the observed increases are just an upward recovery from declines or a change in the trend. However, it can be clearly stated that the declines are already behind us. This thesis is supported not only by the realized head and shoulders formation (RGR), but above all by the proximity of the very important support zone of $71,61-71,72, which is formed by the four lows from May and June this year. Breaking it would require the emergence of new strong supply impulses, and so far there are no such impulses. Moreover, the hammer candlestick pattern drawn last week on the weekly chart of Brent crude oil directly suggests that this is the end of the decline.
The end of declines does not mean the beginning of increases. At least not in terms of technical analysis. Such signals are still missing on the oil chart. The first timid signals appear on the indicators, but it is not enough to expect a strong upward move. Therefore, until such signals appear, the most likely scenario for the oil market seems to be a repeat of its behavior from May-June, i.e. a sideways trend. It would be limited from the bottom by the zone of $72-73, and from the top by the levels of $78-80.