


Can the WIG20 increase by 3% in 60 months?

From October 13, 2022 to January 10, 2023 WIG20 increased by 43% – being one of the most growing stock indices in the world during this period. If we look at the dollar indices of Polish stocks, we are talking about even higher rates of return: iShares MSCI Poland ETF +60% (in the period from October 10.10.2022, 12.01.2023 to January XNUMX, XNUMX), and the index WIG20USD +63% (in the period from October 13.10.2022, 16.01.2023 to January XNUMX, XNUMX). The chart below presents a comparison of the rates of return for three indices of Polish stocks (expressed in both USD and PLN).
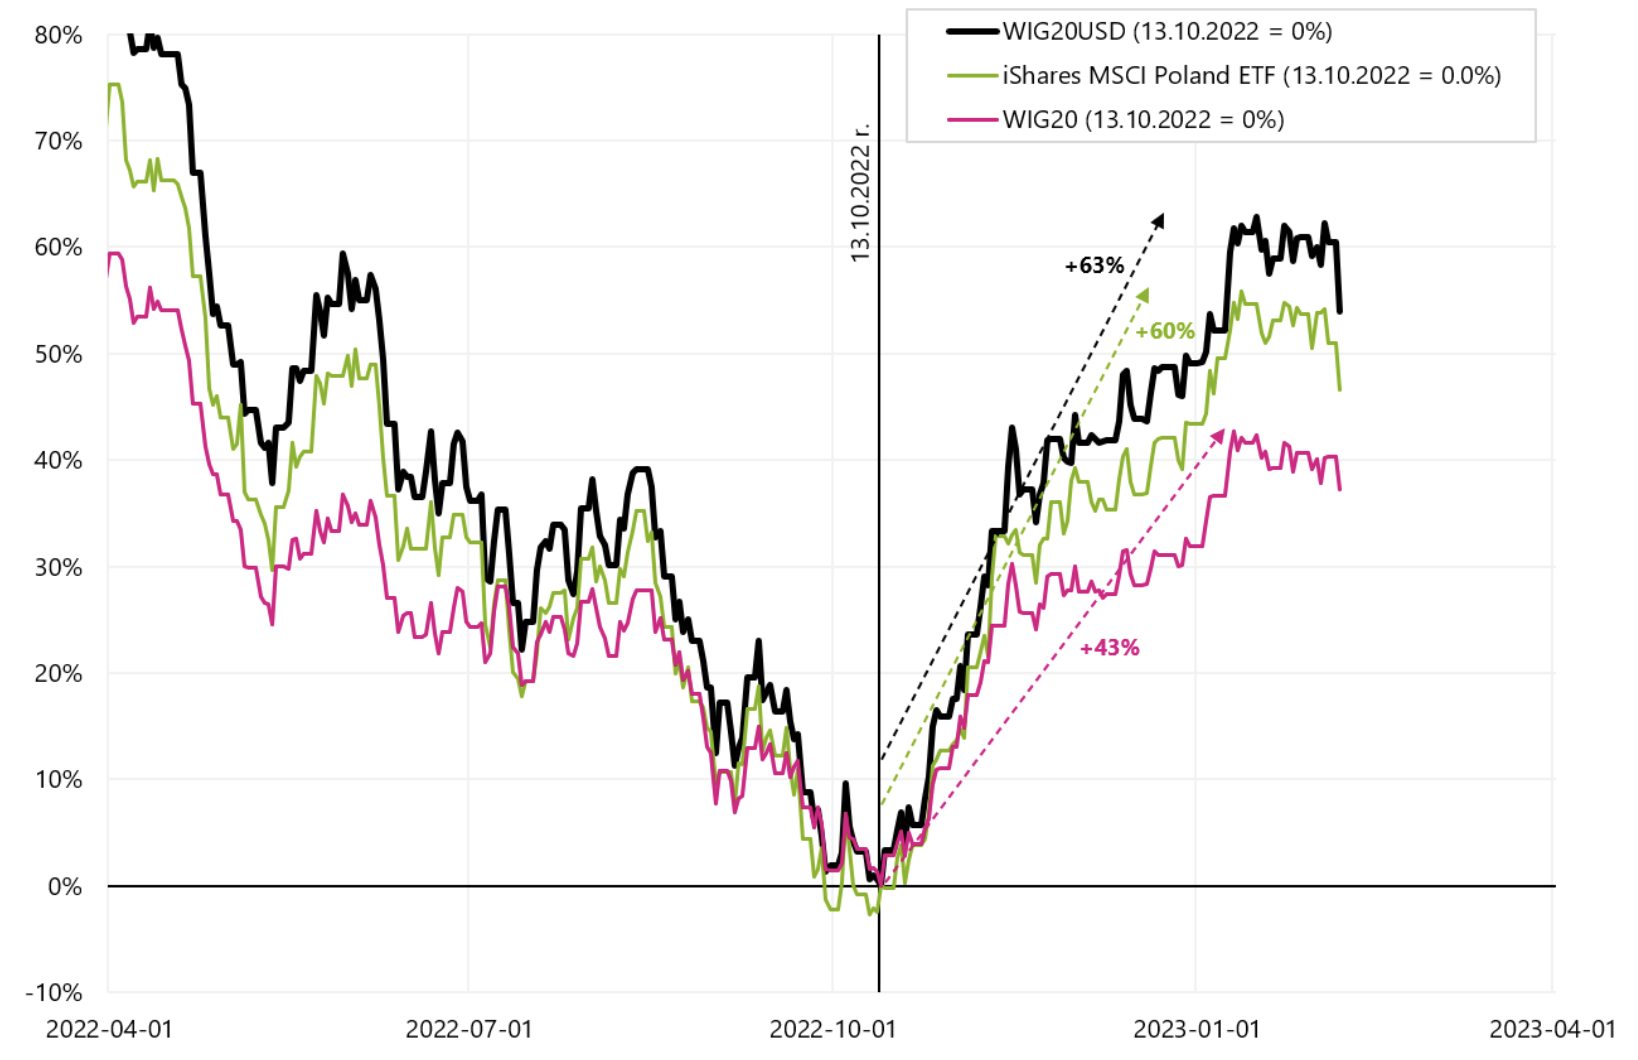
WIG20, WIG20USD and iShares MSCI Poland ETF until February 06.02.2023, XNUMX. Source: own study, ishares.com, stooq.pl
Below is a table with different rates of return indices i ETFs sorted by the last column, i.e. the period from October 13.10.2022, 16.01.2023 to January 20, 63, in which the WIGXNUMXUSD increased by XNUMX%.
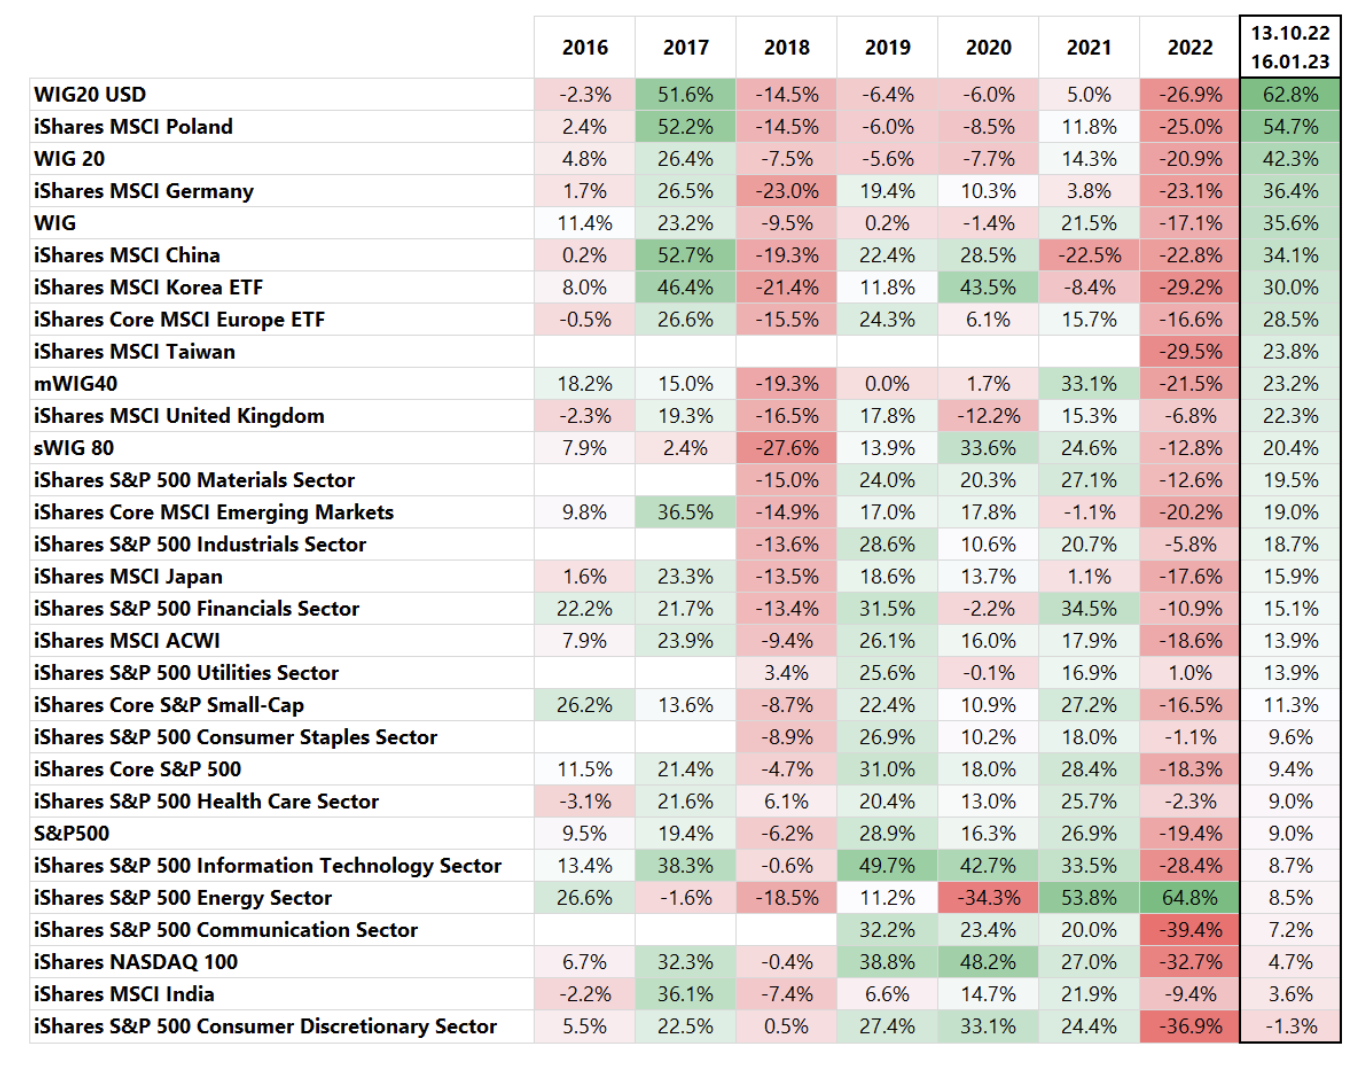
WIG20USD in the table above is the undisputed leader in terms of the rate of return. The comparison with the Nasdaq100 index (also expressed in USD) is also interesting, which increased by only 4,7% over the same period.
In this commentary we will try to answer the question why such high rates on Polish stocks are possible and when you can count on a repetition of such increases, i.e. under what conditions there is a relatively highest probability of a repetition of such strong increases in Polish shares.
Polish stocks in a global context
If we would like to look at Polish shares from a "bird's eye view" in a global context, several dimensions should be analyzed:
- Polish stocks (e.g. WIG20) vs the main American S&P500 index - what is the relationship and correlation between these indices,
- Polish stocks vs. the Emerging Markets country index, and
- Polish stocks vs US dollar or otherwise vs USD/PLN exchange rate.
This, of course, does not exhaust all dependencies and determinants of the behavior of Polish shares, but to a significant extent it allows us to look at the global context. Additionally, there are two more things to keep in mind:
- The industry composition of Polish indices, which consist mostly of the financial and energy industries, and
- Relatively low liquidity of the Polish stock exchange, which may result in greater volatility of Polish indices in the event of a significant inflow/outflow of funds from the Polish stock exchange.
In order to quickly check to what extent individual indices and exchange rates are interdependent, we can calculate the correlation coefficient. The tables below present the correlation coefficient of the WIG20 and WIG20USD index with selected stock indices or ETFs (representing the relevant indices). In addition, we also calculated correlations with the USD/PLN exchange rate.
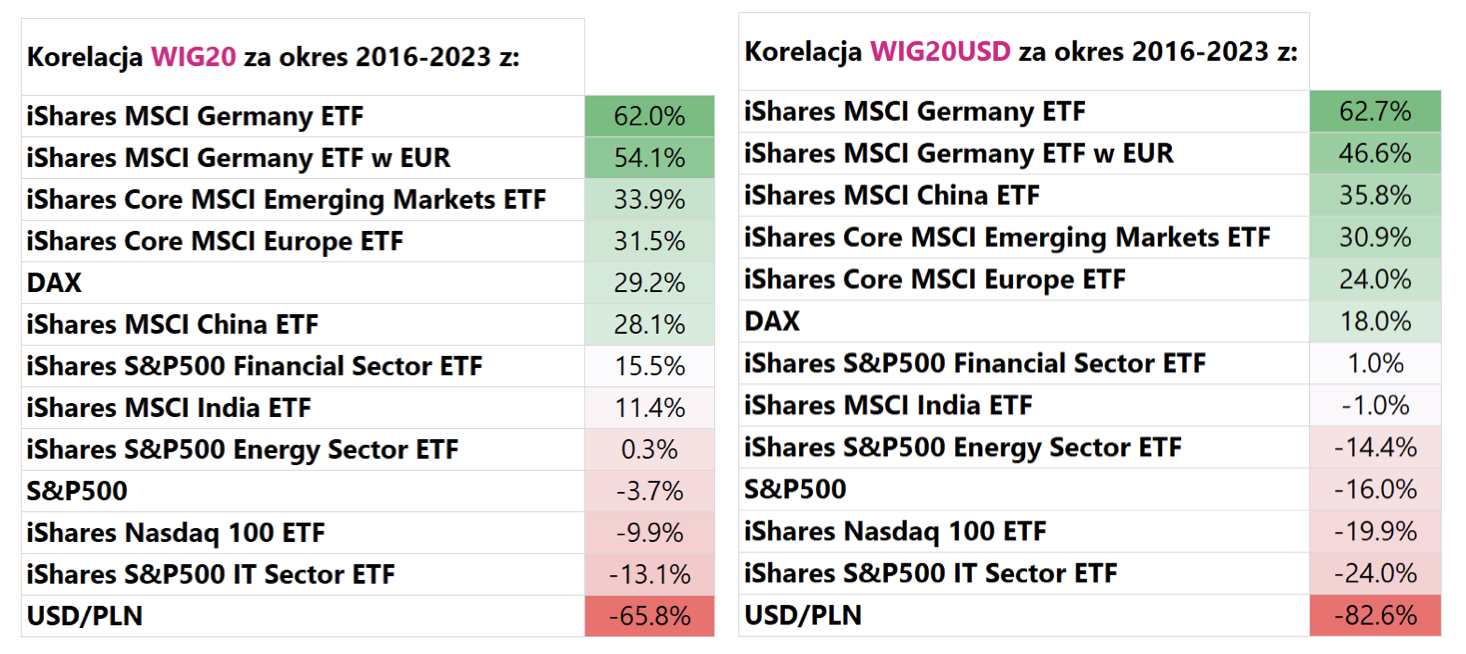
The largest positive correlation of WIG20 (and similarly WIG20USD) lists with the MSCI Germany, MSCI Emerging Markets, MSCI China and MSCI Europe index. Anyway, when we look at the rates of return (see the first table) for the period from October 13.10.2022, 16.01.2023 to January 20, XNUMX, the indices with the highest positive correlation with the WIGXNUMX are at the top of the table.
On the other hand, the WIG20 shows the greatest negative correlation with the dollar, i.e. with the exchange rate USD / PLN. Interestingly, there is "no" relationship between the WIG20 and the S&P500 (correlation around zero, slightly negative). The correlation was calculated based on daily index changes from January 5.1.2016, 6.2.2023 to February 7, 1770, i.e. over 20 years and over 500 data points. Of course, the close to zero correlation between the WIG7 and the S&PXNUMX does not mean that there is no correlation between Polish and American stocks "permanently". In fact, over shorter periods of time, this correlation may exist and, in fact, is constantly changing. Sometimes it is strongly positive, and sometimes it is negative - as a result of which it has been close to zero for the total period of the last XNUMX years.
How the correlation can change over time is shown in the next chart. In this case, we calculated a rolling correlation over a period of 3 years (in other words, each point in the graph shows the correlation between two data series over the last 3 years). The negative correlation between the WIG20 and the USD/PLN rate is the most "stable". In the case of the S&P500, the correlation (in 3 years) can vary from -40% to +80%.
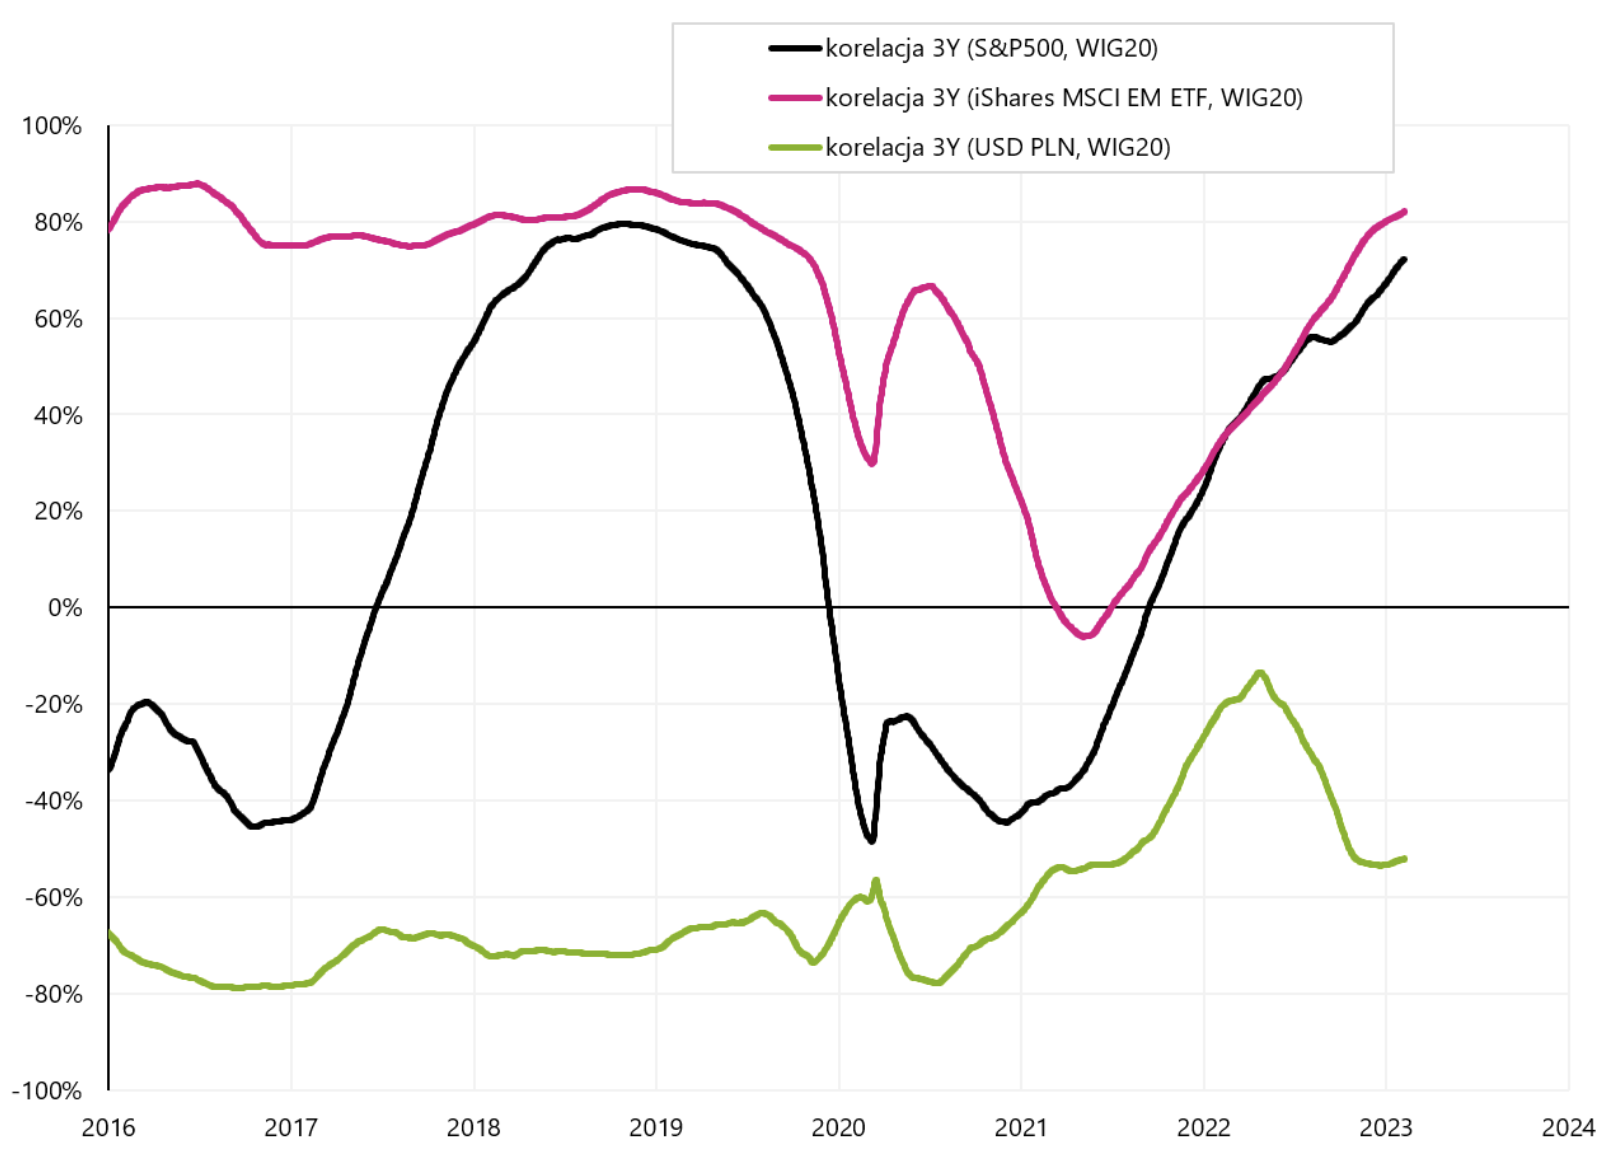
3-year rolling correlation between WIG20 and iShares Core MSCI Emerging Markets ETF, S&P500 and the USD/PLN exchange rate until February 06.02.2023, XNUMX. Source: own study, ishares.com, stooq.pl
In the next chart, we plotted all data points for the correlation between iShares MSCI Germany ETF and WIG20 from January 5.01.2016, 6.02.2023 to February XNUMX, XNUMX. The chart shows a clear positive relationship between these two indices.
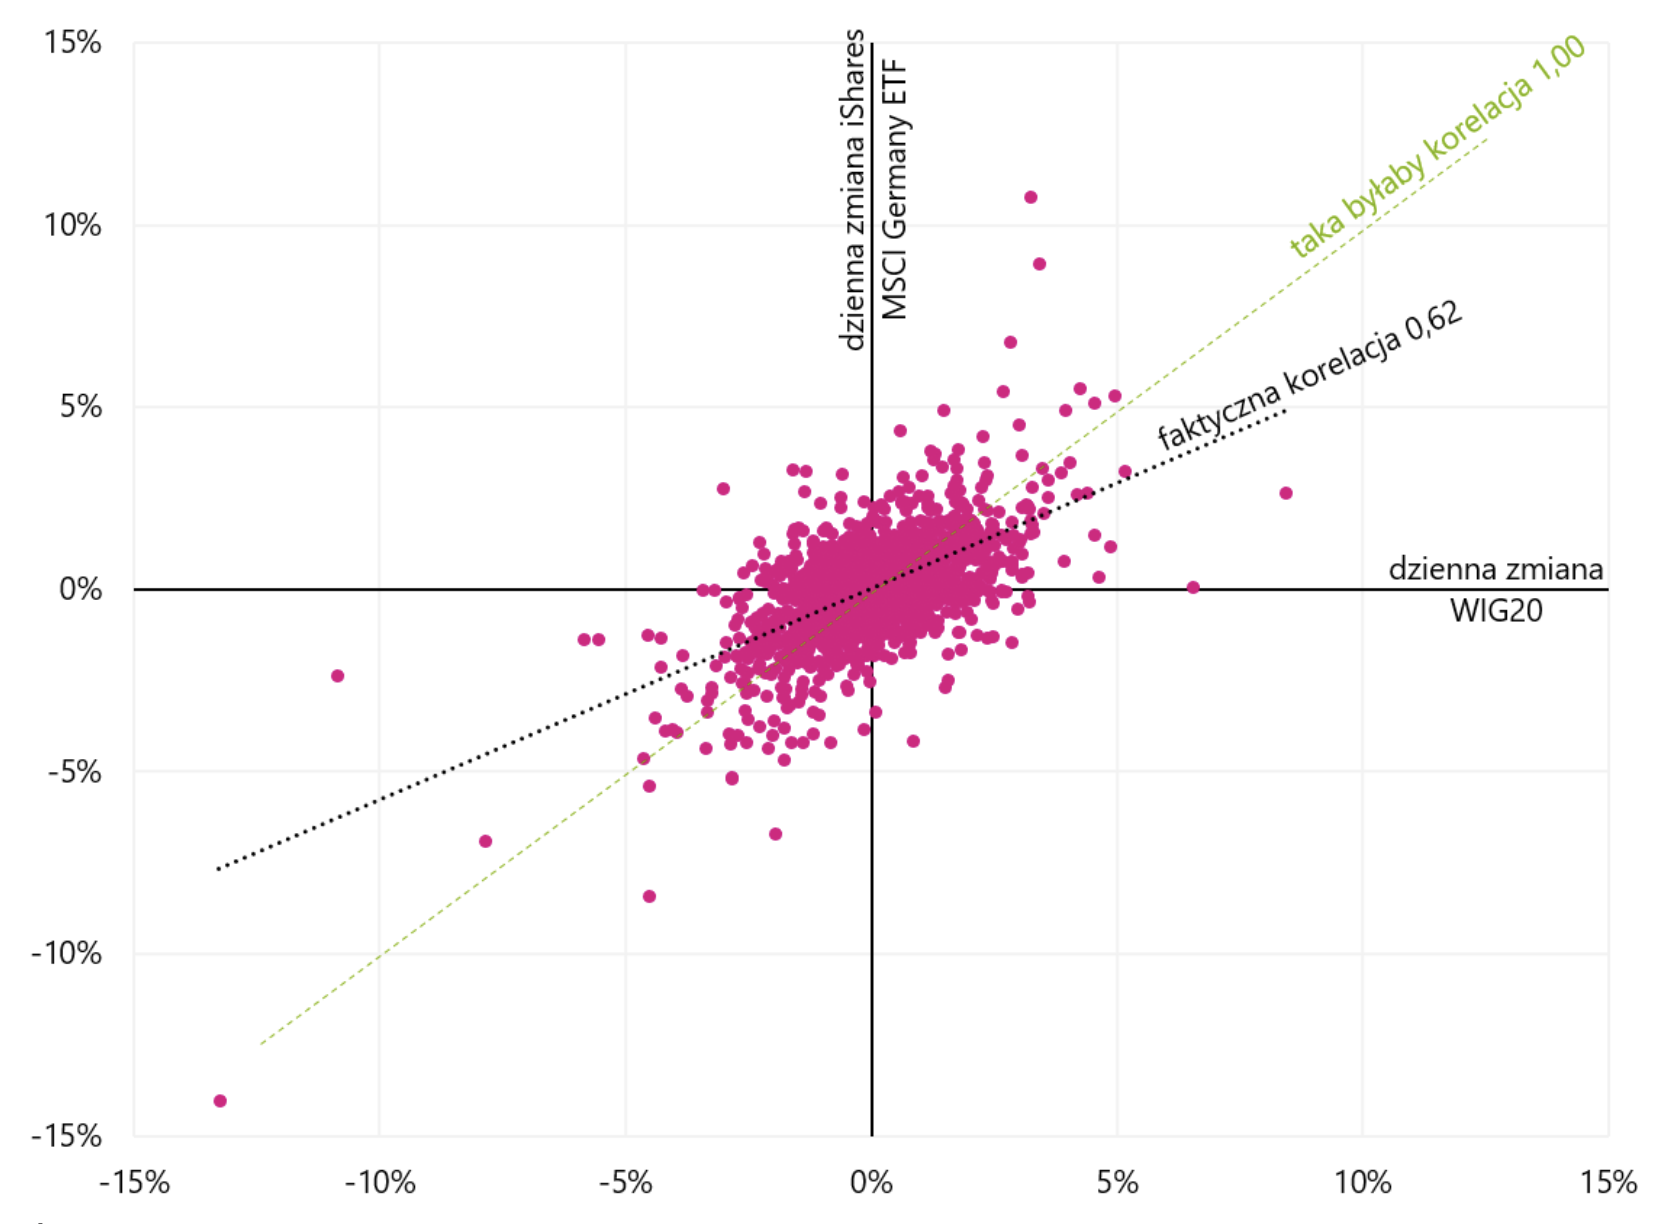
Correlation between WIG20 and iShares MSCI Germany ETF for the period 2016 to 2023. Source: own study, ishares.com, stooq.pl
Summarizing, WIG20 shows the greatest positive relationship with German, Chinese, European and Emerging Markets stocks - and the most negative with the USD/PLN exchange rate. Periods when the WIG20 is growing strongly against the background of other stock indices and countries, in the conditions of the weakening dollar, occur cyclically from time to time. After 2016, we can point to another such period, directly after Trump won the American presidential election in November 2016. From November 18, 2016 to January 23, 2018, WIG20USD increased by 89%, beating other global equity indices. For example, the S&P500 rose by "only" 30% over the same period. The chart below shows the growth of Polish indices in that period.
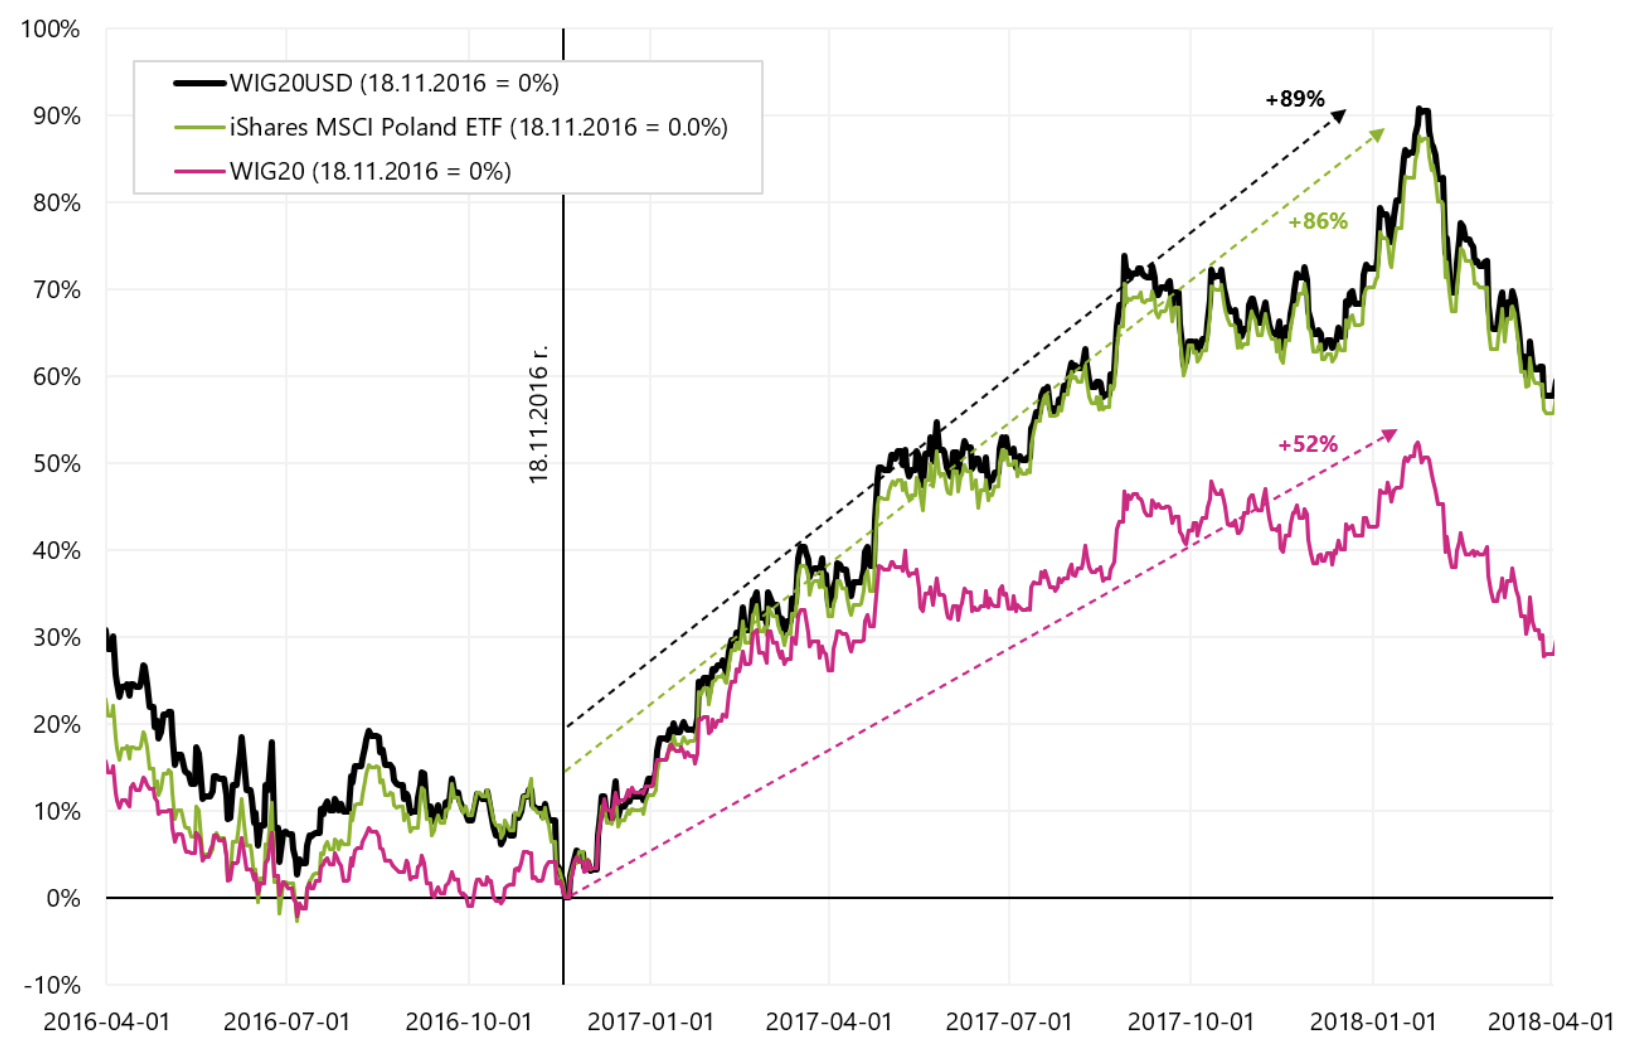
WIG20, WIG20USD and iShares MSCI Poland ETF from November 18.11.2016, XNUMX. Source: own study, ishares.com, stooq.pl
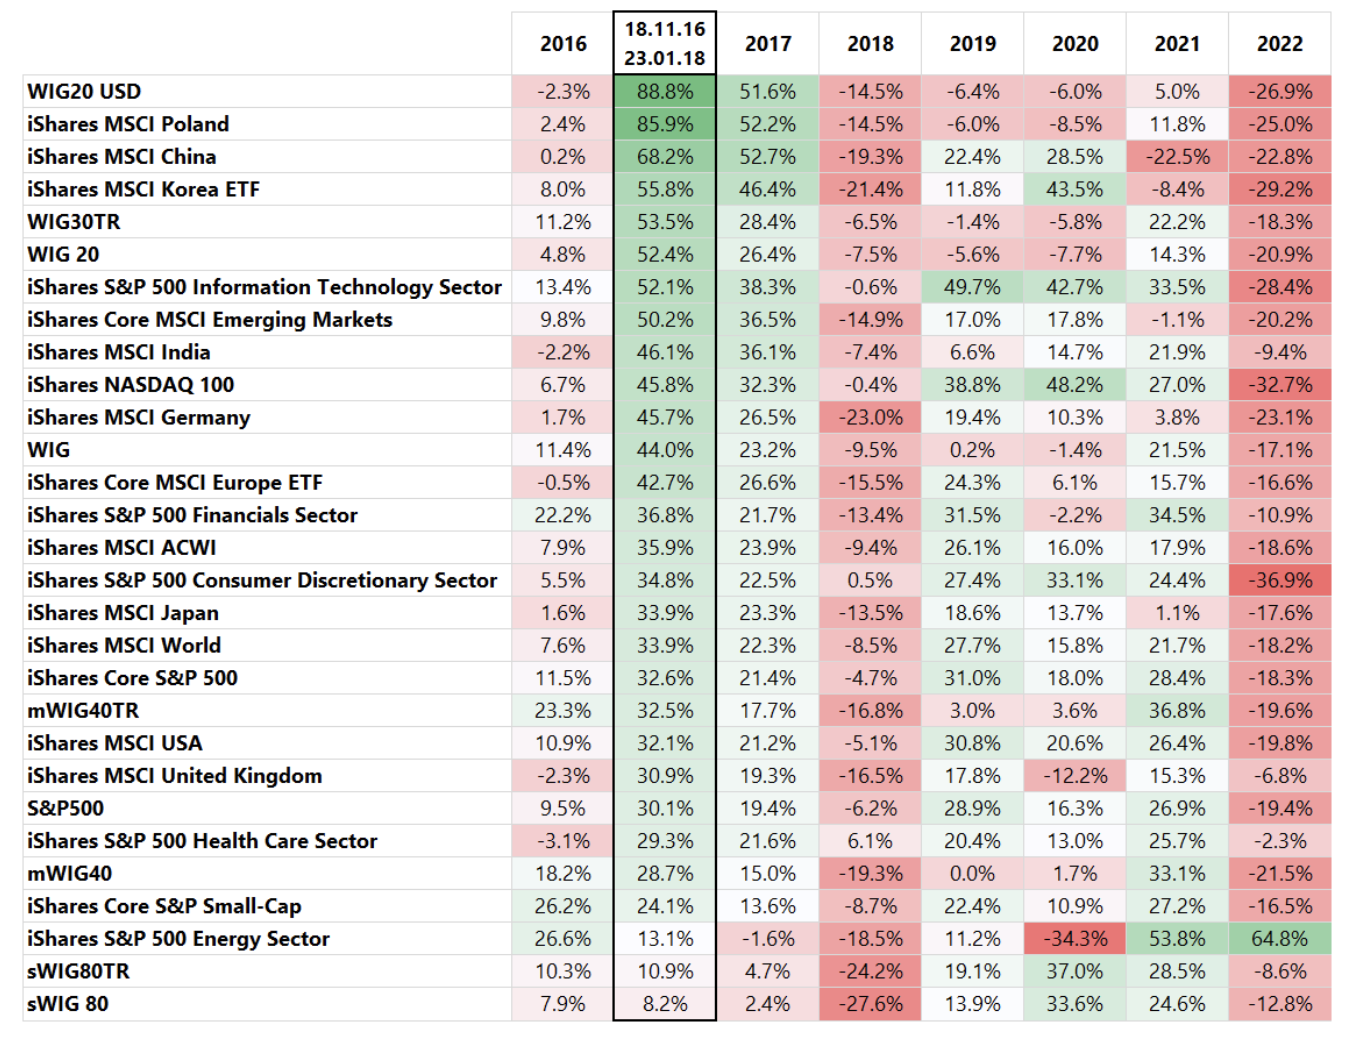
The table below presents a comparison of the rates of return on various indices and ETFs sorted by the rate of return from the period from November 18.11.2016, 23.01.2018 to January 2022, 2023. Interestingly, the highest places in the table for this period are generally occupied by the same countries as in October 2016 - January 2018, i.e. Poland, China, Emerging Markets, Germany and Europe. It should also be added that in both of the above periods we were dealing with a significant weakening of the dollar. From XNUMX to XNUMX EUR / USD exchange rate it moved from around 1,05 to 1,25 (over 20%). Currently, the EUR/USD rate has increased from 0,96 (September 2022) to over 1,10 in February 2023.
When can we count on repeating such rates of return on Polish indices?
Can the situation of strong increases in Polish indices be repeated in the future? YES. Because economies and financial markets are cyclical. Therefore, what conditions should be met to talk about the chances of such increases? While each subsequent cycle has the right to be slightly different, in an ideal scenario, the following conditions should occur in particular:
- We should be after a period of some kind of global slowdown, either a slowdown without recession (soft landing - as in the case of 2015-2016), or a slowdown with recession (hard landing - as in the case of 2009-2011),
- In such conditions, the dollar should be quite strong, ideally below 1,05 EUR/USD, and preferably even below parity (the lower the EUR/USD rate, the greater the chance of a stronger cyclical rebound in the next expansion),
- A pro-cyclical growth impulse is also needed, preferably also related to China. In addition, the (global) economy should start to accelerate, even generating some inflation impulse. This may also mean rising yields on (treasury) bonds and even interest rate hikes by central banks. But at this stage in the cycle, hikes tend not to hurt stock markets,
- With a strong economic recovery, including China's contribution, commodity prices may gain significantly (China is a large consumer of them), additionally supporting the Emerging Markets. Traditional export economies, such as Germany and Europe in general, benefit from economic recovery, including in China.
Of course, these are only general rules, and as we have already mentioned, each cycle can be governed by slightly different laws. In addition, as a rule, there are also other more "one-off" (i.e. not occurring regularly in the average cycle) factors affecting the economy and financial markets. For example, there are pandemics, wars, inflation (temporary or structural), low expenditure on exploration and extraction of raw materials and many other cycle-specific factors that must be taken into account when investing in financial markets.
Summation
Polish stock indices, especially those denominated in the US dollar, from time to time provide above-average rates of return, also compared to stock indices from other countries or regions. Why is this happening? For many reasons, mainly related to the cycles of the global economy and the way in which global financial markets work.
For example, in the case of iShares MSCI Poland ETF, we are talking about a rate of return of 60% for a period of 3 months (October 2022 - January 2023) and a rate of return of about 86% for the period November 2016 - January 2018.
Can such periods for Polish indices be repeated in the future? Definitely yes, because both economies and financial markets are cyclical. Economies sometimes slow down, sometimes they speed up. This is followed by a cycle of interest rate increases by central banks, followed by a cycle of their reductions. Inflation is similarly cyclical, as are financial markets or stock indices. But what is also very important, cyclicality works "both ways". Polish equity indices also have weaker periods as part of economic and financial cycles, during which the declines of these indices may be greater than on other equity markets.
About the Author
 Jaroslaw Jamka - Experienced fund management expert, professionally associated with the capital market for over 25 years. He holds a PhD in economics, a license of an investment advisor and a securities broker. He personally managed equity, bond, mutli-asset and global macro cross-asset funds. For many years, he managed the largest Polish pension fund with assets over PLN 30 billion. As an investment director, he managed the work of many management teams. He gained experience as: Member of the Management Board of ING PTE, Vice-President and President of the Management Board of ING TUnŻ, Vice-President of the Management Board of Money Makers SA, Vice-President of the Management Board of Ipopema TFI, Vice-President of the Management Board of Quercus TFI, Member of the Management Board of Skarbiec TFI, as well as Member of Supervisory Boards of ING PTE and AXA PTE. For 12 years he has specialized in managing global macro cross-asset classes.
Disclaimer
This document is only informative material for use by the recipient. It should not be understood as an advisory material or as a basis for making investment decisions. Nor should it be understood as an investment recommendation. All opinions and forecasts presented in this study are only the expression of the author's opinion on the date of publication and are subject to change without notice. The author is not responsible for any investment decisions made on the basis of this study. Historical investment results do not guarantee that similar results will be achieved in the future.


