


Trading on Undo and Playing Corrections - Part 2

After a long break, we continue the cycle in which we describe trading based on "pull backs" and price adjustments. In the first article we discussed what reversal is and presented one of the most popular techniques, namely based on breaking. More information can be found at the link below.
Read: Trading on Undo and Playing Corrections - Part 1
In the second part, we will go on to discuss other game techniques, such as horizontal reversals, based on averages, trend lines, or Fibonacci levels. I invite you to read.
Trend lines
Trend lines is another known "tool" that can be extremely helpful in corrections and their implementation. They generally have one drawback: they need more time to confirm. This is because by drawing a line on the chart, it should have a minimum of 3 contact pointsthat it could be considered confirmed. Of course, you can always simplify this technique a bit and combine, for example, 2 points, but in practice, the more confirmations, the better.
The most important rule is simple. If we want to play a correction taking into account the line, it is best to play the minimum undo at the third or fourth / fifth contact point.
Trendlines can work well with other methods of using corrections, but when used on their own, many trading opportunities can be missed - precisely by confirmation, which is usually time-consuming.
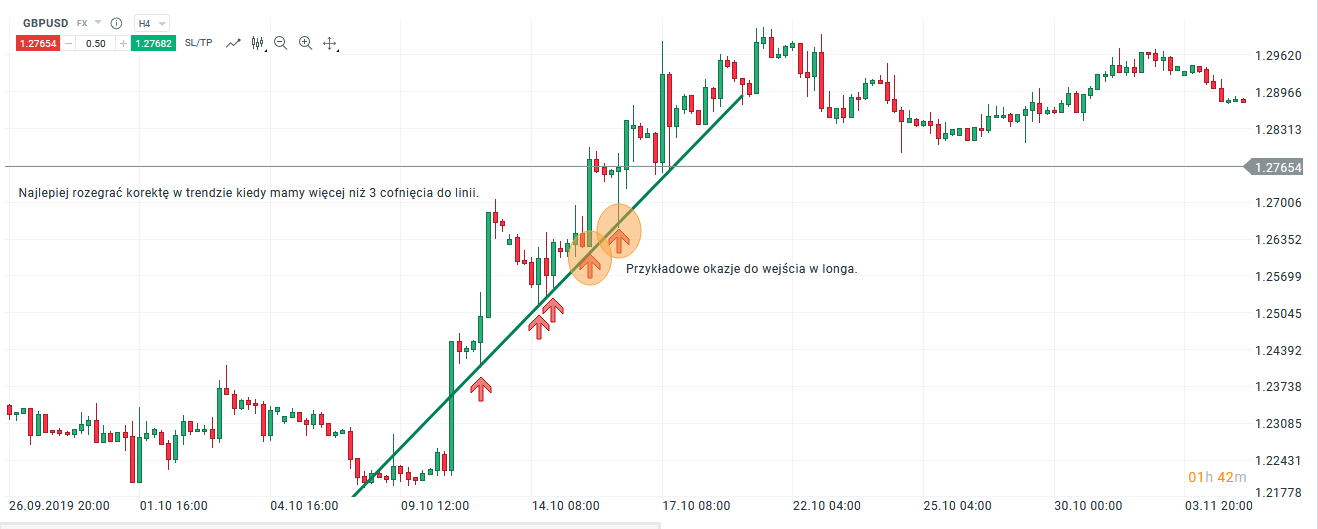
An example of playing a correction based on a trend line. Chart GBP / USD, H1 interval. Source: xNUMX XTB xStation
Horizontal steps
The so-called. stepwise price behavior can be observed during many phases of trends on the vast majority of instruments. It is a kind of natural price rhythm showing ebb and flow of individual behaviors (those who buy and those who want to sell).
During individual phases of trends, the price often moves in this type of formations. This undo approach is a great addition to the post-stamp corrections presented in Part 1. As a rule, we observe that reversing after breaking occurs very close to certain turning points. If the trader misses the first opportunity to enter the transaction, horizontal steps can be extremely helpful when looking for an alternative entry scenario, as the situation develops dynamically on a particular value.
The second use of this technique allows you to move the stop loss along with the trend in a safer way. In this case, we wait until the price takes the next step, and then move the rate beyond the last correction area. The order is then more protected and is not as susceptible to "cutting out" by the market.
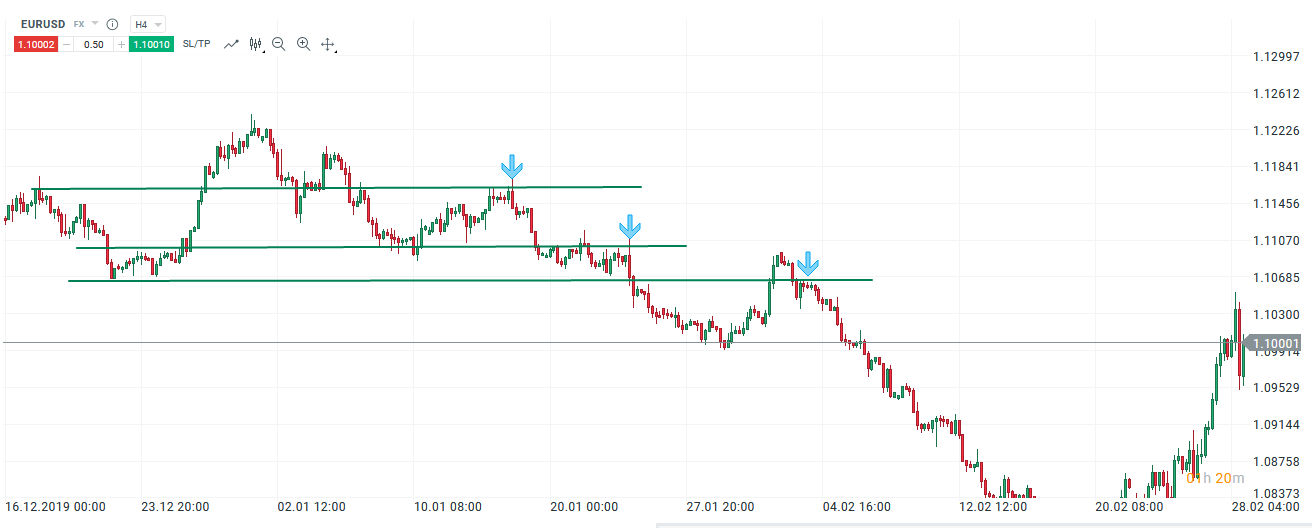
Example of a step motion. Chart EUR / USD, H4 interval. Source: xNUMX XTB xStation
Fibonacci levels
Some traders doubt the sense of using Fibo strictly to enter the position, others just the opposite. But if we can't get in, we can use Fibonacci levels to play backs. To this end, we are waiting for a newly developing trend. One technique is to draw the AB lift from the beginning of the movement to the end of the trend wave. Point C in Fibonacci retracement can then be used to play a correction.
In the attached example I used just 61.8 laying, but you can also use other levels, even those much less popular.
Corrections for retracements can also be very effectively combined with moving averages, and when these levels converge, they are likely to point to areas where the correction may end.
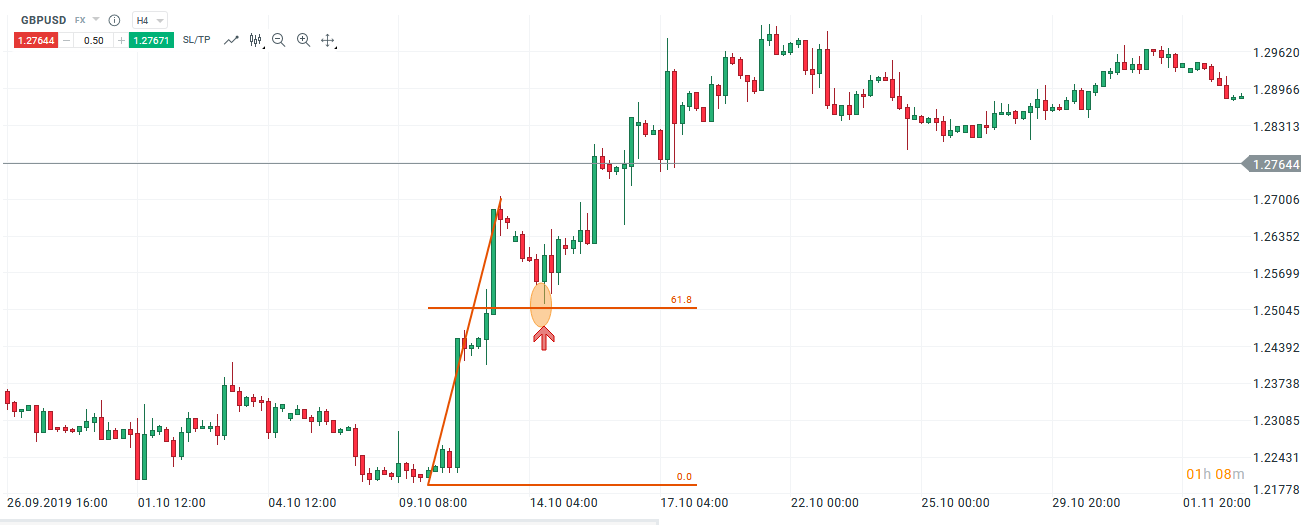
An example of using Fibo to determine the correction area. Chart GBP / USD, interval H4. Source: xNUMX XTB xStation
Moving average
Moving averages are one of the most popular tools in technical analysis and can be used in many ways. Of course, they can also be used to trade in corrections. Whether we use a 20, 50, or even a 100-period moving average does not really matter in this case. The most important thing is what type of investor we are: short, medium or long term. Low time frame traders typically use shorter averages to get signals faster. Of course, shorter averages are more prone to market noise and generate more false signals. The stick always has two ends - averages with more periods move slower, they are less prone to hype, but they can also make us miss short-term opportunities. Before using this type of techniques, you should always define your investment horizon at the beginning.
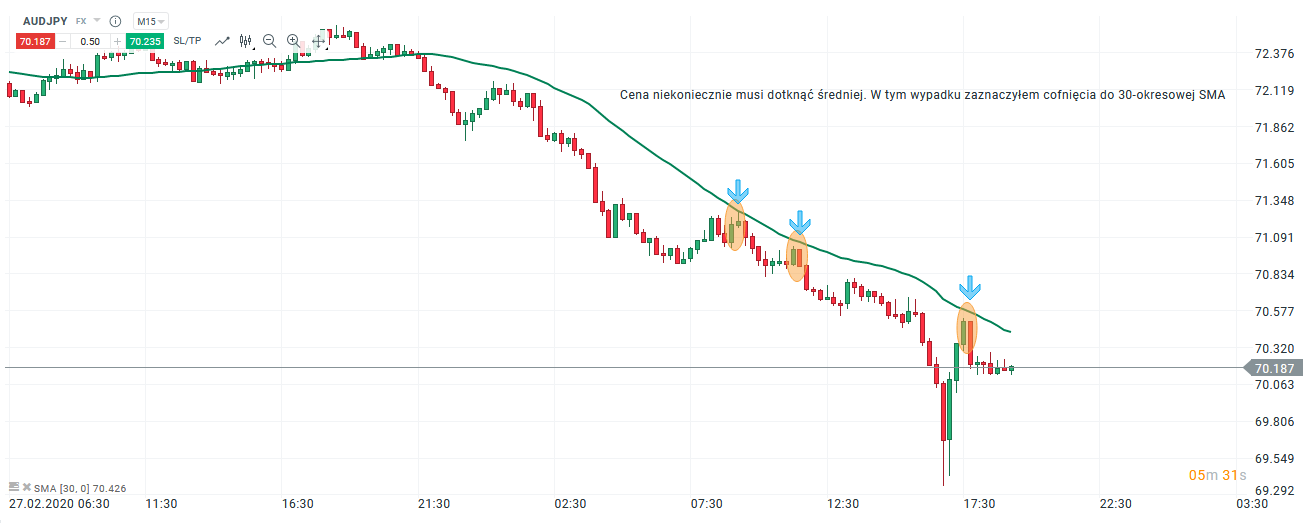
An example of using a 30-period SMA. AUD / JPY chart, M15 interval. Source: xNUMX XTB xStation
There are many different ways to approach corrections, and some tools can even be successfully combined to get even stronger signals. Which techniques we use should depend only on our trading preferences.


