


Key Concepts in the Context of Trend Change - Exhaustion and Reversal

Undoubtedly, one of the most important issues in the context of broadly understood investments and forex trading is the concept of trend change. The moment of the so-called transition, i.e. the situation when the dominant system on the market changes is usually difficult to read and play. At the same time, when we are able to understand why there is a change in sentiment and this change should take place accordingly, it can take our trading to a whole new level, allowing us to move smoothly on almost every market. With regard to the change in the trend, concepts are very important exhaustion and rejection.
In this article, we will introduce both concepts and show in which situations they can occur.
Be sure to read: How to combine trading with a full-time job - "At the end of the day" strategy
Exhaustion
When it comes to exhaustion, this type of movement most often occurs after strong periods of the trend. They mark a gradual change in sentiment on the market and a slow transition. The most common signs of exhaustion are:
- loss of momentum - is most often a significant decrease in volatility. After periods of strong swing, for example, in a growth trend, a candle with a long wick suddenly appears, then the growth candles become smaller and smaller until they gradually pass into the candles. As a rule, the first movement that is a swing is fast and dynamic, and then the momentum slowly weakens until the local peak is reached.
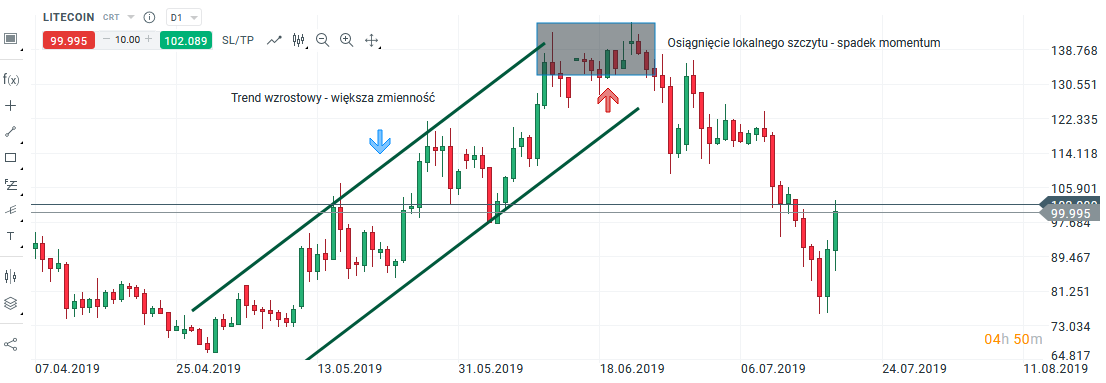
A sign of exhaustion in an uptrend. LITECOIN, D1 interval. Source: xNUMX XTB xStation
- head formation with arms - this is one of the few formations that signals exhaustion in the market. The key here is the creation by the price of the right arm. If this happens, it signals a change in sentiment, because the market is not able to create a new summit. The next step is to break and create a lower hole. The last confirmation is the neck line.
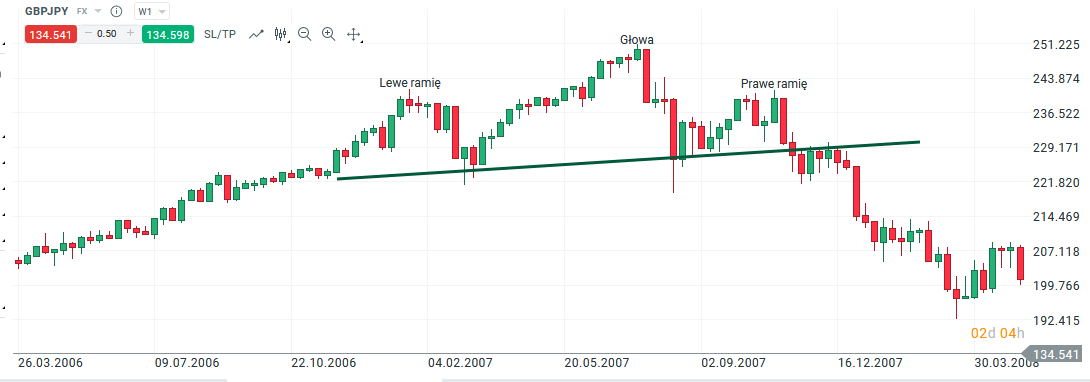
Example of a head formation with arms. GBPJPY, W1 interval. Source: xNUMX XTB xStation
- divergence combined with momentum - to find exhaustion zones you can also use oscillators, eg RSI. Divergence means that individual trend waves become shorter and weaker, which is a natural sign of market exhaustion. An example can be a very dynamic upward movement combined with a lack of dynamics on the oscillator.
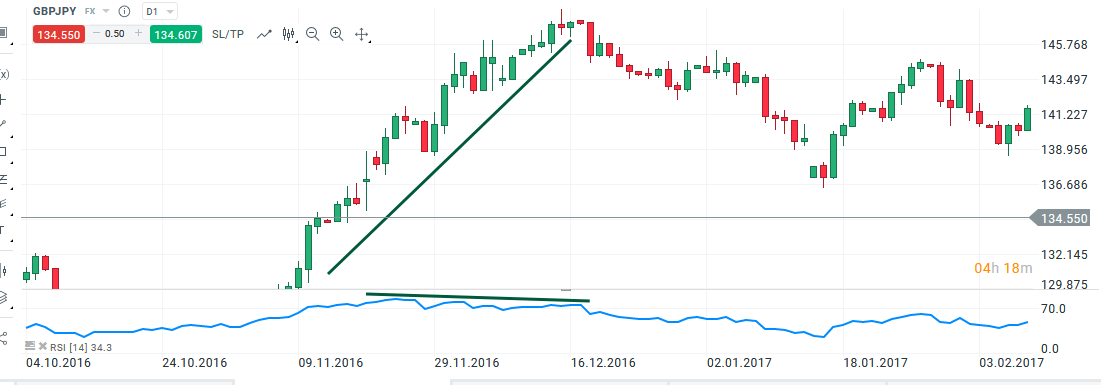
An example of divergence as signs of market depletion. GBPJPY, D1 interval. Source: xNUMX XTB xStation
Rejection
Movements of this type are also called "Traps". In contrast to the exhaustion movements, they are characterized by greater impulsiveness and variability. While exhaustion, as a rule, gradually signals the change and transition from one trend to another, for that rejection it can occur even in one candle.
The most common signs of this type are:
- rebound from support / resistance - rejection candles, have long shadows that break / pierce the previous hole or top. Often also the so-called embrace (the covering candle covers the previous one),
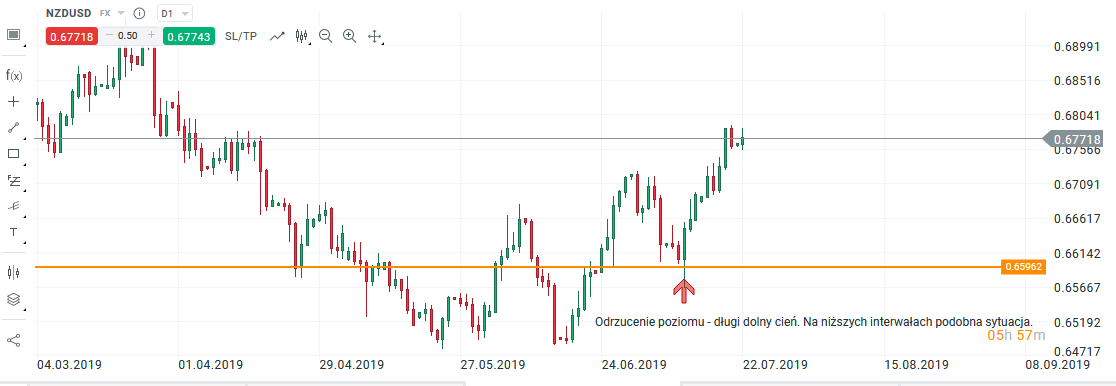
Reflection of shadows from support signaling rejection, NZDUSD, D1 interval. Source: xNUMX XTB xStation
- double bottom formation - this is the next formation, this time very well signaling rejection. If the price moves a second time towards a significant level, traders who have previously missed the entrance, want to join the given traffic. They enter the position too early, are caught in a trap, and the price sharply moves in the opposite direction.
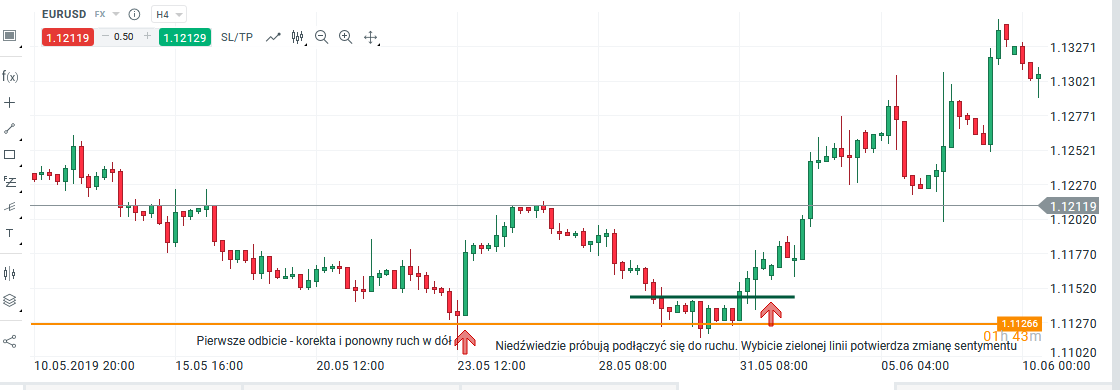
Double bottom as a rejection, EURUSD, H4 interval. Source: xNUMX XTB xStation
- breaking the Bollinger band - so-called jump outside the ribbon can also be a good signal of rejection. The indicator itself shows the strength of a given trend and sets a certain name for this "corridor" in which the price moves. Any violation of this corridor is an extreme. Using the pointer to determine this type of movement, it is worth to modify the standard deviation. You can assume a deviation at the 2.5 / 2.6 level. - then most of the price movements, is in the range between the ribbons.
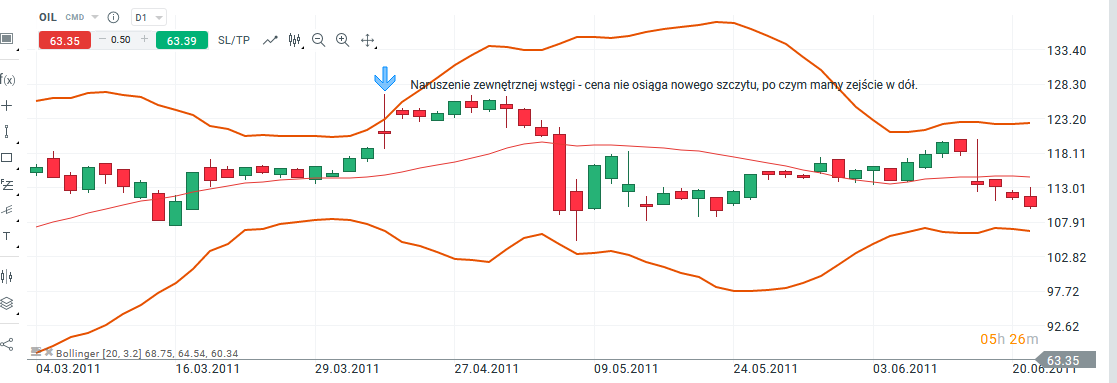
Breaking the Bollinger band as a rejection signal, ROPA BRENT, D1 interval. Source: xNUMX XTB xStation
Summation
Both exhaustion and rejection are very powerful signals of trend change. Regardless of what type of trader we are and what style of trade we prefer, it is good to know the concepts discussed, because thanks to them we are able to gain a significant advantage on the market.


