


Consolidation of strong gold gains, downside risk for oil

In August, momentum in the commodities sector remained positive as well Bloomberg commodity index for the fourth consecutive month it saw an increase. However, after the pandemic slump in the first quarter, the year-on-day result remains negative (down 11%). This month saw gains across the market, primarily in the energy and industrial metals sectors.
About the Author
 Ole Hansen, head of department of commodity market strategy, Saxo Bank. Djoined a group Saxo Bank in 2008. Focuses on providing strategies and analyzes of global commodity markets identified by foundations, market sentiment and technical development. Hansen is the author of the weekly update of the situation on the goods market and also provides customers with opinions on trading goods under the #SaxoStrats brand. He regularly cooperates with both television and printed media, including CNBC, Bloomberg, Reuters, Wall Street Journal, Financial Times and Telegraph.
The situation on raw materials
The two main factors that support commodity prices and attract investors' attention are the risk of rising inflation and the depreciation of the dollar. Better US data released earlier this month and a neutral approach to the control of the yield curve, signaled in the last minutes of the FOMC meeting, led to a slight increase in bond yields. This in turn contributed to the profit taking gold marketConsolidation took place after the bull market of 8,5% in July. This explains why gold ended up at the bottom of the table while silver - in third place - managed to take advantage of the 30% boom from last month.
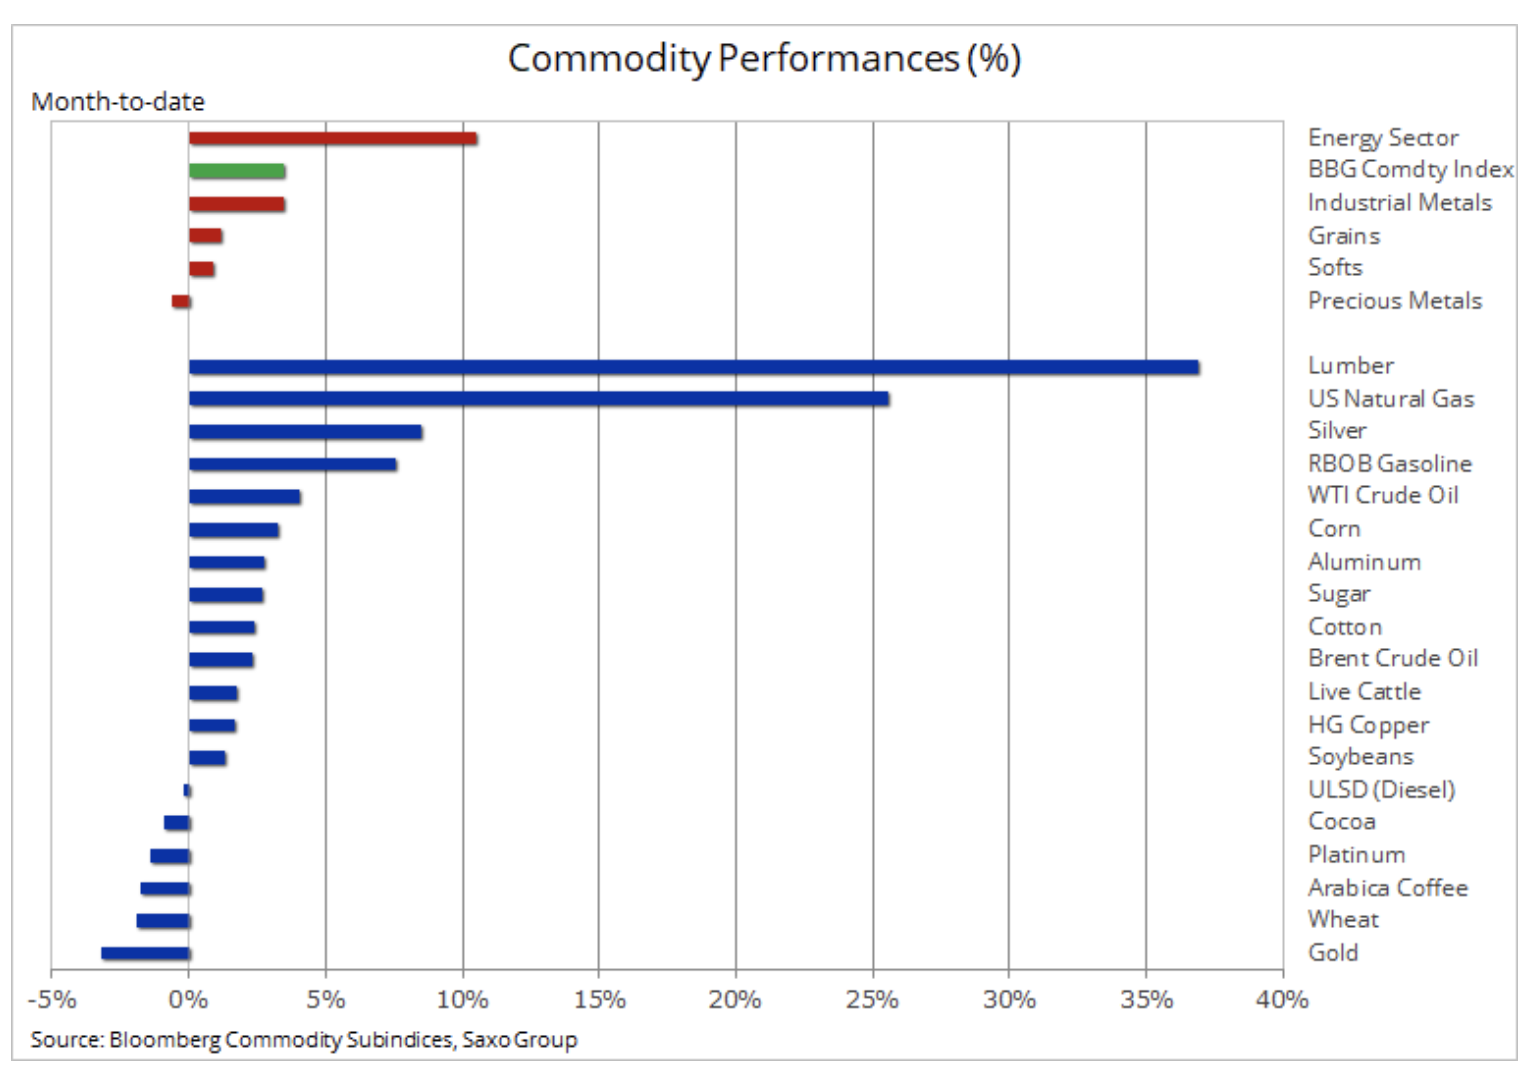
Commodity market - commodity index chart.
He unexpectedly found himself in the lead drewno - a small market of futures, which we usually do not pay much attention to, but this time it is worth looking at it in more detail. All over the world, companies offering building materials have recorded a solid demand from home consumers who have spent the money spent on entertainment in the city on renovations. In the US, this trend is reflected in solid results and recent statements from Home Depot (HD) and Lowe's (LOW) representatives. Since the March minimum, both stocks have more than doubled as customers rushed to the stores to buy goods, including timber.
The Random Length Lumber futures with an execution date in September rose 98% year-on-day to a record $ 801 / 1 plank feet, more than double the average price for the past ten years. In addition to increased demand from isolated consumers, record low interest rates contributed to the rise in new house starts. At the same time, timber stocks were small due to the tariffs imposed by President Trump on timber imports from Canada. After a few more days, when the price reached the daily limit allowed on the stock exchange, wood found itself in the category of raw materials overbought by investors.
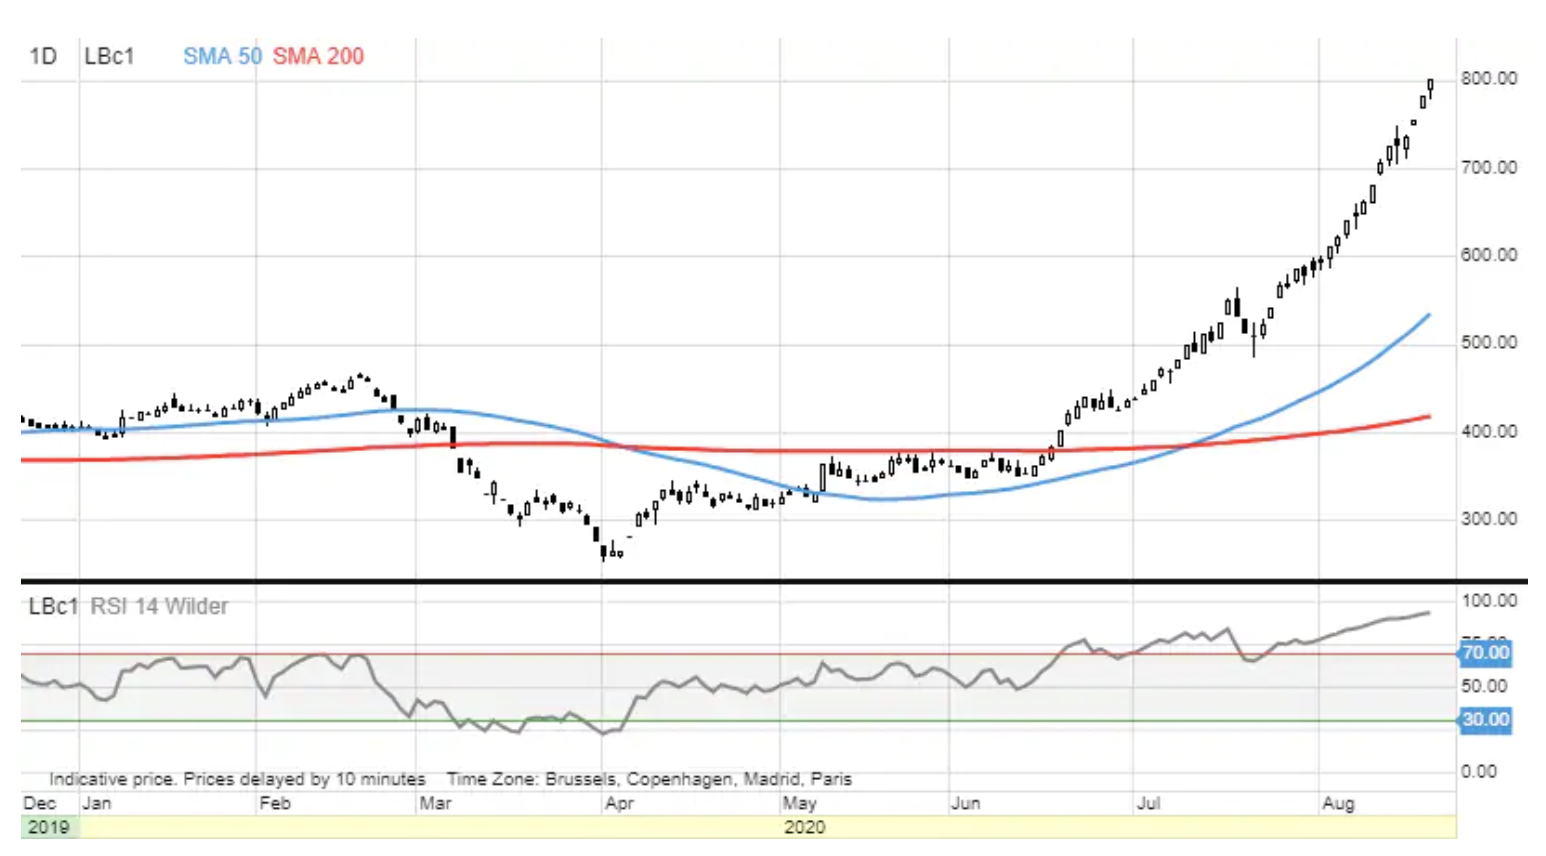
Commodity market - timber chart.
HG copper
It recorded another two-year high last week, continuing its strong recovery from the pandemic lows in March. Despite the recent weakening of the dollar, demand - especially in China, and recently also in the United States - has definitely increased. Added to this is the decline in the supply of mined copper and scrap as a result of the pandemic. This led to sharp declines in stock levels in stock exchange supervised by exchanges, most notably with the London Metal Exchange (LME), whose stocks fell rapidly to their lowest level in 13 years, thus triggering concerns about short-term supply.
However, the further increase in the price of copper depends to some extent on how much of this rapid reduction in inventories was due to speculation and how much was due to actual demand. Moreover, the demand for real assets, such as copper, may have been influenced by the growing interest in hedging against inflation, which in recent months has contributed to an increase in demand for gold and bonds protected against inflation. We remain skeptical about further potential for copper price increases at this stage, given that economic black clouds still hang over the market. A weekly close above $ 10 / lb in New York and $ 3,3 / l in London would be necessary to seriously consider a potential 3% expansion to $ 6 / lb.
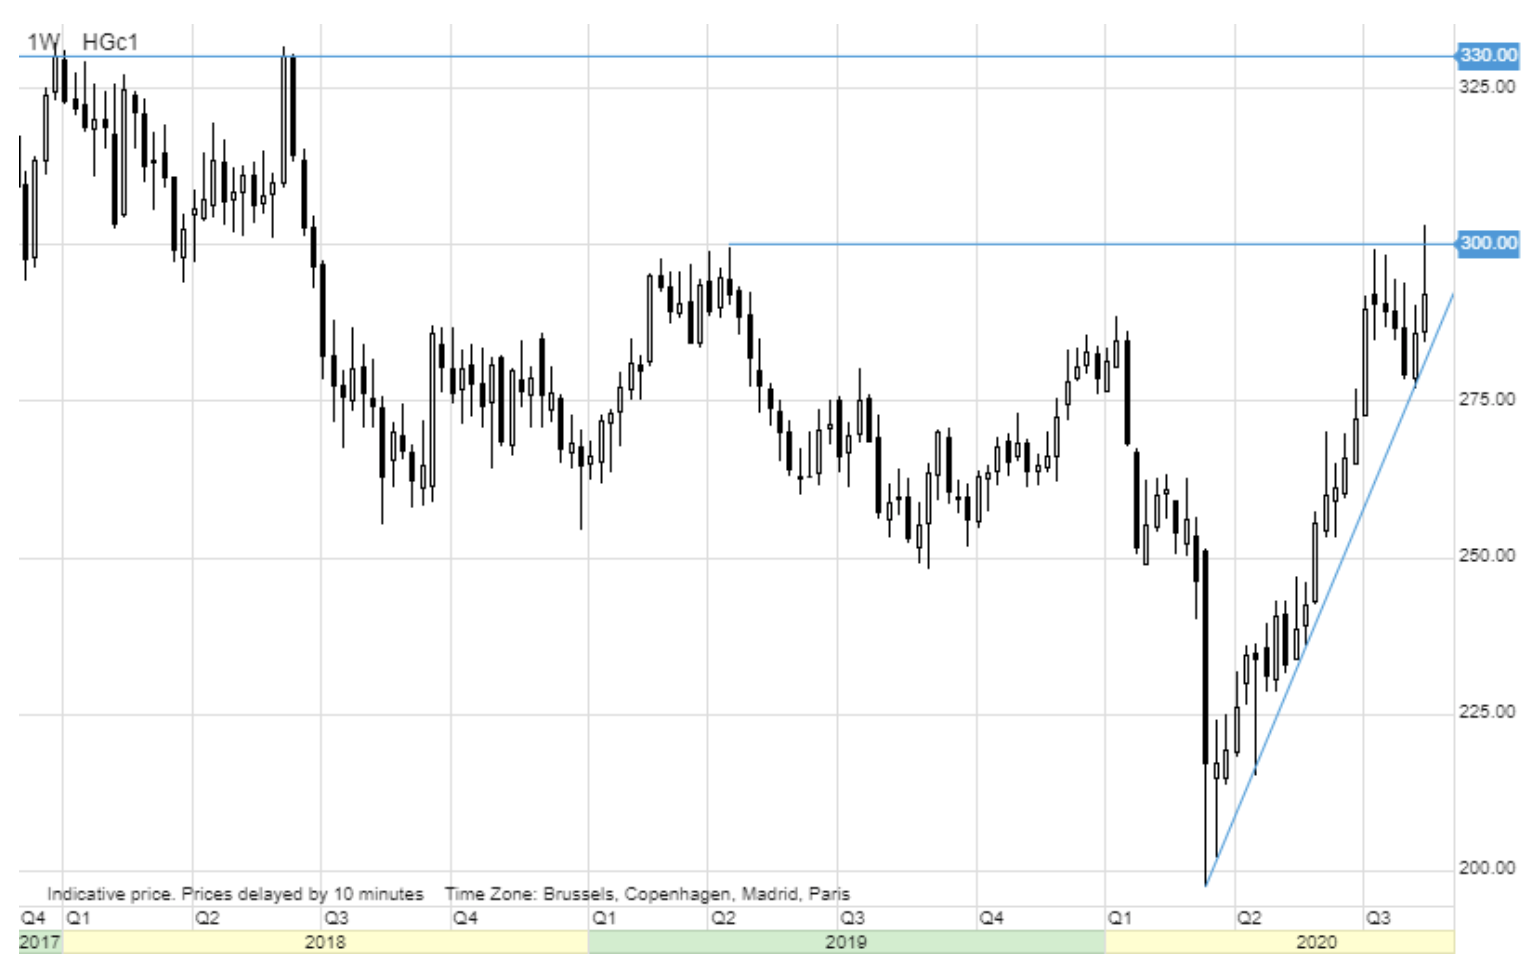
Commodity market - copper chart.
Petroleum
It has been recording a sideways trend since June; during this period, both WTI and Brent crude oil were not able to react - positively or negatively - to economic data and reports from oil market. For some, such a stabilization as OPEC + producers closed the taps is good news, while others fear that oil will not be able to rise in reaction to the recent dollar weakening and the continuation of the stock market boom.
The remaining oil market also saw a slowdown in stock prices in US large-cap energy companies: from early June ETF the S&P 500 index (SPY: arcx) outperformed the ETF Energy Select Sector SPDR (XLE: arcx) by more than 15%, while the impressive WTI and Brent oil boom from the April low began to weaken after both prices returned to the "low" level $ 40.
The short-term forecast remains negative; further price increases are hampered by pessimistic comments from American representatives Federal Reserve and OPEC + on economic forecasts. Following the last meeting of the Joint Ministerial Monitoring Committee (JMMC) last Thursday, OPEC + officials said demand was growing at a slower pace than expected. A longer and stronger second wave of contagions could lower the overall outlook for demand even further in the coming months. Against this background, the group is likely to take action to limit production to 2,3 million barrels per day (Reuters) in countries whose production is currently above agreed targets.
This is supported by the ceasefire last Friday by the Turkish Libyan government. The news came after Khalifa Haftar, with the support of Russian mercenaries, the United Arab Emirates and Egypt, failed to seize power in Tripoli or defeat the internationally recognized government. The possibility of increasing production by Libya, which currently produces less than 100 barrels per day, would further delay the rebalancing process and explain the fall in oil prices seen ahead of the weekend.
Brent crude oil remains in an increasingly narrower three-dollar range between the 43,30-day moving average of $ 46,25 and the two-hundred-day moving average of $ XNUMX.

Commodity market - Brent crude oil chart.
Gold and silver
The two best performing assets in 2020, after three weeks of strong growth, reached the required correction, as a result of which gold hit a new record high above $ 2 / oz and the price of silver reached $ 000 / oz after a fall almost to $ 30 / oz during the panic sell-off and cash rush in March. Both metals will now be at the center of the struggle between short-term technical traders looking to sell and long-term buyers who are concerned about the economic outlook while seeking hedge against the risk of impending inflation.
So far, there has been a double profit-taking in the market. The first one took place after an increase in US real yields in reaction to better economic data in the US; the second took place after the publication of the minutes of the last FOMC meeting, in which there were some doubts about the implementation of the yield curve control.
Overall, we maintain a positive outlook for gold and silver, with loose monetary and fiscal policies around the world supporting not only these two metals, but potentially other fossil resources as well. Real yields, as outlined above, have been the main driver of the gold price so far, and the potential introduction of yield curve controls combined with the risk of rising inflation - as the US authorities seek to extraordinarily stimulate the economy - should keep these yields at record lows. thus supporting the demand for metals.
An exceptionally nervous election period in the United States, combined with the current US-China conflict, may further strengthen this support due to the demand for safe assets. The third factor behind the growth of investments in precious metals is the possibility of an even greater drop in real yields, which should contribute to a further depreciation of the dollar.
In the short term, however, the market needs a consolidation of strong gains. Based on this, we predict the potential for growth above $ 2 will remain limited until the market adjusts to current levels. Considering how far the market has come this year, the correction could be relatively large. Based on Fibonacci retracements, we predict support will be at $ 000, the previous record high from 1, and then at $ 920 and $ 2011.
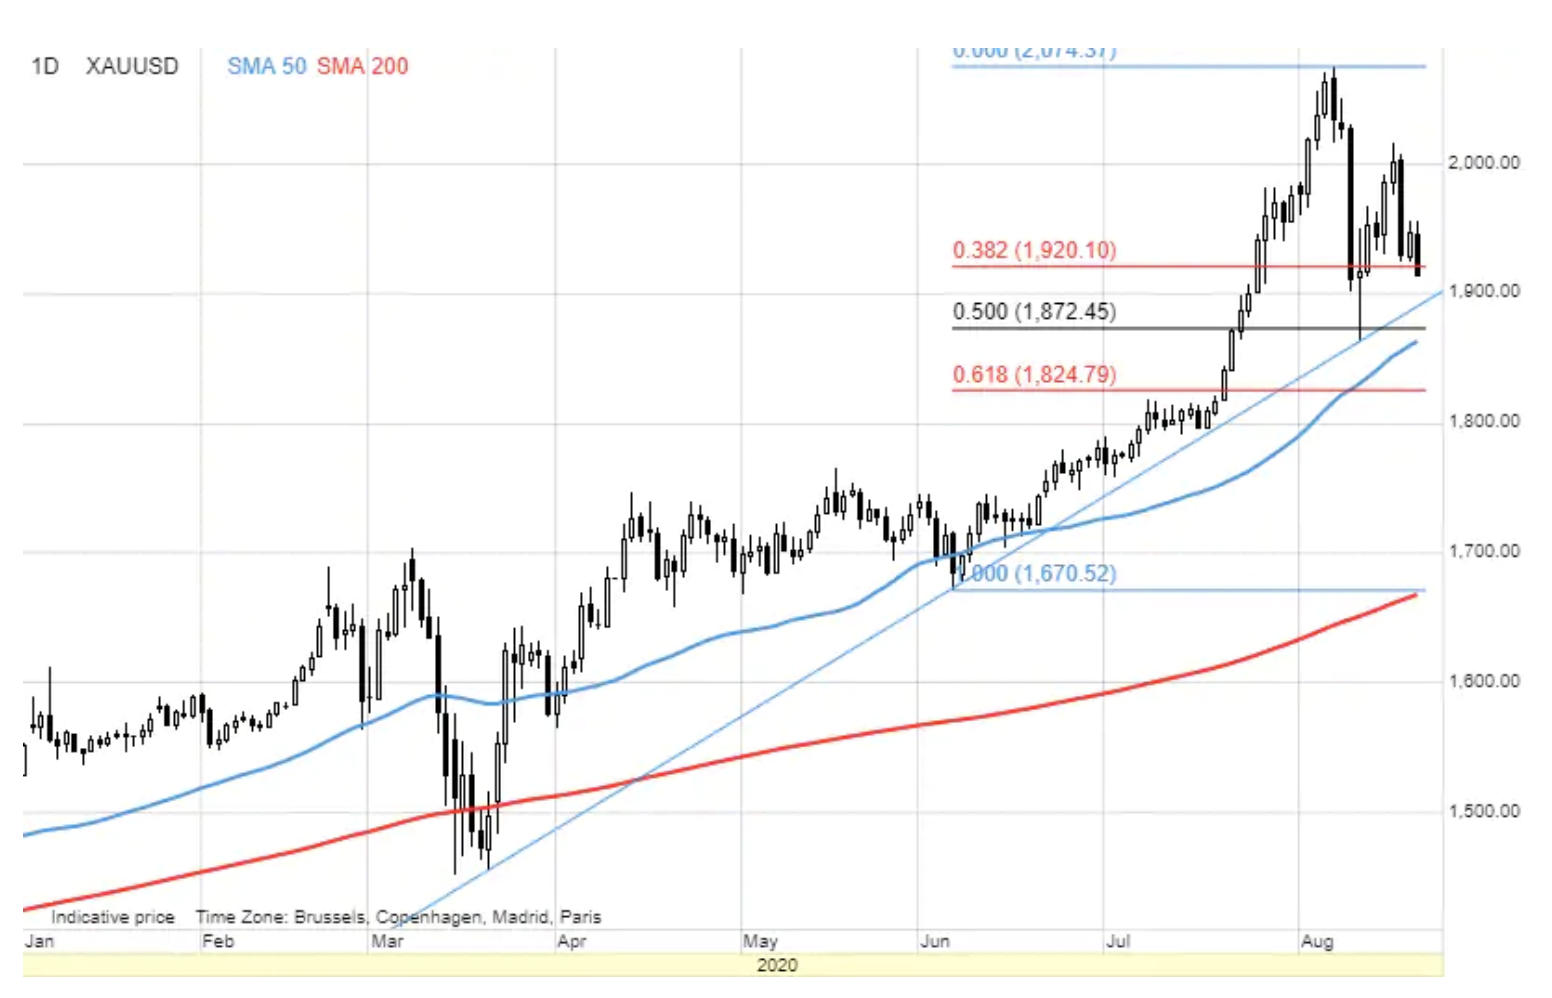
Commodity market - gold chart.


