


Trend lines - 3 techniques to make trading easier

Every trader, even beginners, knows what trend lines are. They can be a great tool if of course we use them correctly. In this article, we will introduce 3 techniques that will facilitate the use of trend lines.
A short reminder before we start:
The confirmed trend line should always contain at least 3 contact points with the price. Of course, you can always combine any two random points on the chart, but it's worth remembering that the more points, the more confirmed the line. When drawing, never cut the candle bodies. Cutting wicks is allowed.
Technique # 1: Breaking out and retesting the trend line
This technique is quite commonly used by many traders. The thing is, after identifying the active trend line, we wait until the price breaks it. Sometimes the price escapes and you don't look back. However, if it returns to the trend line, retesting can often be played as a high probability setup. Timing for transactions can be performed at a lower time interval or directly in the same range in which a given line was specified. With this technique, the trend line works both as a sort of "trigger" for the input and helps to place collateral orders. Stop Loss it is usually placed on the opposite side and the line acts as a hedging level between the entry price and the stop. The more contact points we have, the better the trend line is suitable for applying breakout and retest techniques.
The level of aggressiveness of the trader also determines how early the transaction enters. An aggressive and more risk-sensitive trader can enter the transaction as soon as the price touches the trend line. The more conservative may wait until the price moves away from the line and shows signs of momentum towards the transaction. There is no good or bad approach here, timing should always depend on individual preferences.
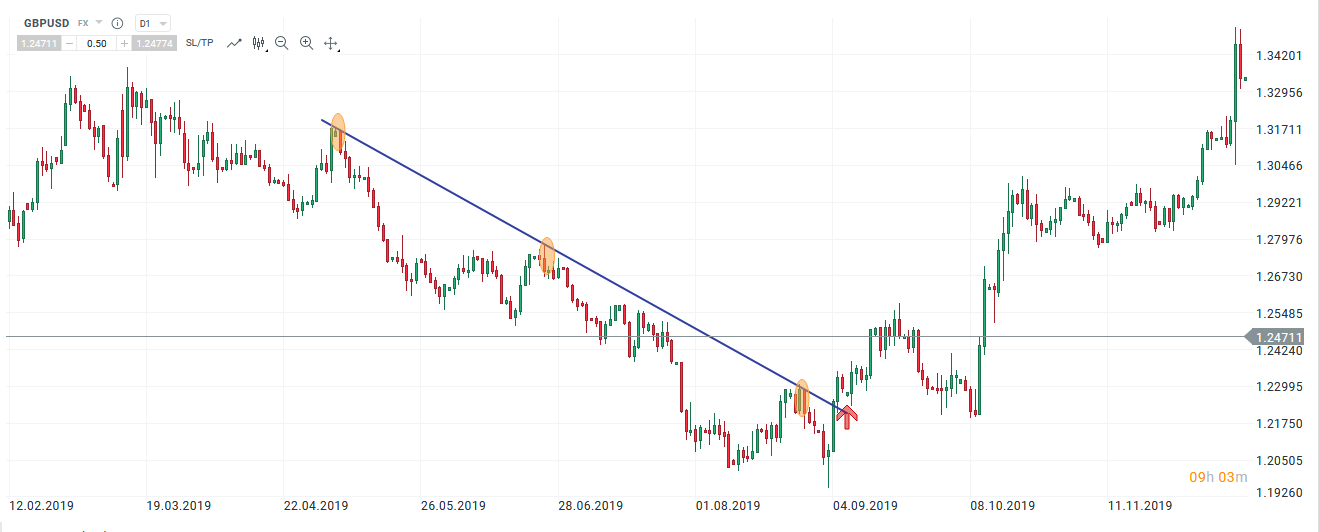
Breaking out and retest. Chart GBP / USD, D1 interval. Source: xNUMX XTB xStation
Technique # 2: Flag from the trend line
While the breakout and retest technique can be considered classic reversal or early trend following, the flag technique can be classified as regular trend tracking. In flag-based trading, we look for a set trend and then wait for a consolidation or reversal. If we can identify a pullback with the trendline, there may be an opportunity to play such a flag as the price crosses the trendline and resumes moving towards the target trend. In some cases, we can also gain additional insight into the behavior of market participants. In our example, while the initial downtrend was strong and the price slipped quickly in the short term (1), during the flag creation process, interest in shopping can be considered low at best (2). Comparing the trend intensity can help you understand the likelihood of a trendline breaking. In this example, the downtrend was much stronger than the bullish pattern, which meant that declines were more likely to continue.
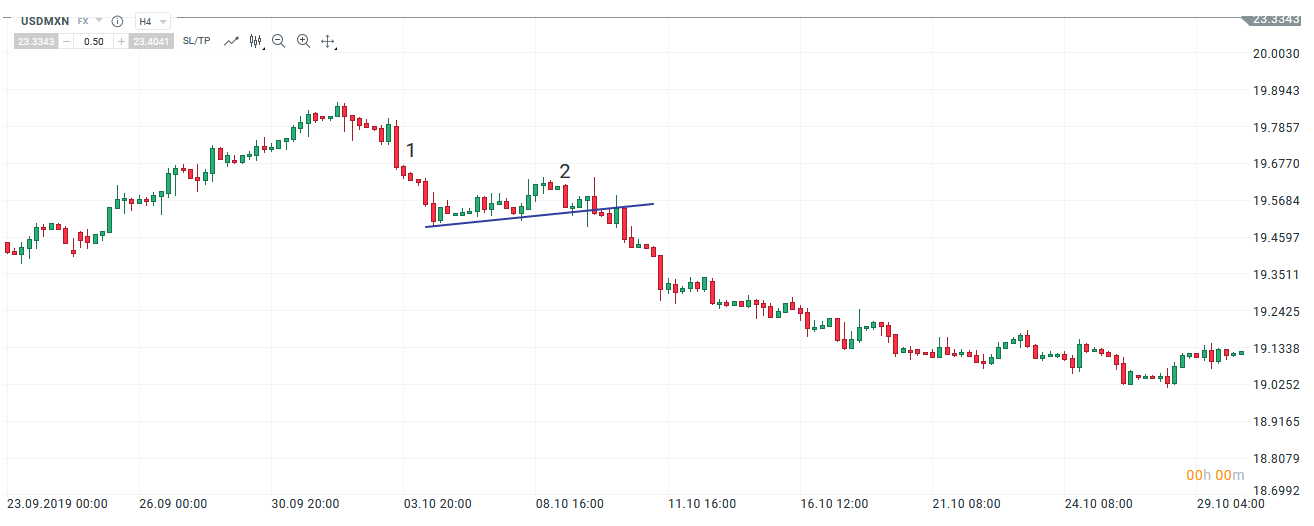
Flag from the trend line. USD / MXN chart, H4 interval. Source: xNUMX XTB xStation
Technique # 3: Cover from the trend line
Reflections from the trend line are also an approach in which we follow the trend strictly. Unlike the flag, the trend line is not used here to determine the time of entry into a transaction, but to identify scenarios in which it acts as support or resistance. With these types of techniques, the trader can be extremely conservative and put stop loss completely under the trend line or apply a hedging order under the resistance level. Again, there is no right or wrong approach. It all depends on what risk appetite we are able to accept.
Reflections can also be used in a multi-interval approach, and after drawing a long-term trend line, the trader can then go to a lower time frame and look for opportunities to enter the transaction there, using different technical concepts. Using this approach can help some of you get into the deal early and also find scenarios with a higher profit / risk ratio. However, you can trade for a rebound from the trend line directly from a higher time frame if, for example, a favorable candlestick formation appears.
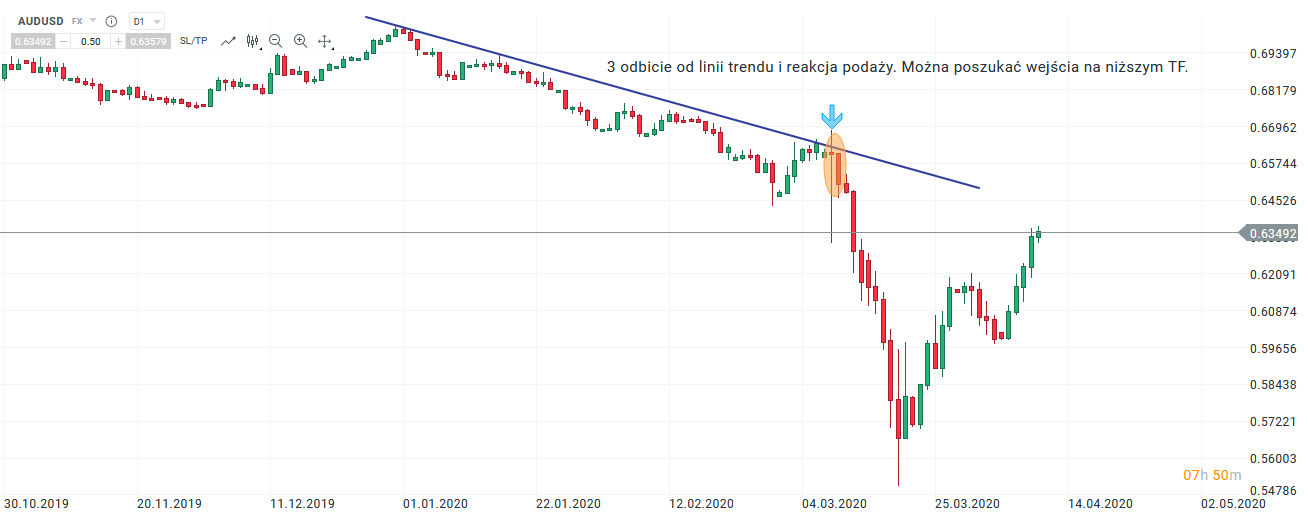
Reflection from the trend line. Chart AUD / USD, D1 interval. Source: xNUMX XTB xStation
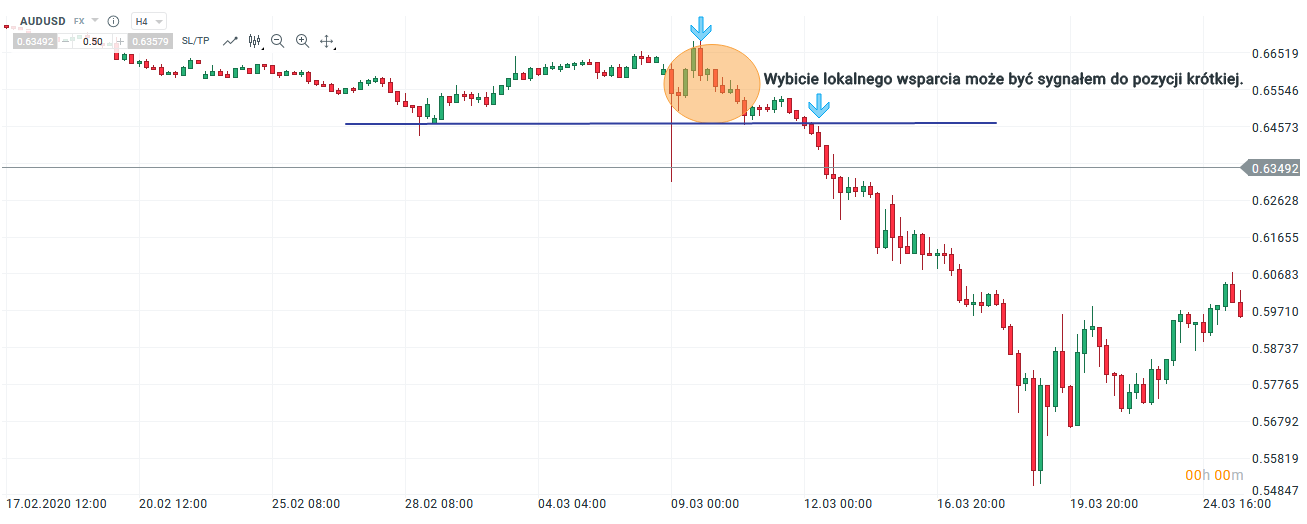
Opportunity to enter from a lower interval. Chart AUD / USD, H4 interval. Source: xNUMX XTB xStation


