


Market Profile as a tool for determining market condition

Market Profile is a technique developed in the 60 years. by one of the traders of the American dance floor CBOT (Chicago Board of Trade) by Peter J. Steidlmayer. Steidlmayer tried to estimate the market value that developed during the day. His charts took the form of a bell. In this structure, he recognized the Gaussian normal distribution. The creator of the methodology, combined the concepts of minimal relevant price movement, balance and Gaussian distribution to define an indicator that can track market movement at any given time. The market profile uses time and price to locate areas of market equilibrium during a given session.
Although it is hard to consider the above concept as a strategy or transaction system, it can be used to analyze the current state of the market. Market Profile helps explain whether the market is in consolidation or whether we are dealing with a trend. The advantage of the above indicator compared to the volume profile is that we can use it on unregulated markets, such as Forex, because it does not need volume data that is inaccessible or insignificant.
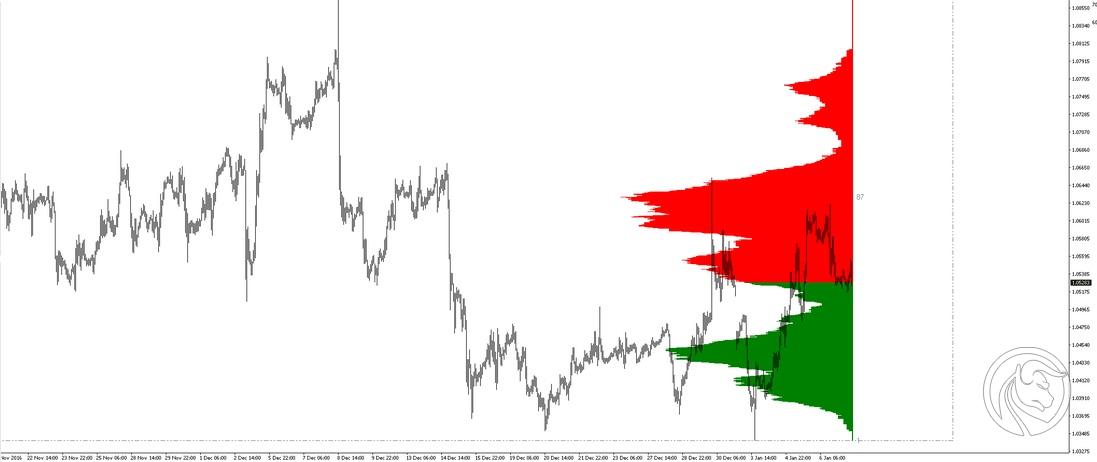
Market Profile on the platform MetaTrader 4.
The structure of the Market Profile indicator is as follows:
Individual price levels were plotted on the vertical axis and time (TPO - Time Price Oportunity) on the horizontal axis. TPO is nothing but the basic unit of time on the chart. It presents the specific time period in which trading takes place through the next letters of the alphabet, where "A" means the first 30 trading minutes, and each subsequent letter is the next 30 trading minutes. A new TPO appears when the price "hits" the price level for the first time. In the case of the currency market, where trading takes place around the clock, it should be remembered that the graphic image of the session was divided into two parts. Uppercase letters take values from the beginning of the session, while lowercase letters make up the second part of the session, which includes time from 12 at noon.
An example below:
A = 00: 00 - 00: 29 a = 12: 00 - 12: 29
B = 00: 30 - 00: 59 b = 12: 30 - 12: 59
C = 01: 00 - 1: 29 c = 13: 00 - 13: 29
The first 60 minutes of the session are referred to as Initial Balance and it is a benchmark for the rest of the day. Each letter is responsible for 30 minutes of trading, so you should consider the Market Profile to be day traders as it is used on 30 minute charts.
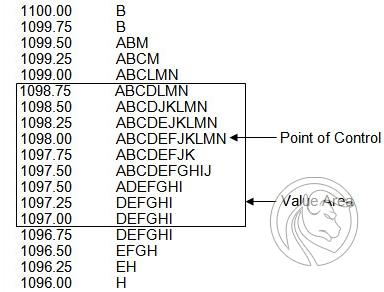
The price level at which the highest number of transactions was recorded is called POC (Point of Control) and this is our benchmark for how the market will shape relative to the previous session. The market equilibrium point determines the fair value of a financial instrument on a given day. This is due to the fact that the price tended to return to a given area and to a specific level on the chart.
Another concept that we need to know using the benefits of Market Profile is Value Area. This is the area in which the largest number of buy-sell transactions was concluded and represents 70% of the session duration. It can be said that this area illustrates a kind of consensus developed by the forces of supply and demand.
Types of Market Profile and its application
The Market Profile looks like the shape of a bell and can come in several forms.
The first is the classic bell. It is presented in the form of a single bulge (unimodal chart). According to the assumptions of the concept, the levels above or below the bell should be treated as resistance or support, respectively. That's when you should look for opportunities to take a position and expect a return to the Value Area, because this shape of the chart is considered to be the most reliable when making trading decisions.
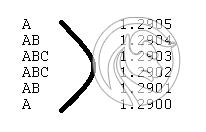
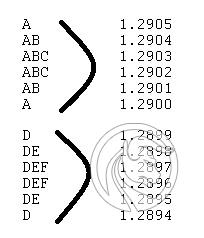
The second type of chart we can meet is a double bell (bimodal chart). This, in turn, presents a situation in which the market has been consolidating for some time at certain levels, and then breaking them and consolidating in another area. In the chart below, the 1.2905, 1,29, 1,2899 and 1.2894 points represent potential levels of support or resistance.
The third form Market Market can take is one-way traffic. There are no bulges, which suggests a strong movement and trend formation. In this case, we should look for opportunities to enter the market in accordance with the prevailing trend, because the market does not consolidate in any of the areas and one of the parties dominates.
Summation
Market Profile can be easily downloaded and installed on the platform MetaTrader 4 and/ or MetaTrader 5. In combination with other market analysis techniques, it can be used as a useful tool for determining the current market condition, identification potential reverse directions and places of balance.
Market Profile - version for MT4
Market Profile - version for MT5
Be sure to read: MT4 vs MT5 - Comparison of features and capabilities


