


Most NZD buyers for a year. A look at the COT report

Looking through the weekly report of the American CFTC commission, i.e. the Commitments of Traders report (COT), we can come across a very interesting positioning among speculators on the New Zealand dollar.
It is so interesting that the recent events and the chart in the central bank's activities on such positioning would rather not indicate. Recall that at the beginning of May the NARB cut off the main interest rate with 1,75 percent. to 1,5 percent, which is the new record low cost level of money. Then, the argument for such a decision was global economic growth, which slowed down since the middle of 2018, reducing the demand for goods and services in New Zealand. This lower global growth has led to easing of monetary policy, supporting growth prospects.
Before this decision NZDUSD quotes they systematically dropped by directing the market towards the October XNUM minima. As a result, an interesting simple correction layout appeared on the weekly chart, where wave C is equal to wave A. Also, the lower limit in the trend channel may act as support for this market.
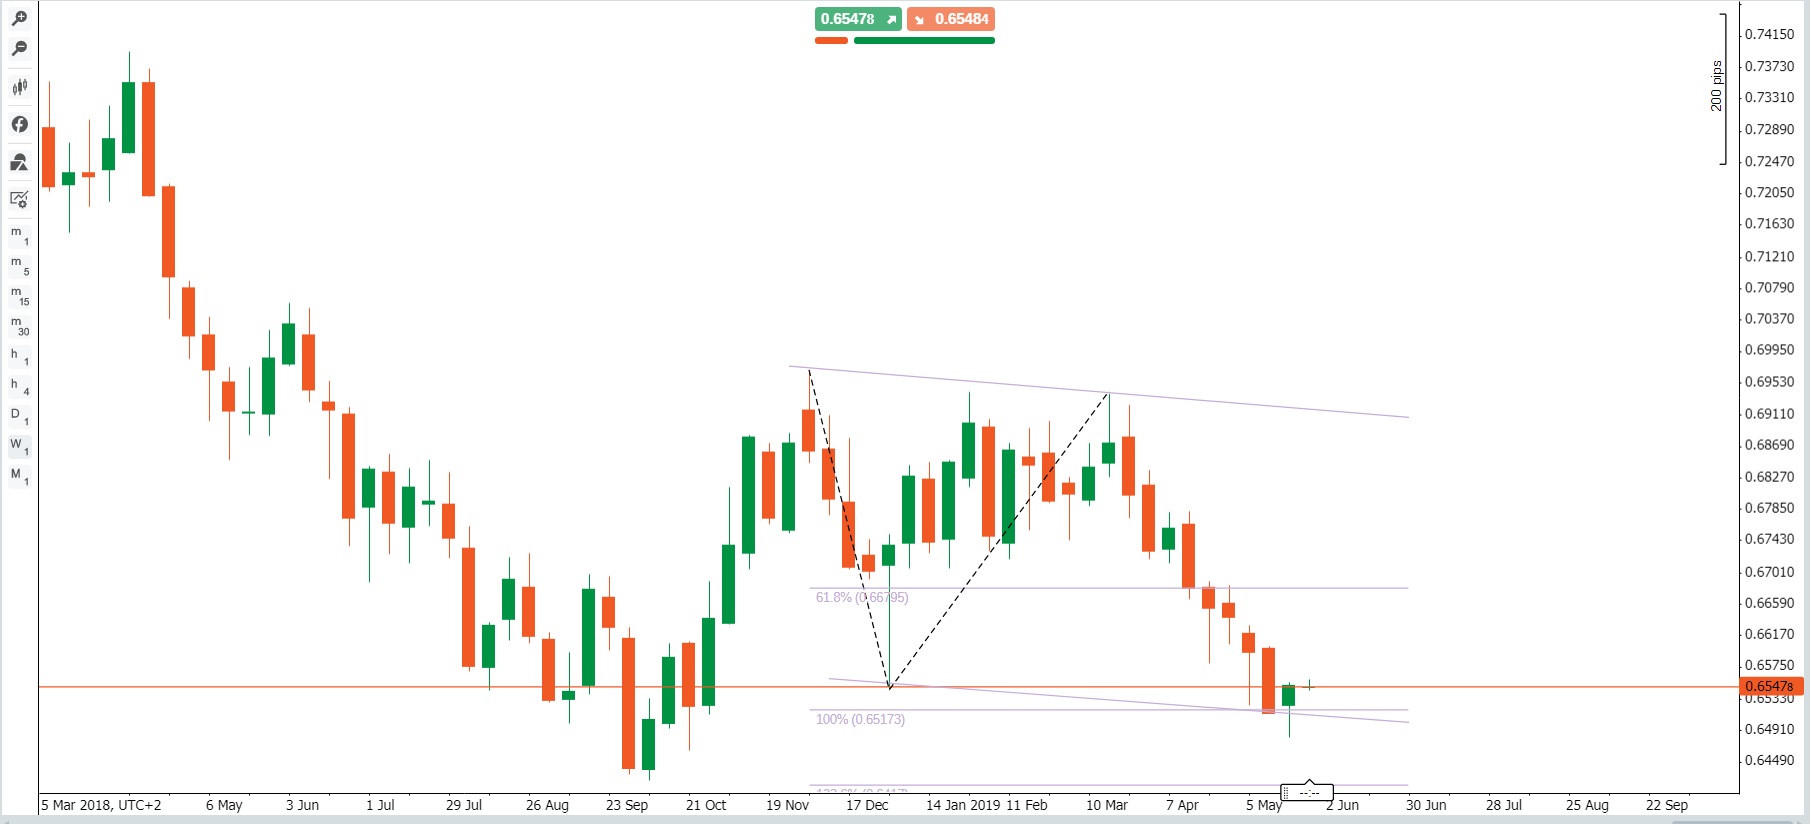
NZD / USD, W1 chart. Source: platform Conotoxia
In turn, during the decline in NZD values, leveraged funds increased their exposure to long positions, which in turn led to the growth of long net positions to the highest level since May 2018.
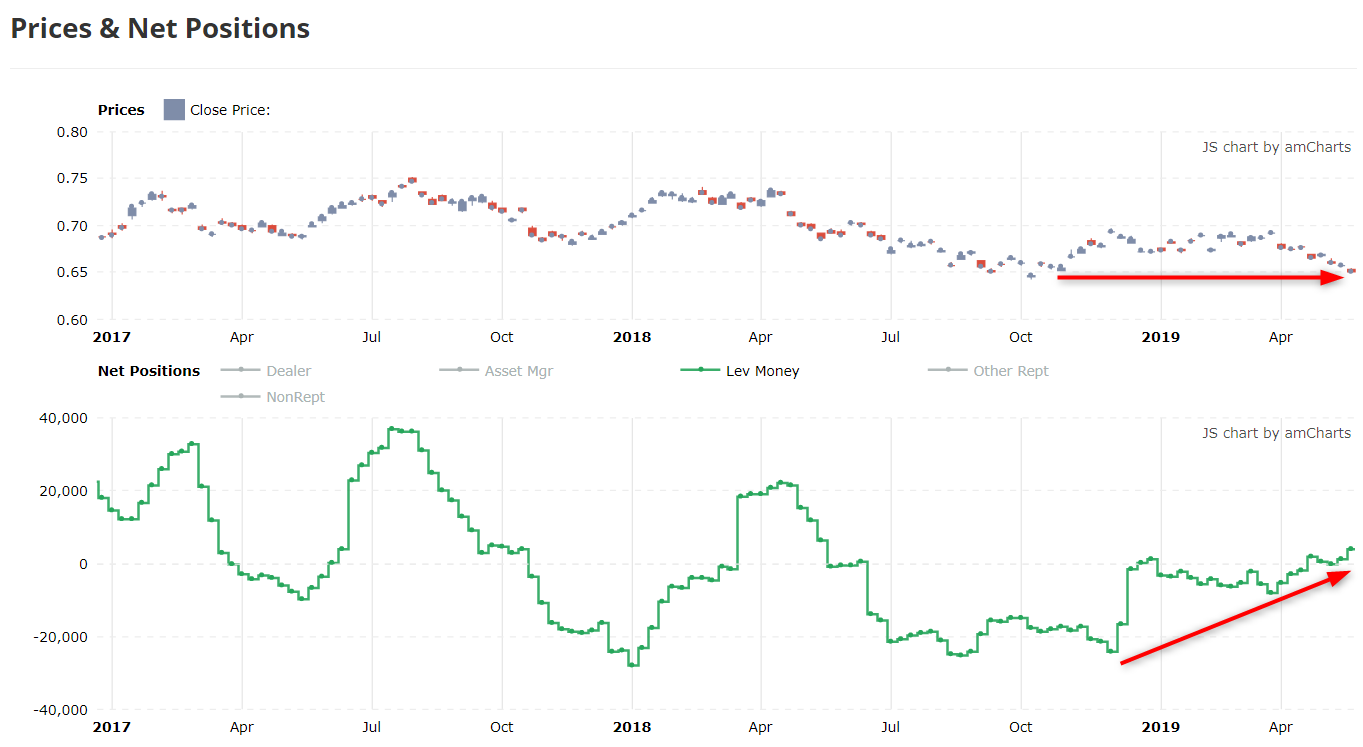
Long net positions and NZDUSD exchange rate. Source: tradingster
It seems, therefore, that leveraged funds systematically bought contracts for the New Zealand dollar at a time when they became cheaper. Thus, the divergence between price and positioning has definitely increased.


