


 – this cryptocurrency increased in price 2024 times in 20")
 are recording the largest daily outflow of funds in history")

PCE – an indicator that measures the level of consumption among Americans

Households can spend their income on two things: consumption and savings. Consumption is the basis of GDP in most developed economies. Domestic demand is one of the most important engines of economic growth. Consumption is the purchase of all the goods and services that are needed to satisfy needs. Some expenses may be permanent (e.g. buying furniture), others are typical current expenses (e.g. going to a restaurant). An important indicator that allows you to determine the size of consumer spending is PCE (Personal Consumption Expenditures). he measures US household consumption. This is such an important indicator that the Federal Reserve monitors its parameters.
The PCE index is compiled by the United States Bureau of Economic Analysis (BEA - Bureau of Economic Analysis). It is a federal agency that develops many indicators describing the condition of the American economy.
The PCE index itself is relatively young. BEA began collecting data on consumption from 2012. Both at current and constant prices. PCE is one of the three parts of the report titled Personal Income and Outlays. The report includes:
- Personal income, i.e. the earnings of consumers.
- Disposable income, i.e. consumer income after taxes.
- PCE- Personal Consumption Expendituresi.e. consumer spending.
Some economists use the PCE to estimate future changes in consumer spending, which may translate into the rate of economic growth.
How PCE is calculated
BEA calculates PCE on a monthly basis. Personal Consumption Expenditures is divided between spending on consumer goods and services. In consumer goods, it consists of durable goods and non-durable goods.
The PCE indicator is based on data collected by an agency that divides expenses into specific categories. And so in PCE you can find:
- Durable goods – are purchased for a period of more than 3 years. they include e.g. vehicles and parts, furniture and durable home furnishings, recreational goods and vehicles (e.g. audio, video, photographic equipment, musical instruments). Interestingly, BEA also includes weapons and ammunition as recreational goods.
- Nondurable goods – in this case, the BEA divides these goods into the following categories: drinks and food, clothes and shoes, fuel and other energy expenses. They are the last category “other non-durable goods”.
- Services – in the case of services, PCE divides these expenses into those related to home and utilities, transport services, health care expenses, financial and insurance services, expenses for restaurants and hotels, leisure and other services.
BEA's consumer spending calculations are broken down by state to make it easier to see the different dynamics of specific regions of the United States. It is worth noting that thanks to the PCE analysis, it can be seen that most of the goods and services of American citizens are purchased from private companies. This means that the decline in consumer demand will have a negative impact on the revenues of companies operating on the US market. It is also worth remembering that PCE includes household expenses also those made by other entities for the household. Can be counted here paid by health insurance companies or assistance from the federal or state governments.
PCE example
Information on PCE is available at bea.gov. This is the government website of the BEA agency that collects data on the American economy. For details on consumer spending, see Personal Income and Outlays. The latest data available is for June 2023. Let's look at them a bit more carefully.
The table contains information about how they have changed:
- income (Personal Income),
- disposable income (Disposable Personal Income),
- private consumption (Personal Consumption Expenditures i.e. PCE),
These data refer to changes on a month-to-month basis. As shown in the chart below, household income increased by 0,3%MoM on average. If we look at PCE, ie private consumption, spending increased by 0,5%MoM. This means that American households were saving less than a month ago. Most likely, the poorer part of American society has consumed savings or increased the level of debt.
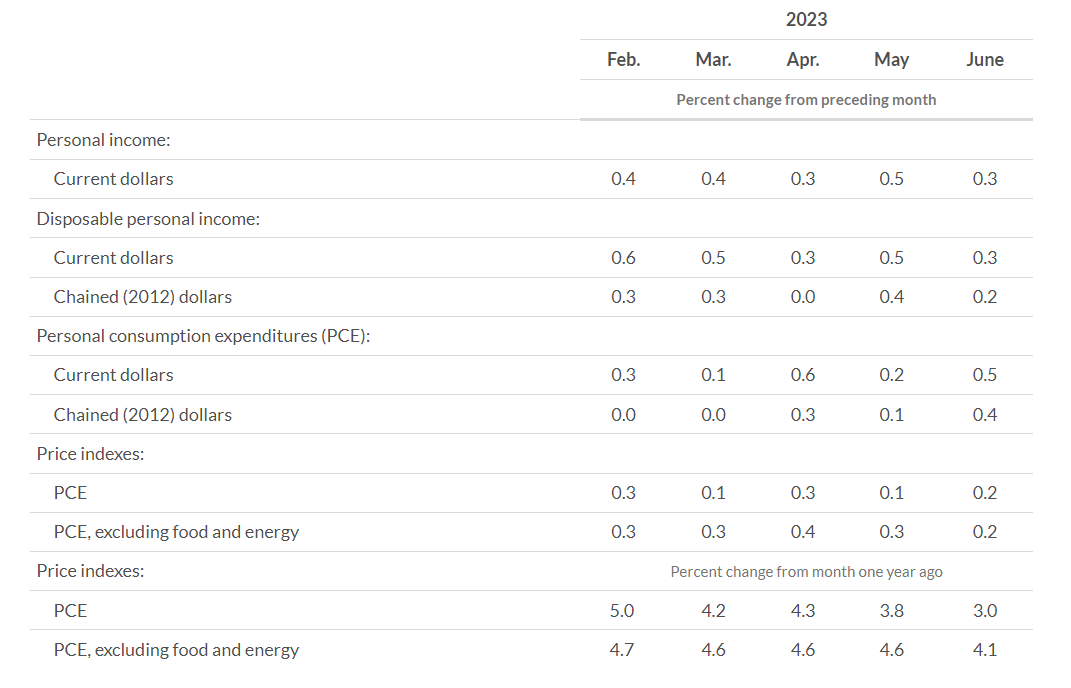
Income and consumption report. Source: BEA
In addition to percentage changes, BEA also provided nominal values of changes in individual components of the report. According to the information provided by the agency, we know that the increase in household income was mainly due to the improvement in wage income. This more than offset the decline in asset income.
Consumer spending (PCE) increased in June 2023 by USD 100,4 billion m/m and amounted to USD 18 billion. Yes, that's not a mistake, that's the scale of the American economy. According to the report, PCE rose by $383 billion in goods in June and $51,2 billion in service spending.
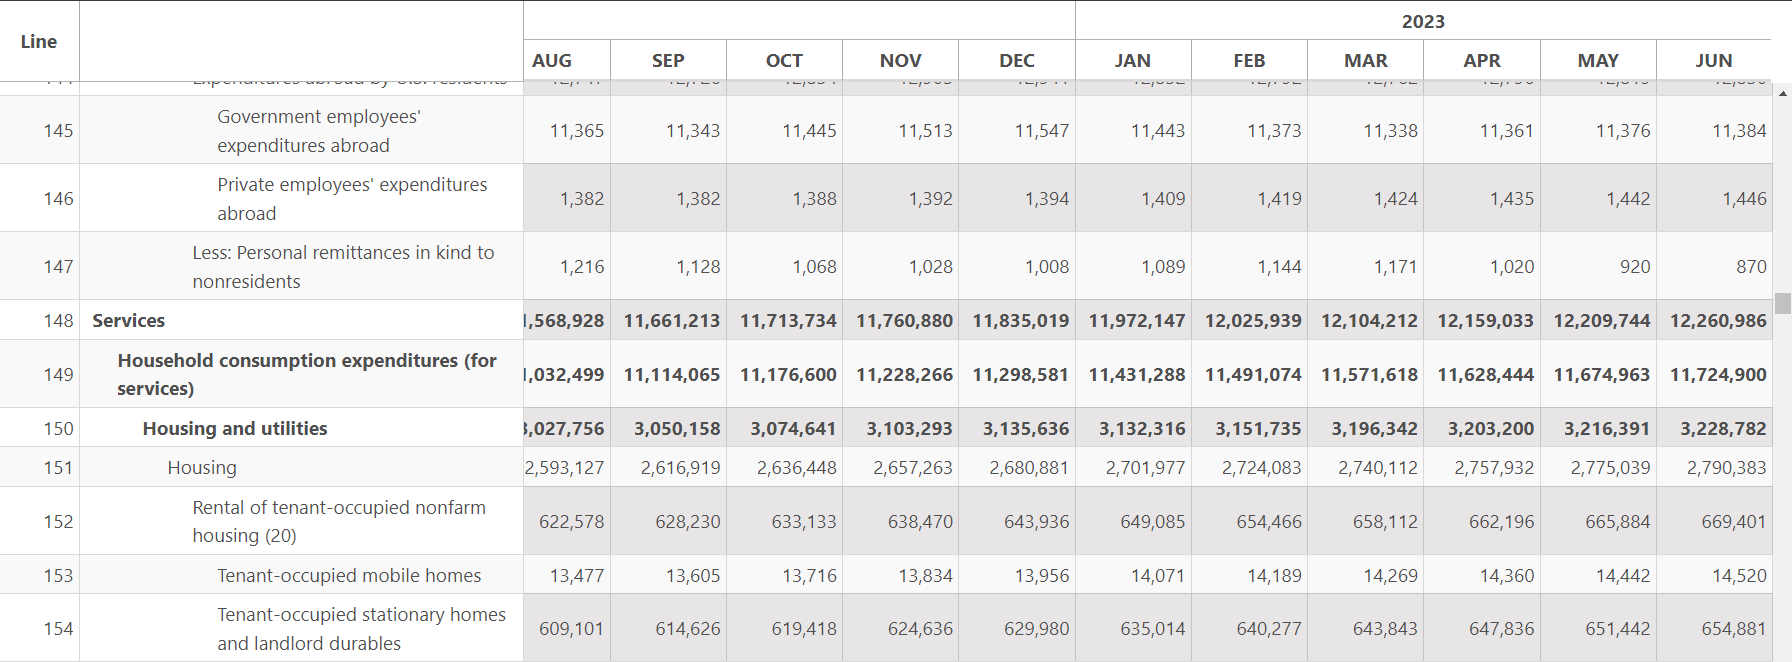
An excerpt from the PCE statement. Source: BEA
The most important source of growth in expenditure on services was the segment of financial advisory and insurance services. This was due to good sales of portfolio management and investment advice services. Household and recreational services were ranked next. It is worth noting that expenses in restaurants and hotels fell (by 2 billion m/m) and in transport services (by $6 billion m/m). However, if we look at PCE's expenditure on services on a y/y basis, we can see that there has been a significant increase in expenditure on services. They increased y/y from $11 billion to $403 billion. This means a y/y increase of 12%.
In the case of goods, spending increased by $49,1 billion on a monthly basis. The biggest positive impact had the sale of engines and car parts, fuel and other petrochemical products (including lubricants, car fluids, etc.). In June 2023, spending on goods amounted to approximately $6 billion. For comparison, a year ago it was about $122 billion. This means a y/y increase of 6%. This is a very small increase in spending, even taking into account that there was a slight deflation on the goods market, which amounted to about -034% y/y
It is worth noting that BEA also publishes PSR, or Personal Saving Rate. In June 2023, it amounted to 4,3%. In nominal terms, the level of private savings in June 2023 amounted to $862,4 billion. Savings is the excess of household income over expenses. The higher the saving rate, the less money is left for consumption. On the other hand, savings can be fed back into the economy through investment.
Advantages and disadvantages of the PCE indicator
There are no perfect measures. This is because any macroeconomic indicator is only an inaccurate approximation of reality. However, without such measures, it would be difficult to objectively look at specific economic trends. The PCE indicator has its advantages and disadvantages, which we will try to briefly summarize.
Advantages
The great advantage of the PCE indicator is an approximation of what private consumption looks like in the American economy. Weak PCE readings may herald that consumer sentiment is weak, which may be reflected in worse sales of discretionary goods. This may make the Fed look a bit more dovish on monetary policy in the short term. In turn, very high PCE readings (especially PCE-based inflation) may encourage the FED to tighten monetary policy to prevent the economy from overheating.
Thanks to the division into individual product categories, we get information on whether consumers spend more on durable goods or prefer to spend more on going out to restaurants. This allows us to study the purchasing preferences of the American society.
It is worth noting that the number of product categories is very wide. Therefore, these may be interesting data for fundamental investors in companies operating mainly in the United States. We have a list of changes in consumer spending for a wide range of services and products. Since after each month we learn how Americans spent on individual product categories, we can try to estimate how it will affect the operations of the company we analyze or keep in our portfolio.
Disadvantages
PCE is an indicator that is often revised. This causes some people to be skeptical about using this indicator as an accurate approximation of the situation of American households.
Like all data, they are based on some approximations. Because of this, they can slightly distort reality. Another problem is that data may be inaccurately collected, or errors may creep in during their aggregation.
PCEPI – an indicator that measures consumer inflation
PCE is often used to analyze inflationary or deflationary changes in an economy. According to proponents of the use of PCE, it indicates well changes in consumer habits during inflation and deflation. In addition, an inflation index based on the PCE was created. He is PCEPI (Personal Consumption Expenditures Price Index), which is used to estimate consumer inflation. The PCEPI is an indicator that determines how the costs of products and services that consumers spend money on change. PCEPI are calculated in two variants:
- The PCEPI is calculated on the basis of the PCE basket.
- Core PCEPI deducts food and energy expenses from the calculations.
Core PCEPI is able to capture the main inflationary or deflationary trends in the economy. The reason is that food and energy prices are more volatile than other PCE components.
The PCEPI index includes deflator (the so-called PCE deflator) to calculate the real changes in consumer inflation. The Federal Reserve in 2012 decided that the PCEPI is the main indicator of inflation. This means that the FED prefers PCEPI over CPI inflation. The reason is that:
- PCEPI better reflects changes in capital expenditure,
- The PCEPI covers a larger proportion of expenditure than the CPI.
The PCEPI is more flexible than the CPI. This better reflects changes in consumer habits.
Of course, the PCEPI is not a single measure of inflation. Among the popular measures of inflation you can use PPI (Producer Price Index) or GDPPI (Gross Domestic Product Price Index).
The PCEPI is visible in the data published by the BEA, which bears the name Personal Income and Outlays and is posted on the government website bea.gov. According to data for June 2023 (latest current data), the PCEPI index increased by 0,2% m/m. Including the prices of goods fell by 0,1%MoM, while the prices of services increased by 0,3%MoM. It is worth noting that food prices fell by 0,1% m/m, while energy prices increased by 0,6%.
It is also worth looking at the data on an annual basis. According to them, the price index based on PCE increased y/y by 3,0%. However, after excluding food and energy price changes from the index, the PCEPI amounted to 2023% in June 4,1. The prices of goods fell by 0,6% y/y, while the prices of services increased by 4,9%. It is worth mentioning that food prices increased by 4,6% y/y, while energy prices fell by as much as 18,9%. It was the change in energy prices that caused the PCE-based inflation rate to fall sharply.
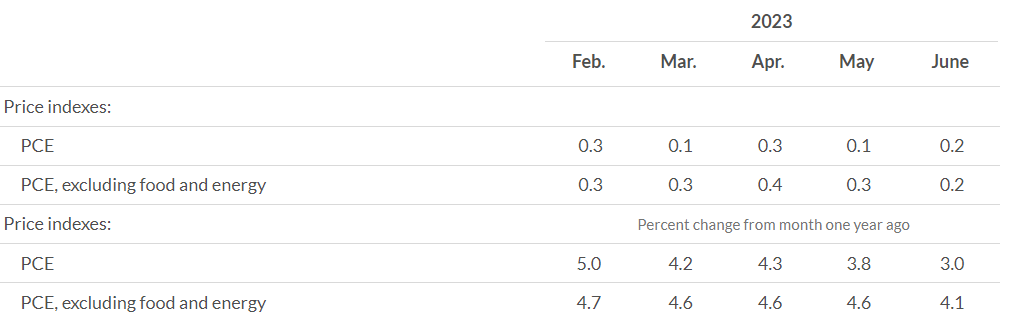
Source: BEA
Summation
The PCE index is a very important macroeconomic measure, which informs approximately how the spending of American households developed. The importance of the indicator was noticed by Federal Reservewhich added the PCE-based inflation index (the so-called PCEPI) to the group of measures affecting monetary policy. PCE is a good measure of the financial health of American households. Declines in PCE mean that American citizens have to cut back on spending, which is a sign of worse consumer sentiment. They may be caused by an increase in unemployment or a decrease in income, e.g. from assets held by households.
The PCE indicator is very detailed. Provides data on over 200 subcategories. So you can find out how the sales of bicycles, bicycle accessories and photographic equipment developed. It is a mine of knowledge both for economists and investors in American companies.
The indicator is not without flaws. Data revisions have become a tradition. As a result, some capital market participants are very skeptical about the first indications published by the BEA agency, which is worth remembering.


