


"Soft Pivot" in front of us? Sector and factor indices, GDP for Q3 in the US

The past week turned out to be the second positive month for the equity markets in a row. Bonds, oil and the US dollar weakened as well. A typical "risk-on", i.e. a period of growth of risky assets, although the strong increases in the US indices on Friday were not confirmed by the rising yields of treasury bonds on that day.
In the US, we also got to know the first GDP reading for the third quarter of this year. (+ 2,57%) that in detail he was not so optimistic anymore. Recently, there has been a growing narrative about the impending, or even just occurring, "pivot" of central banks. This is not the first time this year the market would like to see this famous "pivot", but we will rather have to wait for the real one.
Another positive week for the S & P500
Last week was successful for the majority of equity indices in the world. S & P500 index increased by 3,95%, and is already 9,1% above the low of 12.10.2022/50/100. (the index broke the 5,9-session moving average and approached the 8,6-day one). For comparison, the WIG increased by 12.10.2022% in the past week and is 50% above the low of October 100, 8. (it broke the XNUMX-session average, but was above the XNUMX-day average it was last time in January this year). Certainly, dovish "leaks" from the FED in reducing the pace of interest rate hikes, dovish messages from central banks in Australia, Canada and Europe, the upcoming mid-term elections to Congress (November XNUMX) are helping in the continuation of the rebound in the stock markets, and also the excessive pessimism of investors from a few weeks ago (as usual, the more investors' sentiment deviates either positively or negatively, the easier it is for the market to move in the opposite direction).
Nevertheless, the market regime remains the same in the medium term: the most important for investors is the US central bank of the Fed (when he changes the monetary policy bias to dovish), and for the Fed, the most important thing is inflation (as long as the situation allows it, the priority is to make sure that inflation will move "permanently" towards the target, ie to 2%). Today, this is the paradigm of the functioning of the market and the Fed. In other words, the market as a whole may currently ignore signals such as falling corporate earnings or an impending recession (pending). And the FED may ignore falling stocks and a slowing economy (pending). A possible soft pivot of the Fed in the near future remains a risk for such a paradigm - more on this later in the report.
W.1 S & P500 index until October 28.10.2022, XNUMX:
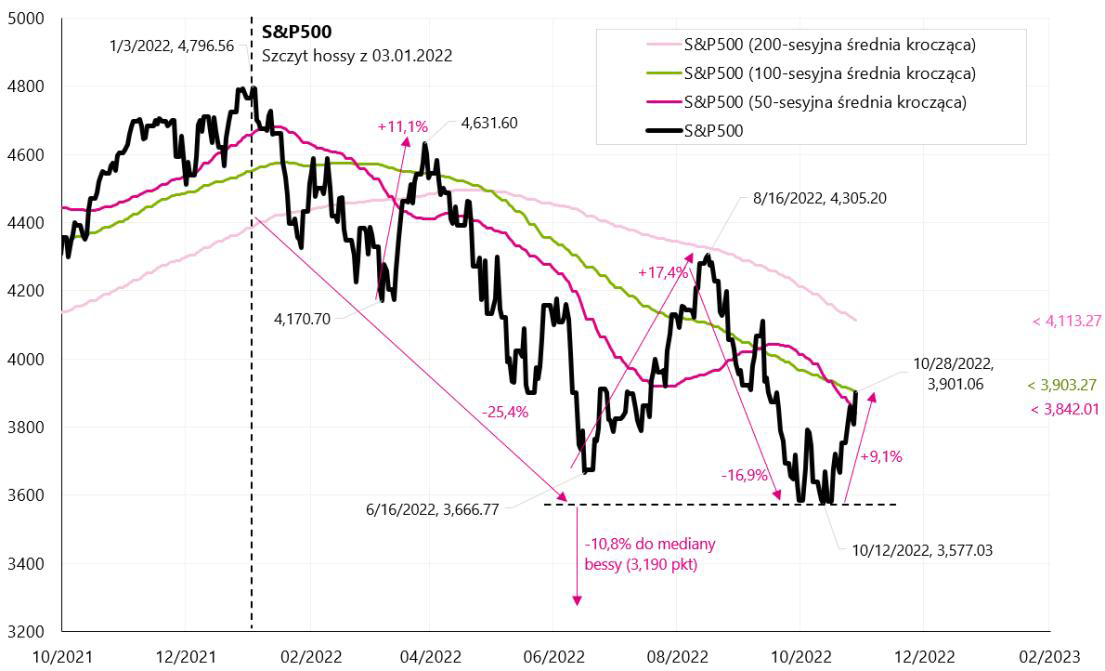
Source: own study, stooq.pl
W.2 WIG index until October 28.10.2022, XNUMX:
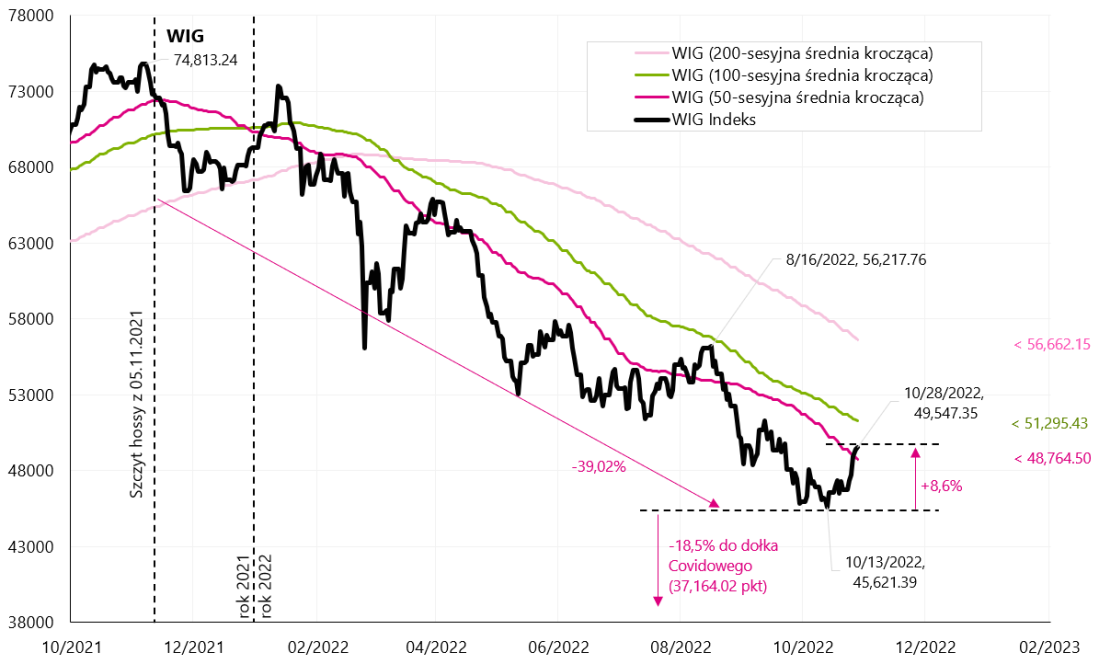
Source: own study, stooq.pl
Sector and factor indices
One thing about capital markets is that they are usually the fastest-reacting "leading indicators" to future changes in trends in the economy. Only then can we look at leading indicators from the real economy. For example, the stock markets give us very early signals not only in the form of a general decline / increase in equity indices, but also in the form of changes in industry indices or changes in the so-called factor indices (taking into account various "factors" related to investing, such as momentum, quality or size of companies - more on this topic in a moment). First, let's look at the main industries for the S & P500 index, expressed in adequate terms ETFs.
W.3 Main industries for the S & P500 index, change from the beginning of the year:
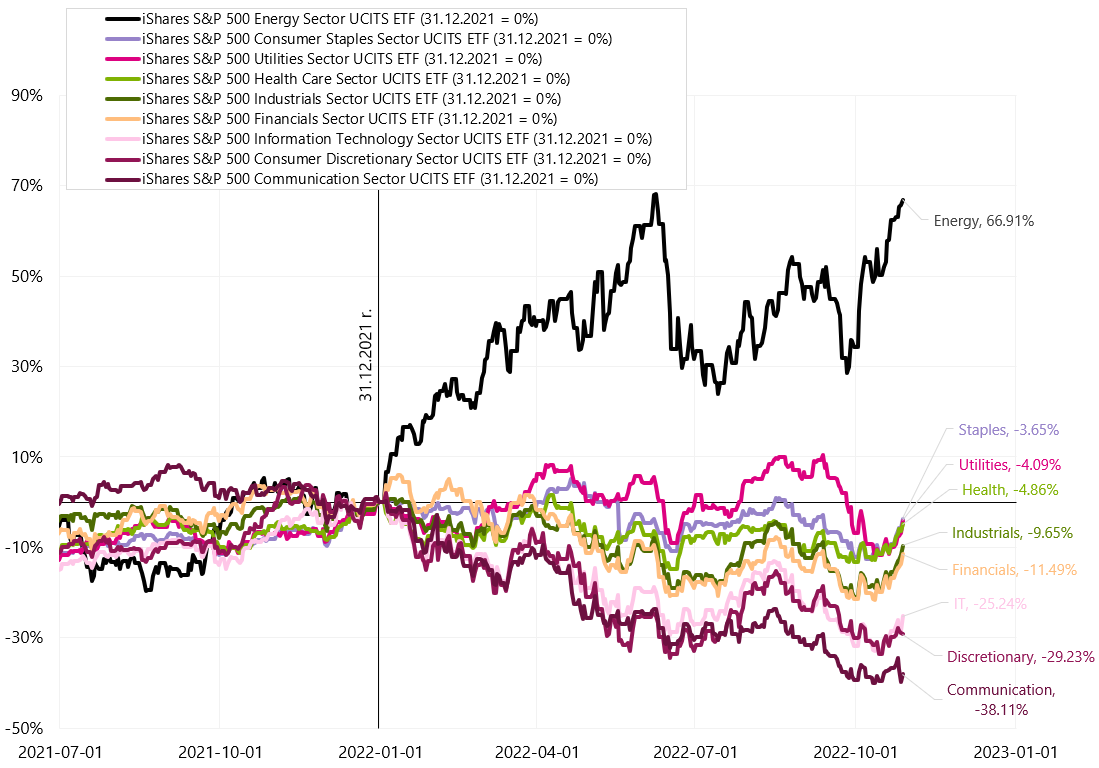
Source: own elaboration, ishares.com
The Energy sector is mainly related to the extraction / production of oil and gas. It naturally benefits from the high prices of raw materials, the energy crisis and the war in Europe. The three largest companies (over 50% of the index) are Exxon Mobil, Chevron and Conocophilips. Sectors such as Consumer Staples (basic consumer products), Health Care (healthcare) and Utilities (utilities) are doing book-like this year, giving higher rates of return than other industries (typical for slowdown / recession). Their worse behavior in relation to cyclical industries may be the first signal of a possible change in the cycle.
Cyclical industries (more sensitive to changes in economic growth) include Information Technology, Industrials, and Consumer Discretionary. The two largest companies in the Communication sector index are Alphabet (Google) and Meta (Facebook). Alphabet is relatively sensitive to declines in ad revenue (its shares are around -34% this year), and Meta, with its many problems, has fallen by 70% this year.
Let's also see how individual industries behave from the local low of October 12.10.2022, 3,3, and we already have quite large differences in rates of return, despite the fact that it is only two and a half weeks. The strongest rebound is in the Financials sector (high interest rates "for longer"), while the Consumer Discretionary luxury / discretionary sector grew by only 0,72% (a weak American consumer does not bode well for an economic rebound). If we look at last week, Consumer Discretionary only grew by 6,1%, while Consumer Staples increased by XNUMX%. Certainly, the analysis of the behavior of individual industries can give us interesting conclusions as to the prospects of economic rebound as thought "market".
W.4 Main industries for the S & P500 index, change from the last trough of 12.10.2022/XNUMX/XNUMX:

Source: own elaboration, ishares.com
In the case of factor indices, the two best known "factors" are Growth (companies with high increases in profits and revenues) and Value (companies relatively cheaper than their foundations). Investing in Growth companies (and not Value) became very popular and profitable in the previous bull market in 2009-2021. From December 31.12.2006, 03.01.2022 to January 500, 422, the S & P104 Growth index earned four times more than the comparable Value index (XNUMX% vs. XNUMX% compared to the indices presented in the next chart).
W.5 S & P500 Growth, S & P500 Values and Relative Strength Chart from 2007:

Source: own study, stooq.pl
Growth companies (in addition to stronger growing profits and revenues) can additionally benefit from structurally low economic growth and low interest rates. Why is this happening? Because they grow fast, a relatively large proportion of the profits they generate is "far in the future" (eg in 5-10 years). Investors use the interest rate (to discount these gains) to price these distant gains. The lower the interest rate, the higher the present value of the future earnings of Growth companies. This is exactly what happened in 2009-2021 (generally, for a large part of this period, rates were at the "zero" level).
In the case of Value companies, it is exactly the opposite. They 'generate' more value for investors in an environment of higher economic growth, higher inflation and higher interest rates. But historically (even going back to the 20s), Value companies generally gave higher rates of return than Growth companies. The previous bull market is rather an exception from a historical perspective.
W.6 S & P500 Growth, S & P500 Value and the Relative Strength Chart:
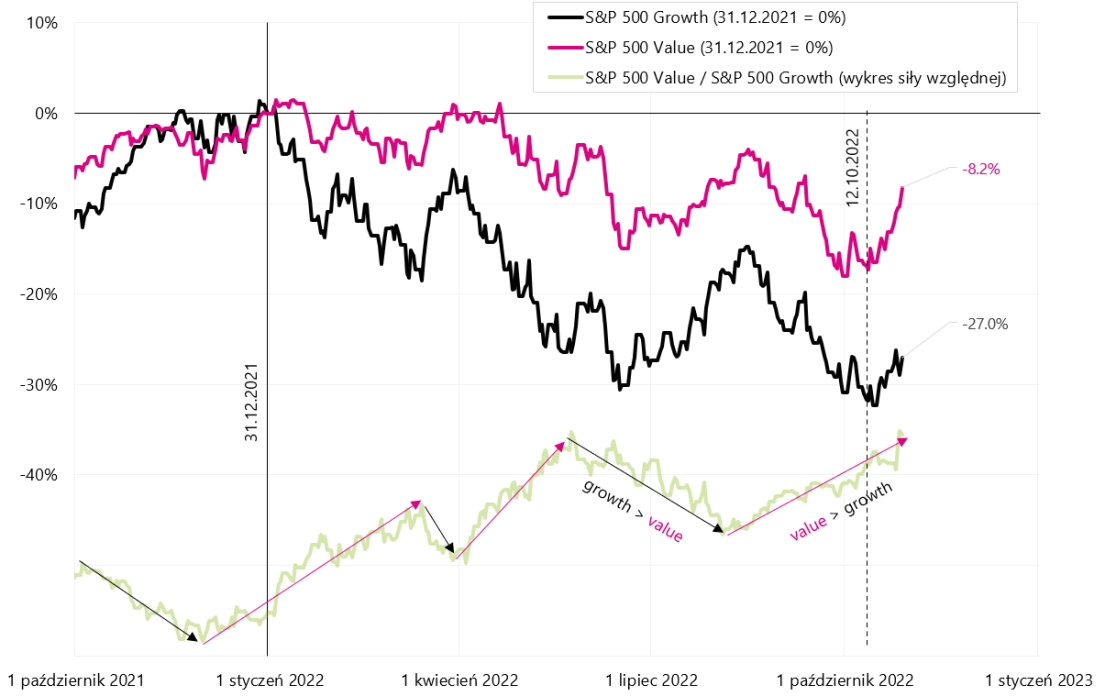
Source: own study, stooq.pl
The situation in 2022 looks interesting when Value companies definitely "win" (no wonder because we are in an environment of high inflation and high interest rates). The current rebound from the bear market on October 12, this year, when the Value companies de facto rebounded more than the Growth companies, looks even more interesting. It's only a 2-week rebound, but it can be interpreted that investors are not so quick to believe in the prospect of rapidly declining inflation and lower interest rates, which would generally lower the attractiveness of Value companies' profits in favor of Growth companies.
The situation is certainly observable, because if inflation turns out to be temporary (from the perspective of the entire cycle, i.e. several years rather than several months), it could also be possible to return to the regime of much better behavior of Growth companies in the next bull market. Apart from Growth and Value, we also have other "factors". For example, the most common are Momentum (rising share prices), Volatility (companies with lower volatility), Size (small companies), Quality (companies with a "strong" balance sheet, i.e. low debt and stable profits), Dividend Yield (companies with higher from average dividend levels).
W.7 Selected factor indices for the American market:

Source: own elaboration, ishares.com
Interestingly, in the case of the Quality factor (companies with historically stable and solid profits), the largest industry is Information Technology (26%), followed by Health Care (15,8%). In contrast, in the case of Momentum, we have the highest exposure to Health Care (30%), followed by Energy (22%). From the market low of 12.10, the strongest increases were recorded on the Momentum factor (+ 10,2%), and the smallest on the Small Size companies (+ 7,97%).
GDP for Q3 in the US
We have learned the first estimate of American growth CBA for the third quarter of this year. Quarter-on-quarter (in annual terms) GDP grew by as much as 2,57%. It looks like a strong acceleration of growth, especially as the two previous quarters in a row had a decline in GDP. But as always, the devil is in the details. The chart below shows GDP at constant prices in trillions of dollars. After the pandemic, we returned to the trend line, but only for a while.
W.8 US GDP at constant prices:

Source: own study, FRED
Sometimes GDP growth is given as a year-on-year change, but this is already relatively "old" information, so it is best to compare the change quarter to quarter, and it is customary to give quarterly changes on an annual basis. We show both measures in the next chart. As can be seen in the chart, GDP growth in the first two quarters of 2022 was negative.
W.9 US GDP at constant prices, year-on-year and quarter-on-quarter yearly changes:

Source: own study, FRED
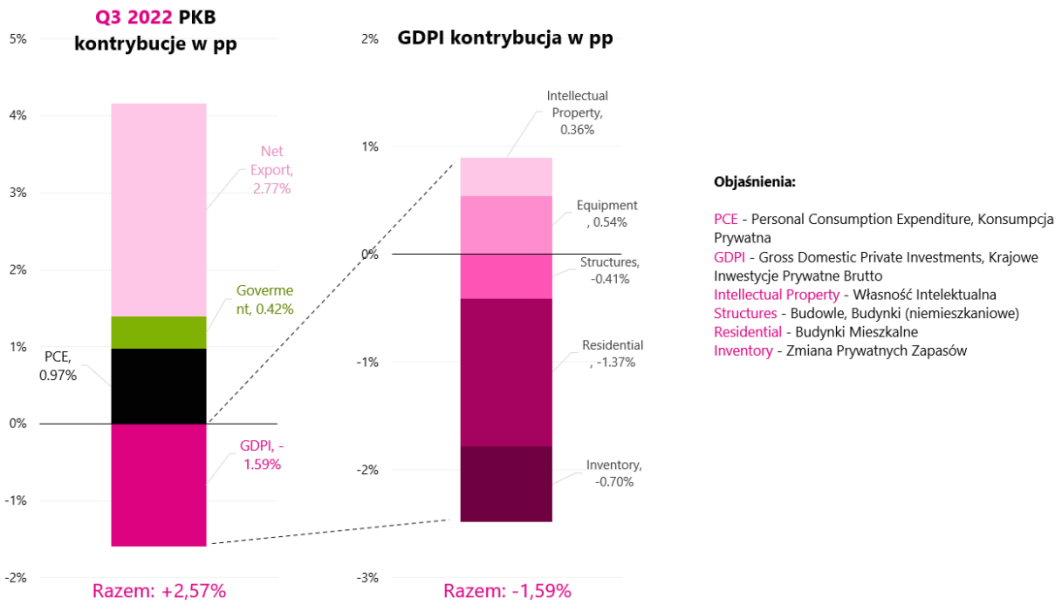
Now let's check what constitutes 2,57% of GDP growth in Q3 2022, i.e. what impact the main components of gross domestic product had on growth (what contribution of change). Details are presented in the next chart.
W.10 Contributions to GDP change in Q3 2022:
Source: own study, FRED
The left column is the contribution of the four main components of GDP in percentage points. As we can see, net exports added as much as 2,77 percentage points, while the entire GDP grew by less than 2.57% (contribution of net exports above 100%). Such a high impact was due to both lower imports and higher exports (including exports of petroleum products and industrial products to Europe in connection with the energy crisis and war). What draws attention is the decline in Residential investments in Q3 at an annual rate of -26,4%, which gave a contribution to the entire GDP change as high as -1,37 percentage points.
The decline in this segment is a consequence of, inter alia, rapidly rising interest rates, followed by mortgage rates (not to mention other factors such as an increase in loan spreads or tightening creditworthiness criteria). Private consumption added 0,97 percentage points and grew in Q3 at the annual rate of 1,4% (in Q2 it was 2,0% and in Q1 1,35%).
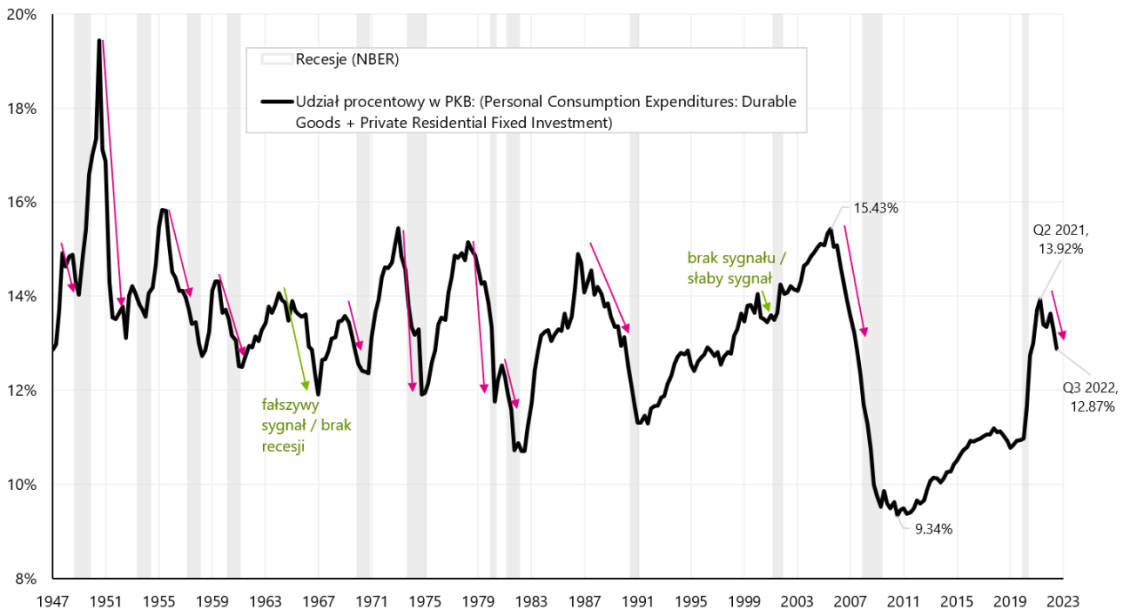
We can divide GDP into two main parts: cyclical and non-cyclical. The recurring category includes Residential and private consumption / expenditure on Durable Goods. The cyclical part of GDP is "anticipatory" and may be one of the sources of warning us against the upcoming slowdown / recession. The next chart shows the total percentage of Durable and Residential Goods expenditure in total GDP.
From 1947, the share of Residential spending in total GDP ranged from 2,4% to 7,3% (4,62% on average), while in the case of Durable Goods from 6,9% to 12,1% (8,42% on average). Virtually before each recession, the share of these two components begins to decline (the exception was 2001), which is how cyclical expenditure should behave. Currently, the cyclical part has been declining for 5 quarters and continues to decline both in the Durable Goods (which "increased" artificially during the pandemic) and Residential (prohibitive costs of financing mortgage loans). Hence the conclusion that in the coming quarters the cyclical part of GDP (almost 13% of the total) may weigh on economic growth.
W.11 The share of spending on Residential and Durable Goods in US GDP since 1947:
Source: own study, FRED
"Soft Pivot" in front of us?
Recently, a narrative appeared on the market that we are dealing with a "pivot" of central banks. Starting with the Central Bank of Australia, then Canada and ending with The European Central Bank - in each case we had more dovish communications pointing to the need to reduce the pace of interest rate hikes. November 2 this year. we will also be able to get to know the latest communication in this regard by the American Fed.
A real pivot could mean the end of a bear market, so let's take a look at some basic arguments for and against.
Main arguments against:
- ahead of the Fed and so there are still 6-7 rate hikes (counting 0,25),
- even a pause in increases or the end of increases does not have to mean the beginning of interest rate cuts (too early cuts are the main mistakes from the 70s),
- interest rate cuts do not have to mean market increases / the end of a bear market in the medium term (I recall the market reactions to the Fed rate cut - from January 2001), similarly, interest rate cuts in 2008 did not stop stock declines,
- historically, in order to beat inflation, interest rates usually had to rise above the inflation rate or above nominal GDP growth,
- US core service inflation has not shown any signs of weakening yet.
The arguments for a possible pivot in the near future are:
- "Hills" on inflation, FED rates, bond yields, as well as the dollar are very close,
- inflation has the right to drop significantly next year (this is also how the market evaluates it),
- central banks see economies susceptible to high interest rates and are therefore ready to pivot.
What is the balance of these arguments for and against? In my opinion, it is too early for a real pivot, but if central banks decide on some form of "soft pivot" for various reasons, the markets will have to react and price their dovish attitude. This may mean increases in stocks and bonds, but in the medium term, inflation data will still decide. Certainly, the FED meeting next week will also be important in terms of a possible pivot.
Summation
US stocks ended the week in very good moods, although strong Friday's gains were not confirmed by bond markets (we had yield gains on Friday). Further market hopes for the "pivot" of central banks may be too early (at least for the real one). Even if the central banks (and mainly the FED) would decide to do so for a stronger turn towards the dovemarkets will have to price it in (bond and equity gains at least in the short term). But in the longer term, the inflation figures will decide anyway.
About the Author
 Jaroslaw Jamka - Experienced fund management expert, professionally associated with the capital market for over 25 years. He holds a PhD in economics, a license of an investment advisor and a securities broker. He personally managed equity, bond, mutli-asset and global macro cross-asset funds. For many years, he managed the largest Polish pension fund with assets over PLN 30 billion. As an investment director, he managed the work of many management teams. He gained experience as: Member of the Management Board of ING PTE, Vice-President and President of the Management Board of ING TUnŻ, Vice-President of the Management Board of Money Makers SA, Vice-President of the Management Board of Ipopema TFI, Vice-President of the Management Board of Quercus TFI, Member of the Management Board of Skarbiec TFI, as well as Member of Supervisory Boards of ING PTE and AXA PTE. For 12 years he has specialized in managing global macro cross-asset classes.
Disclaimer
This document is only informative material for use by the recipient. It should not be understood as an advisory material or as a basis for making investment decisions. Nor should it be understood as an investment recommendation. All opinions and forecasts presented in this study are only the expression of the author's opinion on the date of publication and are subject to change without notice. The author is not responsible for any investment decisions made on the basis of this study. Historical investment results do not guarantee that similar results will be achieved in the future.


