


S&P Global - it's not only a rating agency

The abbreviation S&P is probably associated with every person who is at least a bit interested in capital markets. It's hard to overlook the name of the most important index of the US market: S & P 500. The owner of the rights to this index is S&P Global Inc. One cannot forget about the ratings, which have a great impact on global capital flows. Over 30 clients use the services of S&P. The company boasts that 000 out of 97 companies on the Fortune 100 list are S&P customers. Over 100 credit analysts work in the 31 countries where S&P has offices. The total number of lawyers is approximately 1.
The reputation of many credit rating agencies was undermined after the 2007-2009 crisis. Many of them had to pay fines for their oversights. An example is S&P, which had to pay $ 1,4 billion in fines a few years ago after losing a case to the Department of Justice (DOJ).
It is also worth mentioning that the company has been regularly increasing its dividend for over 46 years. Therefore, she is included in the group of dividend aristocrats. The company has a very interesting business model that is based on four legs. These are:
- Ratings
- Market intelligence
- Platts
- Indices
Rating
The rating activity is the most famous branch of the company's activity. S&P is an independent provider of credit ratings, analysis and market research. The task of setting ratings is to better inform the market about the financial condition of a given entity. This is key information for companies, governments, local governments and banks investing in bonds. Products such as ABS and CLO are also assessed. A rating change can have a large impact on global capital flows. It is worth recalling January 2016. Then the S&P agency lowered Poland's rating, which led to the weakening of the Polish currency.
The credit rating agency market is very concentrated. Three companies have the largest market shares: S&P, Moody's and Fitch. According to ESMA data, these three agencies had 92,1% market share in the European market. The remainder of the pie fell on 23 agencies that can provide such services in Europe. In the United States, the situation is similar. According to data collected by the NRSRO, the three leading agencies account for over 93% of the industry's revenues. At the same time, the three largest indivisible agencies rule the government market. The three largest agencies control almost 99% of the market. Out of this, S&P has over 50% share in this segment. In the "non-governmental" market, S&P, Moody's and Fitch also rule.
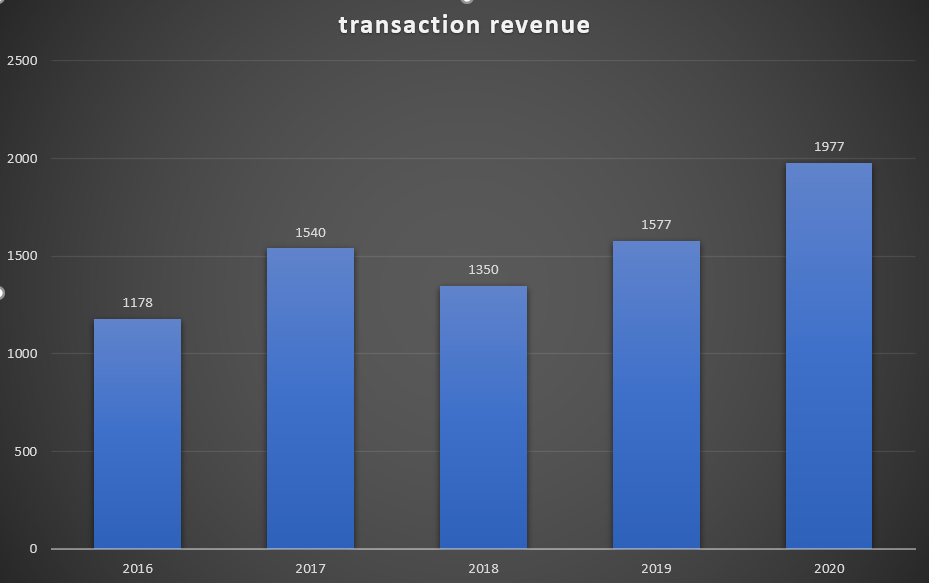
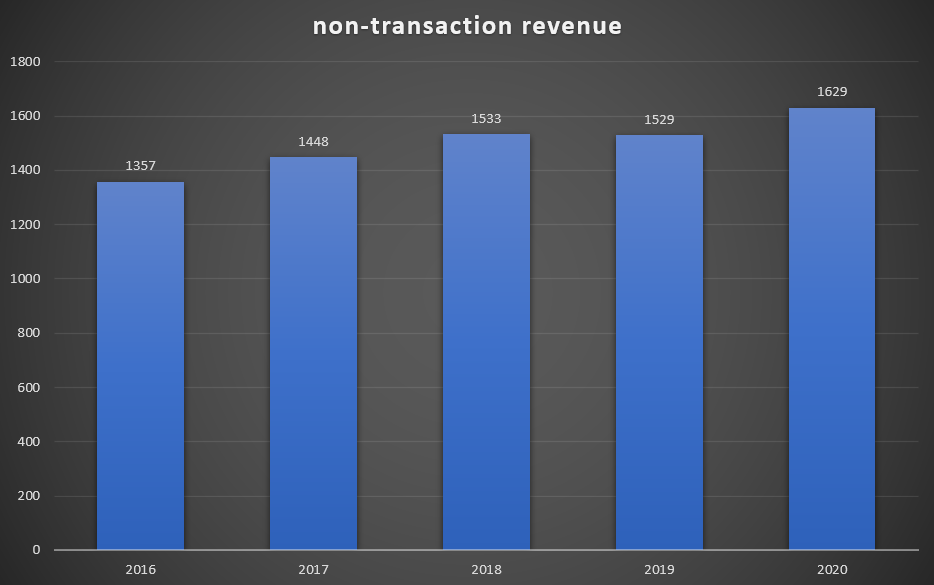
Income from this segment can be divided into transactional and non-transactional. Transaction revenues are related to determining the ratings of new issues of corporate, local and government debt and structured debt instruments. Non-transactional income relates to fees for monitoring credit ratings, annual fees under signed contracts, and fees for research and analysis for the subsidiary CRISIL.
Most often, credit rating agencies generate revenue based on fees charged to issuers for assigning a rating. At the time of the analysis, the agencies receive information from the issuers. Some of them are not available to the public. The more reliable the credit analyzes, the more reputable credit rating agencies have. However, a misjudgment of a particular company or financial instrument can tarnish the company's reputation.
Source: own study
The second source of income is the so-called subscriber fees. Credit rating agencies charge fees in exchange for providing information on credit ratings.
Source: own study
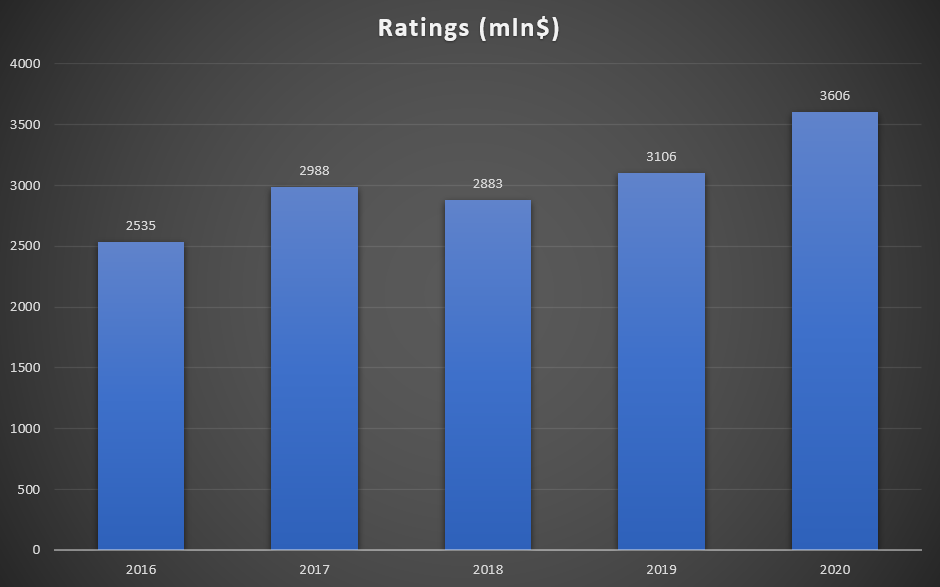
The Rating Segment generated revenues of $ 2020 billion in 3,6. This meant an increase by 16% y / y. This was a much greater increase than the average for 2016-2019, where the revenues of this segment grew by an average of 7% per year. The reason for such a good year was the recovery on the debt instruments market. It was one of the effects of the coronavirus. Disruptions in the operating activities of many enterprises resulted in the increased demand for loans in many companies. As a result, the demand for the services of rating agencies from bond issuers increased. This is evidenced by the sharp increase in transaction revenues of $ 1,9 billion. This type of income was about 25% higher than in the previous year.
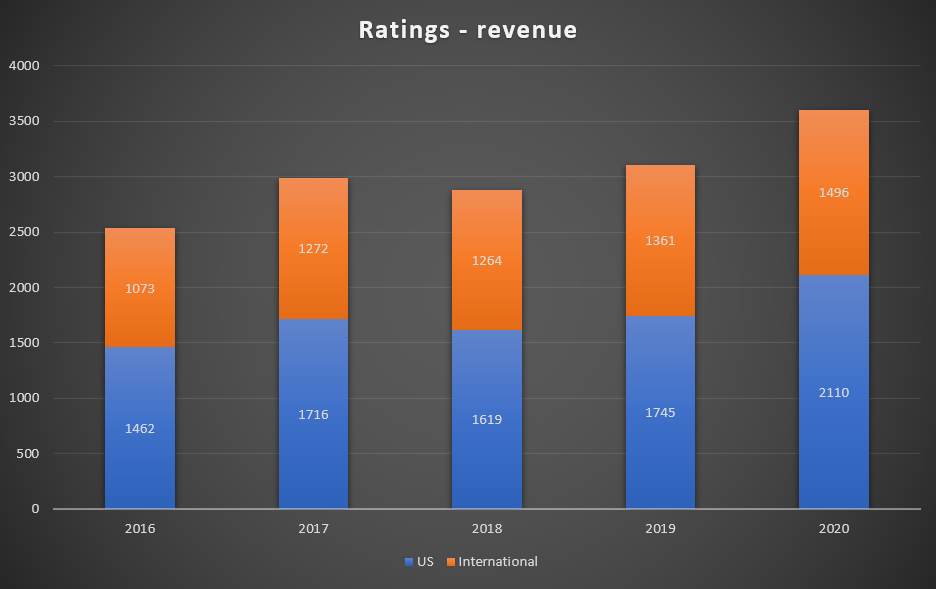
It is worth mentioning that this segment of the company did much better in the United States, where revenues increased by approximately 21% y / y. On the other hand, revenues in foreign markets increased by approximately 10%.
Source: own study
In 2019, S&P Global China Ratings obtained approval to operate in China. The subsidiary is wholly owned by S&P Global. So it is the first 12,5% foreign-owned credit rating agency in China. According to data from the Bank for International Settlements (BIS), the Chinese bond market is the second largest in the world. Its value is estimated at about $ 5,7 trillion (called Trillion). For comparison, the British market is estimated at $ 41,3 trillion, while the American market at $ 70 trillion. It is worth mentioning that in China, bank loans dominate (around 11% of the market), while bonds finance around XNUMX% of companies' borrowing needs. S&P also intends to develop in the ASEAN region (Malaysia, Indonesia, Philippines, Vietnam).
Source: own study
The Ratings segment is very profitable, according to the data provided by the company, S&P Global generates very high operating margins. Over the past few years, the company has managed to significantly improve the profitability of this segment.
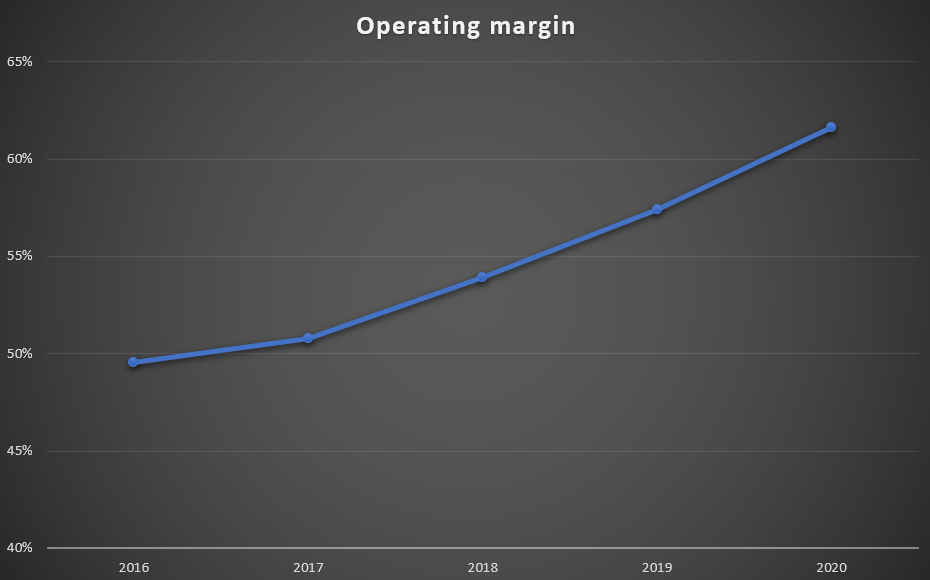
Source: own study
Market intelligence
Analytical solutions for professionals. S&P has divided them into three main product groups:
- Detescope - providing data, analysis and external research. Includes Market Inelligence Deteskop which it has on offer
o S&P Capital IQ (an extensive analytical tool providing models, analyzes and tools supporting the analyst's work) and
o SNL Detective (extensive sector analytics) - Data Management Solutions - offer of integrated collective data files that can be customized by the user. The offer includes, among others
o compustat (extensive database with standardized historical data, solutions for quantitative analysts).
o GICS (Global Industry Classification Standard) - created as a result of MSCI cooperation, it is a standardized sector classification of over 47 companies from 000 countries. A competitive solution is the ICB created by Dow Jones and FTSE.
o CUSIP - the solution belongs to the ABA (American Bankers Association) S&P manages 9 alphanumeric securities identification code (applicable in the US and Canada) - Credit Risk Solutions - providing rating data and analysis. Includes subscriptions for solutions such as:
o RatingsDirect - also available on S&P Capital IQ, provides a visualization of the debt portfolio and extensive information on the creditworthiness of companies and governments.
o RatingsXpress - solutions helpful in backtests of credit risk models, creating a benchmark for internal models, assessing counterparty risk.
o Credit Analytics - interactive benchmarks, rating history, access to fundamental and credit analysis. Solutions available on S&P Capital IQ.
The revenues of this segment depend mainly on subscription fees. Thanks to them, clients have access to analyzes and data as well as external reports. Mainly customers choose to access data via web channels, such as Market Intelligence Deteskop, RatingsDirect, RatingsXpress or Credit Analytics. Non-subscription revenues usually come from consulting and analytical services.
The Market Intelligence segment generated revenues of $ 2020 billion in 2,1. This meant an increase by 7,5% y / y. This was a much greater increase than the average for 2016-2019, where the revenues of this segment grew by an average of 5,7% per year. One of the reasons for the increase in revenues was the acquisition of 451 Research and good sales of such company's products as RatingsXpress®, RatingsDirect®, CUSIP.
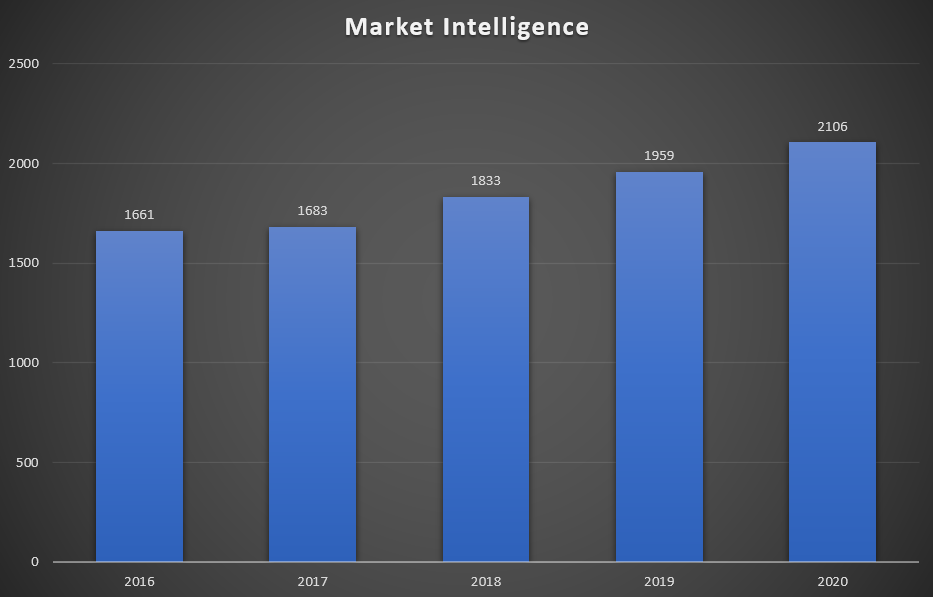
Source: own study
It is worth mentioning that approximately 64% of this segment's revenue is generated in the United States. Over the past 5 years, the share of American customers in the segment's revenues has decreased by 4 percentage points.
Source: own study
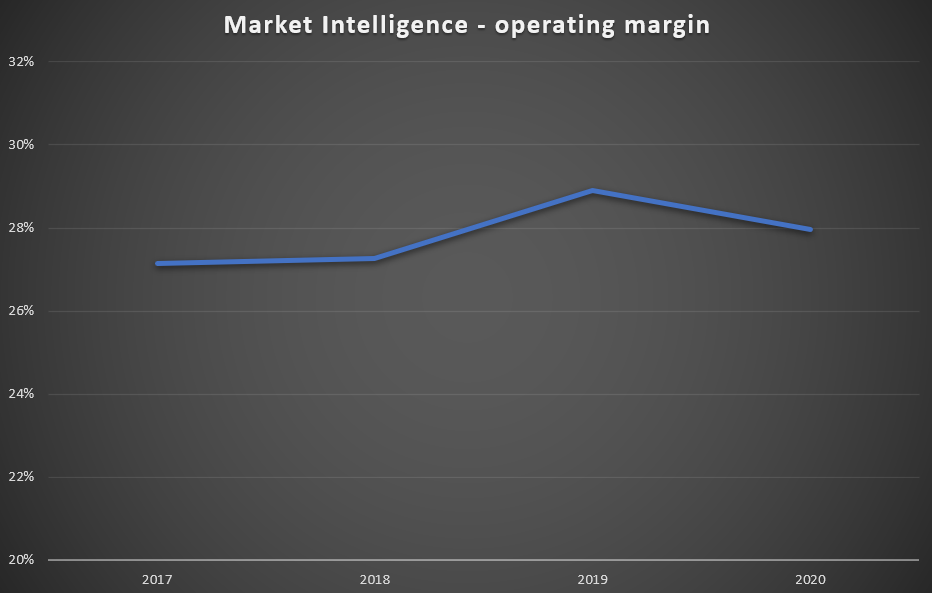
Market Intelligence has the lowest operating profitability of all segments of the company's activity. In recent years, its profitability has fluctuated between 27% -28%.
Platts
In this segment, S&P provides price information, indices and benchmarks for the raw materials and energy markets. Platts also provides extensive data on the raw materials market. The activities of this segment are to increase the transparency of the raw material market. The main clients of S&P Global Platts are producers, traders, intermediaries in the energy, petrochemical, metal and agricultural products markets.
The company generates revenues from three sources. The first is subscription fees for access to the latest information and market data. Another type of royalties for licenses entitling to use market data prepared by S&P Global Platts. The last group of revenues depends on one-off events such as conferences or consultations. For more than two years, subscription revenues have been the most significant, accounting for approximately 92% of sales generated by the Platts segment.
Source: own study
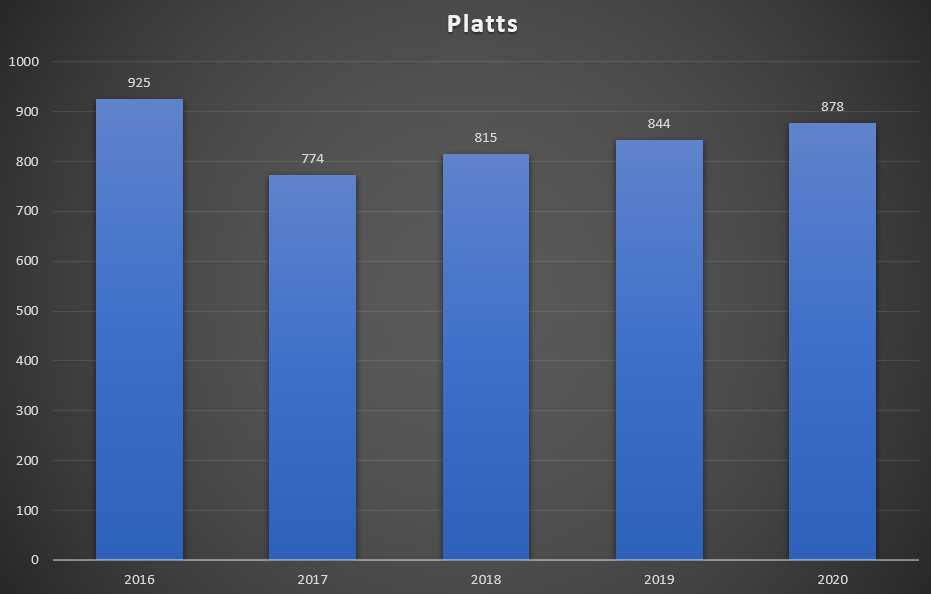
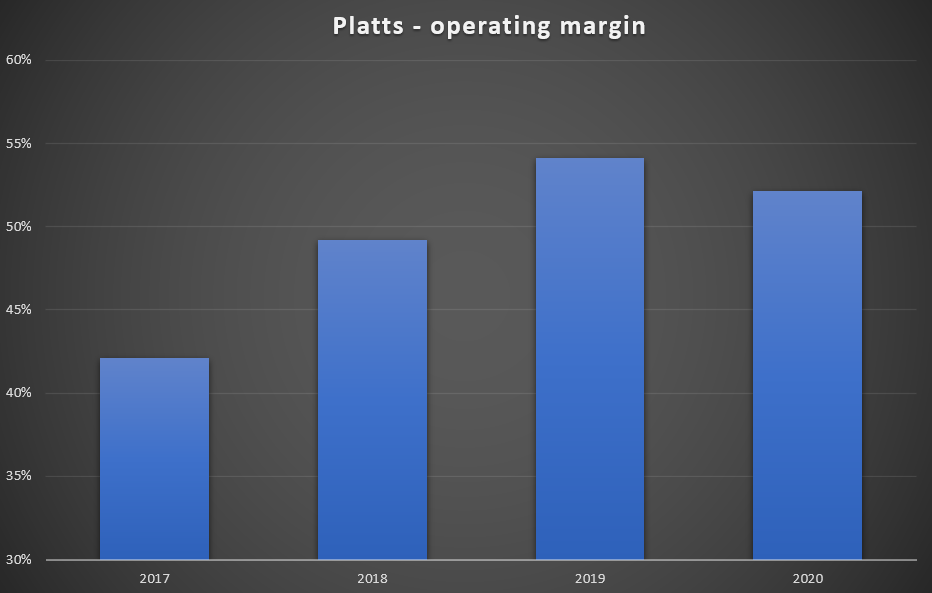
The Platts segment generated revenues of $ 2020 million in 878. This meant an increase by 4% y / y. It is worth mentioning that in 2019 the sales of this segment increased by 3,6% y / y. The decrease in sales in 2017 was due to the sale of shares in JD Power (September 2016). The increase in revenues resulted, among others, from from the impact of the acquisitions of Enerdata and Live Rice Index. Part of the increase in revenues was due to the increase in prices for access to data. It is worth mentioning that the profitability of Platts' business has improved significantly in recent years.
Source: own study
Indeks
S&P Dow Jones Indices is one of the largest index providers in the world. It is the "big three" players that also include FTSE Russell and Msci. According to data collected by Burton-Taylor International Consulting, these three entities control over 70% of the market share.
S&P Global Inc owns 73% of S&P Dow Jones Indices, while CME Group (24,4%) and Dow Jones & Company (2,6%) had minority interests at the time of the establishment of S&P DJI. Please note that after 2017 CME has the right to sell the remaining shares in S&P DJI at any time. On the other hand, S&P Global Inc is obligated to buy back at least 20% of its shares. One of the most recognizable indices quoted by the company is Dow Jones Industrial Average, S&P 500, S&P 100, S & P 400. In addition, the offer includes many thematic indices, such as ESG or real estate market indices.
Revenues from this segment come from 4 sources:
- The first are fees resulting from the size of the assets of investment products (ETFs, funds) based on S&P DJI indices,
- Royalties depending on the volume of futures contracts and options based on S&P indices,
- Index license fees - fixed or variable fees linked to indexes (this applies to over-the-counter products),
- Fees for specialized indexes, reports and portfolio analysis.

Source: own study
Products generating revenues based on the amount of assets under management (AUM) have the largest share in this segment. This type of revenue grew in 2016-2020 by an annual average of 14,2%. It is worth mentioning that AUM-based fees generate about 65% of the segment's revenues, which means an increase of 6 percentage points from the end of 2016.
It is the most profitable business for S&P Global. The operating margin in 2020 exceeded 67%. The mentioned segment is another cash machine.

Source: own study
Management
Douglas L. Peterson - CEO of S&P Global - associated with the company for over 10 years. In the years 2011 - 2013 he worked as President at Standard & Poor's. However, in 2013 he was promoted to CEO of the entire company - S&P Global. Before working at S&P, he was associated with Citibank for 25 years. For over 6 years he was, among others CEO of Citigroup Japan and for almost 2 years the COO of the entire company.
John Berisford - S&P Global Ratings - has been working at S&P Global since 2011. Previously, he worked for 22 years at PepsiCo, where he participated, inter alia, in projects related to the integration of Pepsi with the acquired bottling plants (Pepsi Bottling Group). In S&P he was responsible, inter alia, for the implementation of the McGraw Hill restructuring plan, among others by selling McGraw Hill-Education.
Dan Draper - CEO of S&P Dow Jones Indices - since June 2020, he has been working at S&P Global as CEO of S&P Dow Jones Indices. Before working at S&P, he worked for 6 years as Managing Director in Invesco US, where he was responsible for the entire area of ETFs and funds. He also worked in companies such as Credit Suisse and Lyxor, where he was also responsible for the development of the ETF offer.
Martin L. Cheung - President S&P Global Market Intelligence - since 2010 he has been working at S&P in various positions. She worked, among others as CSO (Chief Strategy Officer), where she created a medium and long-term company strategy. Since 2016, she has been associated with S&P Global Market Intelligence.
Saugat Saha - from January 2021 he is the head of S&P Global Platts. He has been working for S&P Global for almost 8 years. Before working at S&P, he worked for 7 years at McKinsey & Company.
Shareholding structure
S&P Global Inc does not have a concentrated shareholder structure. However, it is dominated by financial institutions that control a significant part of shares through their investment funds or ETFs. Below is a list of the 4 largest shareholders of the company:
| Shareholder | % of shares |
| Vanguard group | 8,40% |
| Blackrock | 7,28% |
| State Street | 4,52% |
| Price T Rowe | 2,86% |
Fundamental analysis
S&P Global is a very stable and profitable company. Having a very strong market position in the segment of indices and ratings means that the company has a very strong moat. At the same time, the market itself is characterized by high entry barriers (legal, reputation, scale of operation), so that the newly emerging competition is not yet able to threaten the big three of the rating market and the big three index providers.
Financial results
The company, due to its reputation and the industries in which it operates, can achieve very good margins on operating activities. It is also worth mentioning that the company manages its capital very effectively, which can be seen in the very high return on equity. It is also worth mentioning that the return on invested capital (ROIC) fluctuated between 28% -30%.
| $ million | 2017 | 2018 | 2019 | 2020 |
| Net revenues | 6 063 | 6 258 | 6 699 | 7 442 |
| operational profit | 2 751 | 2 961 | 3 159 | 3 867 |
| operating margin | 45,37% | 47,32% | 47,16% | 51,96% |
| net profit | 1 496 | 1 958 | 2 123 | 2 339 |
| equity capital | 2 118 | 2 304 | 2 804 | 3 352 |
| ROE | 70,63% | 84,98% | 75,71% | 69,78% |
| Earnings per share (EPS) | 5,78$ | 7,73$ | 8,60$ | 9,66$ |
Cash generated
The company generously shares the generated cash with shareholders. Over the past 4 years (2017-2020), S&P Global Inc. generated approximately $ 10 billion in free cash (cash generated from operating activities less capital expenditure). The generated cash was used for acquisitions, dividends and share purchases.
Within four years, the company has allocated to:
- acquisitions of $ 776 million,
- dividends of $ 2 million
- stock purchases of $ 5 million
Due to the fact that the FCF was higher than the cash returned to shareholders and acquisitions increased the level of cash during the period under review by $ 1,7 billion.
| $ Million | 2017 | 2018 | 2019 | 2020 |
| OCF | 2 016 | 2 064 | 2 776 | 3 567 |
| CAPEX | - 123 | - 113 | - 115 | - 76 |
| FCF | 1 893 | 1 951 | 2 661 | 3 491 |
| acquisitions | - 83 | - 401 | - 91 | - 201 |
| dividend (-) | - 421 | - 503 | - 560 | - 645 |
| share buyback (-) | - 1 050 | - 1 726 | - 1 306 | - 1 225 |
Debt structure
At the end of 2020, S&P Global had $ 4,1 billion in long-term interest debt. The company's liquidity position in the coming years is very good. However, it should be remembered that the company will soon take over IHS Markit, where the transaction will amount to $ 44bn, of which $ 4,8bn is the acquired net debt of IHS. Below is a list of potential liability payments:

Source: company's annual report for 2020
S&P Global has no problems with debt management. It is also worth comparing the ratio of nominal net debt to EBITDA, which is very low. The company therefore has room to increase its debt to finance the acquisition of IHS Markit.
| $ Million | 2017 | 2018 | 2019 | 2020 |
| net debt * | 780 | 1 727 | 1 786 | 637 |
| EBITDA | 2 931 | 3 167 | 3 363 | 4 073 |
| debt / EBITDA | 0,27 | 0,55 | 0,53 | 0,16 |
Acquisition of IHS Markit
In November 2020, S&P Global announced its plan to acquire IHS Markit. The transaction is expected to amount to approximately $ 44 billion. IHS Markit shareholders were to receive shares in the newly established company. As a result, they will hold over 32% of shares in the merged company. The merger of the companies is to generate synergies in the form of a revenue increase of $ 350 million and cost synergies at the level of $ 480 million. IHS Markit generates approximately 88% of repeat revenues (subscriptions etc.). For comparison, S&P Global generates 69% of this type of income. The takeover of IHS will allow to supplement the company's offer in such areas as indices, analytics and market data.
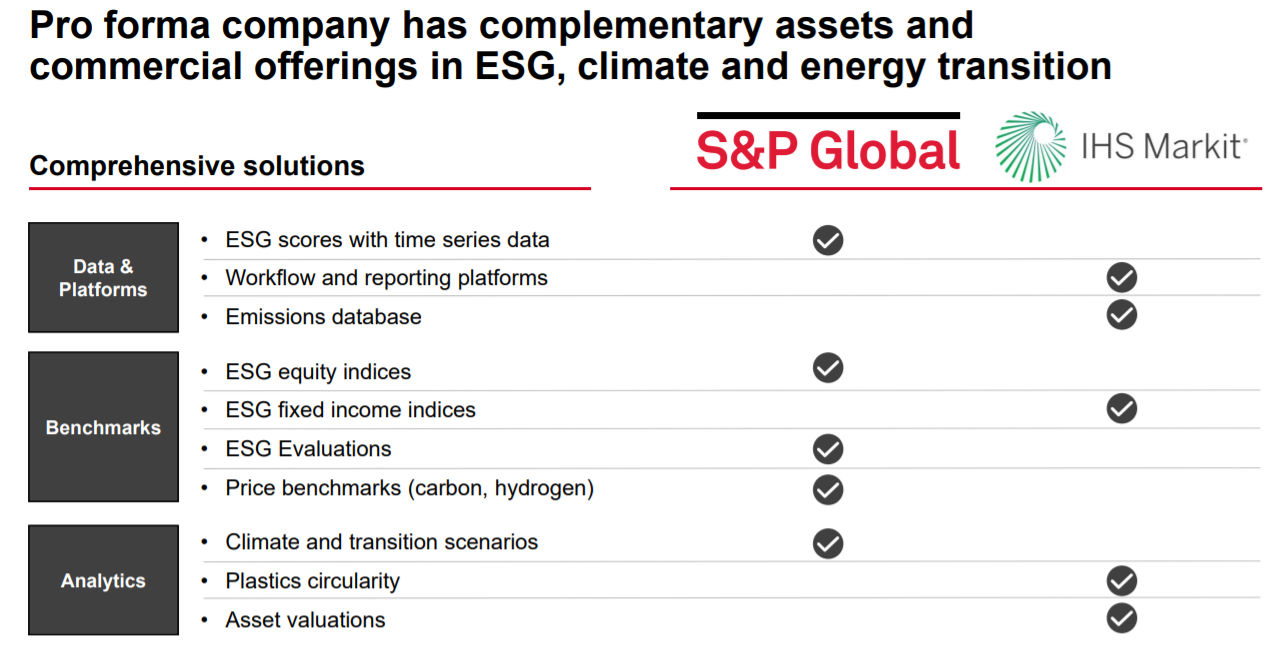
Source: S&P Global presentation
S&P Global has received approval to merge with IHS Markit. At the same time, part of the HIS business had to be sold to competitors. We are talking about the PRA segment (Price Reporting Agency). The following projects will be sold: OPIS (Oil Price Information Serices), CMM (Coals, Metals and Mining) and PVC (PetrochemWire).
To win approval for the deal, the companies agreed to sell three of IHS Markit's price reporting agency (PRA) businesses. The department said the businesses are: Oil Price Information Services (DESCRIPTION); Coals, Metals, and Mining (CMM); and PetrochemWire (PVC).
Competition
Due to the fact that the company has a very diversified activity, it has a lot of competition that competes with the company in individual segments. For example, MSCI is competing with S&P Global in the indexes segment. Below is a brief summary of selected competitors listed on the public market.
Moody's Corporation
The history of the company dates back to 1909, when it was founded by John Moody. It is now the main competitor of S&P in the rating segment. Moody's belongs to the "Big Three" among rating agencies. In addition to the rating segment, Moody's Corporation also provides analytical products that help professionals manage credit risk or conduct credit analysis. The company's current capitalization exceeds $ 72 billion. It is worth mentioning that the largest shareholder is Buffett's investment vehicle - BERKSHIRE HATHAWAY INC, which holds over 13% of the company's shares.
| $ Million | 2017 | 2018 | 2019 | 2020 |
| revenues | 4 204 | 4 443 | 4 829 | 5 371 |
| Operational profit | 1 832 | 1 916 | 2 071 | 2 459 |
| Operating margin | 43,58% | 43,12% | 42,89% | 45,78% |
| Net profit | 1 101 | 1 310 | 1 422 | 1 778 |
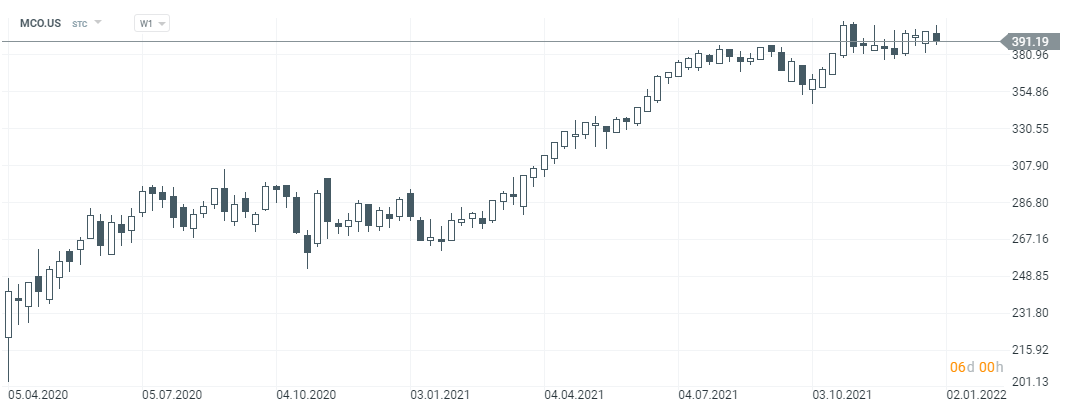
Moody, s Corporation chart, W1 interval. Source: xNUMX XTB.
factset
It is one of the companies providing tools for professional investors operating on the capital market. The company's solutions are used by sell-side and buy-side analysts and managers of investment funds and hedge funds. FactSet competes with companies such as Bloomberg, S&P Global and Thomson Reuters. All the mentioned companies try to provide extensive market information. The company tries to take over smaller suppliers of market data in order to expand the product offer. The current capitalization of the company is $ 18 billion.
| $ Million | 2018FY | 2019FY | 2020FY | 2021FY |
| revenues | 1 350,1 | 1 435,4 | 1 494,1 | 1 591,4 |
| Operational profit | 371,1 | 438,0 | 439,7 | 474,0 |
| Operating margin | 27,49% | 30,51% | 29,43% | 29,79% |
| Net profit | 267,1 | 352,8 | 372,9 | 399,6 |
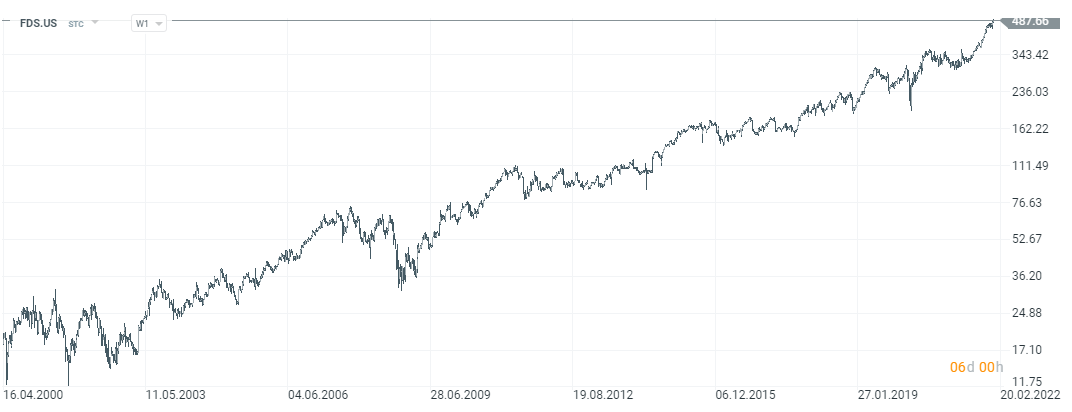
Factset chart, interval W1. Source: xNUMX XTB.
Verisk Analytics
The company was founded in 1971. It is one of the components of the S&P 500 index. The company provides data analysis and risk management services. The company's clients include companies operating in the insurance, mining and other financial sectors. The Verisk company serially takes over smaller competitors, which increases its market offer. For example, in 2015, Verisk acquired Wood Mackenzie, which provided data for companies from the chemical, mining and metallurgical industries, for $ 2,8 billion. Verisk's current capitalization is approximately $ 36 billion.
| $ Million | 2017 | 2018 | 2019 | 2020 |
| revenues | 2 145,2 | 2 395,1 | 2 607,1 | 2 784,6 |
| Operational profit | 808,0 | 835,6 | 831,1 | 1 020,9 |
| Operating margin | 37,67% | 34,89% | 31,88% | 36,66% |
| Net profit | 555,1 | 598,7 | 449,9 | 712,7 |
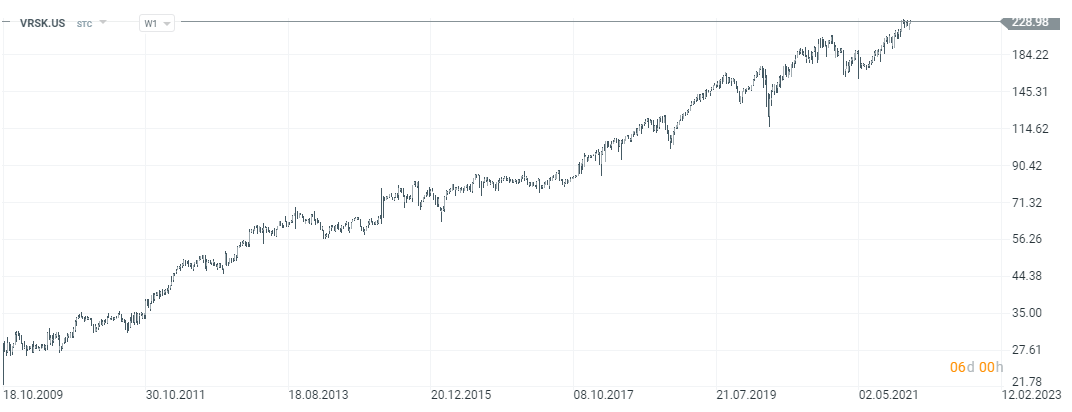
Verisk plot, interval W1. Source: xNUMX XTB.
Summation
The company has an interesting business model. It is very diversified, in addition to rating solutions, the S&P offer also provides indices, analytical tools and services for the raw materials market. It is a very profitable business. In the coming years, we can expect the continuation of share buyouts and a dividend payment, despite the takeover of IHS Markit. Currently, the company is valued at over $ 113 billion, which puts a P / E ratio for next year of around 34. This is an ambitious valuation and buyers should be aware of this. On the other hand, the company's revenues may grow by several percent annually and share purchases will accelerate the growth of the earnings per share (EPS) ratio.
It is worth mentioning the ratings that have the largest share of revenues. According to data collected by S&P Global Fixed Income Research from 2018, between 2020-2023 corporate debt worth $ 8,78 trillion was to roll over. Of course, this is old data, but it shows that S&P services will still be needed.
The rating segment is quite specific. One of the primary allegations regarding S&P Global's rating activities is a possible conflict of interest between investors and customers. On the one hand, clients reward S&P for preparing credit analyzes. On the other hand, investors expect an unbiased opinion on the financial condition of the analyzed entity. So how does the company try to avoid a conflict of interest? S&P has created a clear separation of duties between the credit analysis team and the customer service department. S&P customer service specialists deal with maintaining customer relationships, negotiating contracts and service price lists. However, they do not have access to decisions made in rating committees. It is also worth mentioning that the rating committees themselves make it possible to significantly reduce the risk associated with conducting a credit assessment. The role of the committee is to reject or accept the rating prepared by the analyst.
It happened that leading agencies were punished for not applying the highest standards when conducting credit assessments. The US Department of Justice (DoJ) several years ago sued S&P for $ 5 billion for giving the highest credit ratings to mortgage-backed instruments, even though the agency was aware of the risks involved in these instruments. The suit concerned matters from the years before the 2007-2009 crisis. Ultimately, in 2015, S&P paid $ 1,4 billion in fines for these practices. The subprime crisis has undermined the reputation of many rating agencies and prompted many governments to increase regulation of this market segment.
However, S&P Global is not only about ratings. In the coming years, there should be an inflow of capital to the asset management sector. This will increase the revenues of the index segment. This is because indices are used as benchmarks for both actively managed and passively managed funds (eg ETFs). S&P is one of the largest index providers in the world. For this reason, it will benefit from the society's getting richer trend.


