Trading Central indicators - the first test week is behind us

The first trading week is behind us, in which we check how they work and how useful they are indicators provided by Trading Central. After a few days, we have some comments and observations that we can share with you.
Be sure to read: Trading Central - Independent market analyzes [Review]
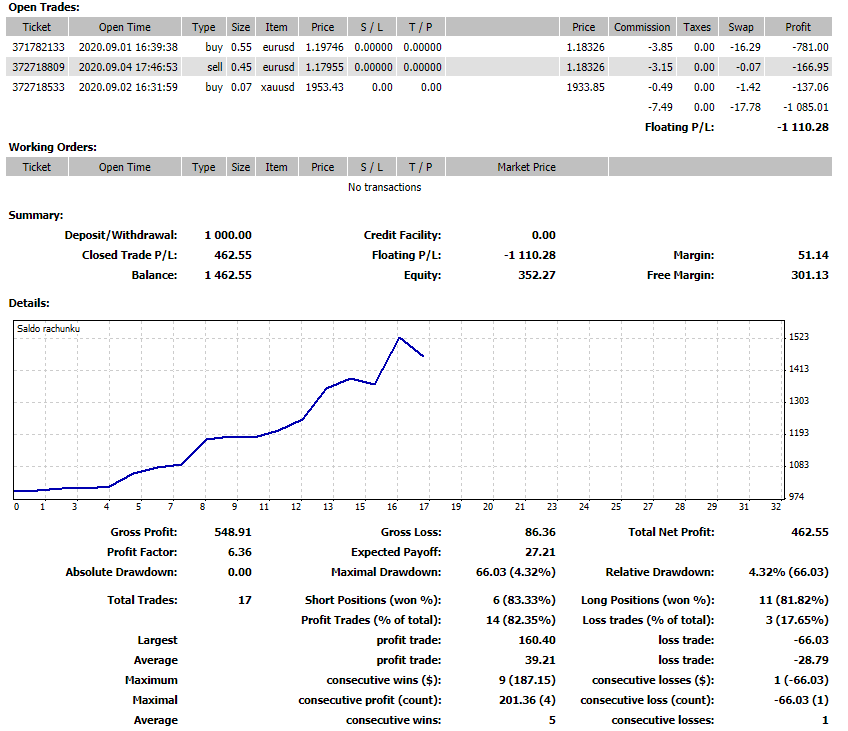
Last week we made 17 transactions, which translated into $ 462,55 profit. We have three more positions still active at a fairly large loss. It might seem that with five indicators, the number of signals to open new positions should be quite large. And yes - their number is considerable, but the signal strength is assessed as quite weak, and this carries a risk.
Trading Central Tools - first insights
The first problem is the large number of signals, especially at low time intervals - M1, M5 or M15. For examples, let's take a look at the M5 chart for the EUR / USD pair.
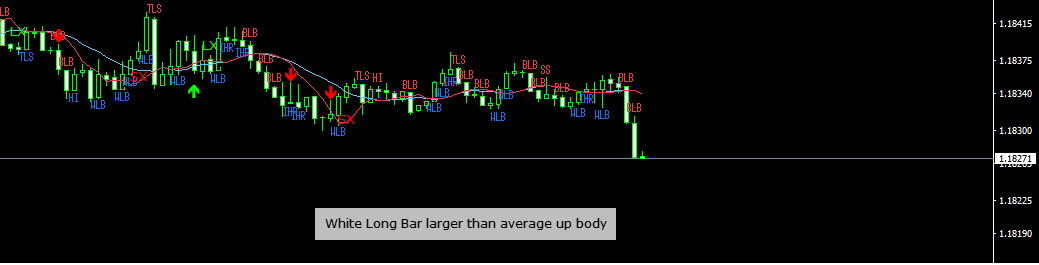
We see that the indicator that captures the candlestick patterns - Adaptive Candlesticks - and ADC Chart Price Marks - generate signals in large numbers. With low dynamics of movement, we get a signal that indicates a change of literally 2-3 pips. It is not an attractive offer and the risk is quite significant in the event of a change in the price direction. This is how we fell into the trap of having three active negative positions.
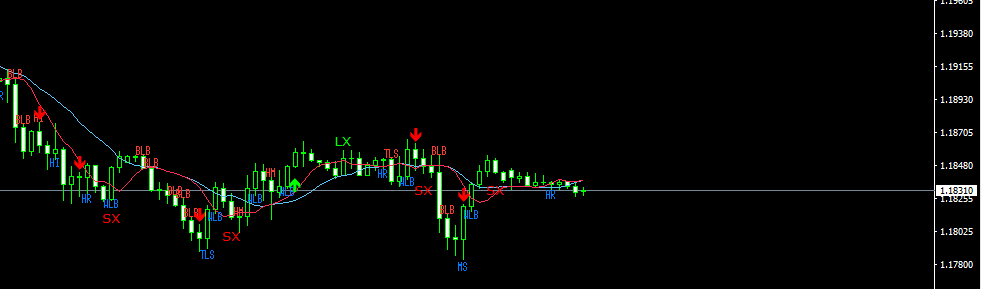
Looking analogically at the H1 chart, we can see that the indications are much more readable. In addition, in this case, we can already count on a move of 20 to even 50 pips.
Next comments
Another problem is the oscillators ADC Raw + Smooth and ADC SLOW / FAST OSCILLATORS + AFILTER. One of them is slow, the other reacts much faster. These two variants are intended to aid decision making in both long-term trading and in much shorter time frames. Unfortunately, both seem to react very slowly. Only ADC Fast Fast Oscillators + AFilter efficiently draws the top and bottom. The second, however, needs a really extreme move to indicate the moment of buying or selling a given item.
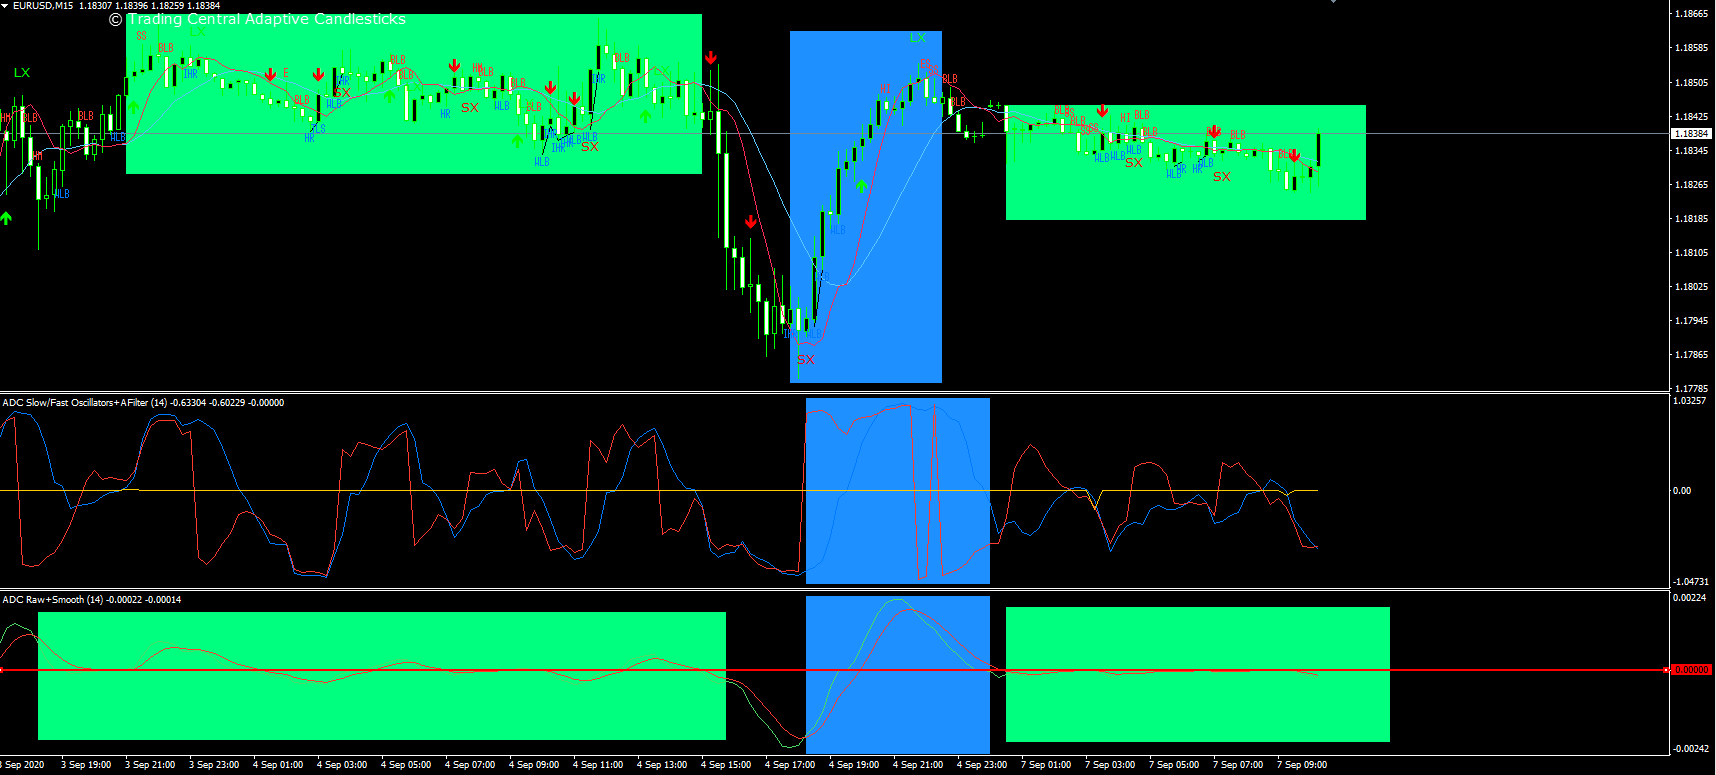
Action example ADC Raw + Smooth and ADC SLOW / FAST OSCILLATORS + AFILTER. EUR / USD chart, M15 interval. Source: MetaTrader 4, IC Markets.
We can see that the natural environment of the reviewed indicators from Trading Central are higher time intervals. Here we present the H4 time frame. As you can see, we finally have clearly shown highs and lows that are reflected in the chart.
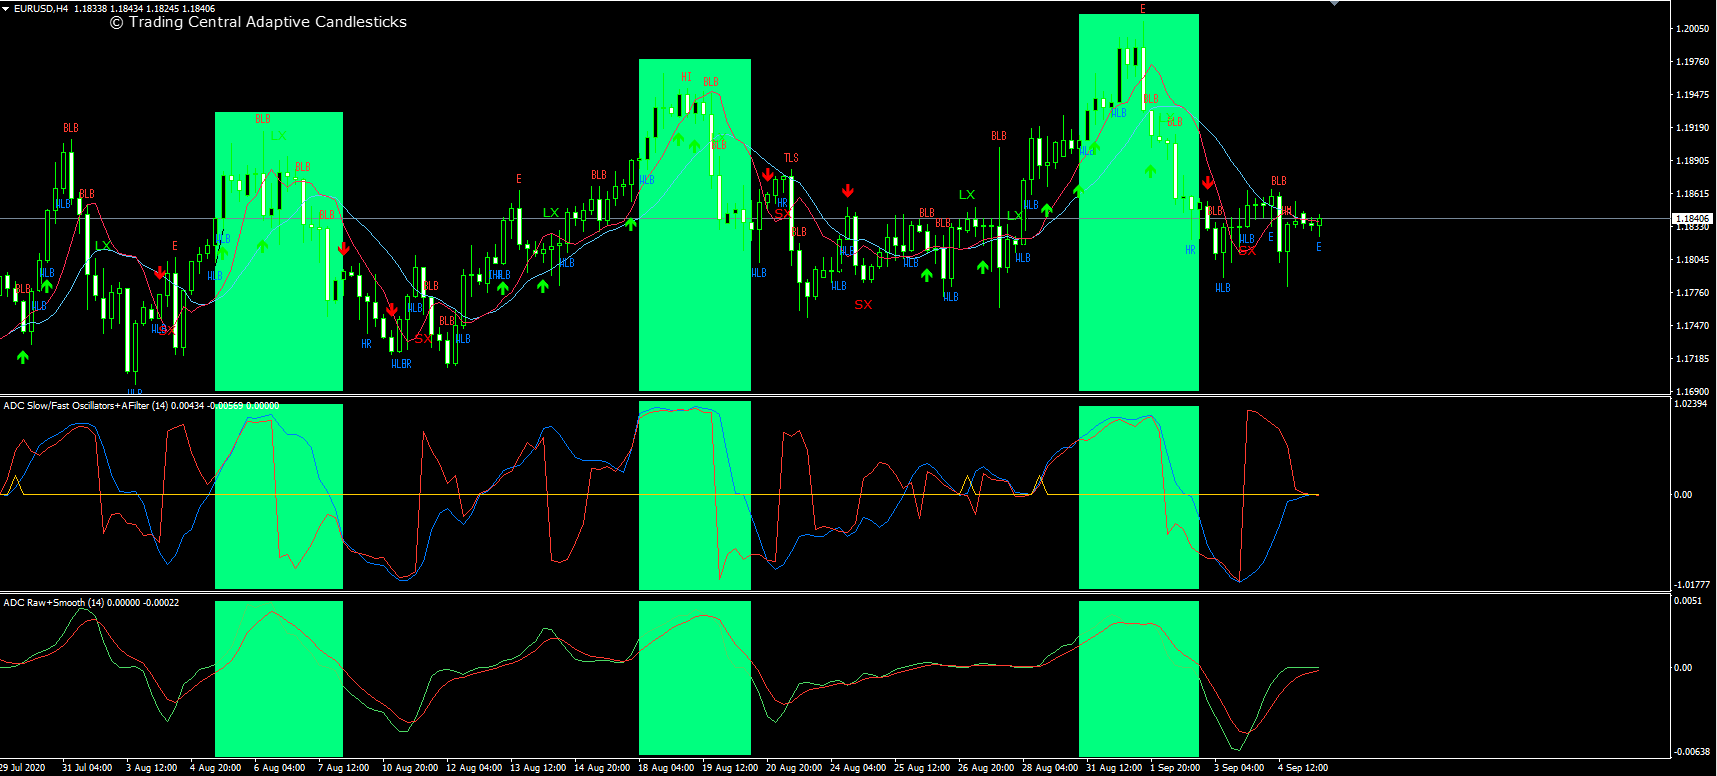
Action example ADC Raw + Smooth and ADC SLOW / FAST OSCILLATORS + AFILTER. EUR / USD chart, H4 interval. Source: MetaTrader 4, IC Markets.
Finally, the indicator Views Analyst - key support and resistance levels are well marked and are kept up to date.
Summation
The first week of the test showed the strengths and weaknesses of the verified indicators. It's good that there are stumbling blocks and losing positions, because that's the only way to learn lessons and avoid mistakes in the future. For now, our account balance is in the black, but looking at Equity, we are afraid of overdue, losing transactions.
Account balance:
- Completed 17 items including 15 profitable and 2 lossy,
- Instruments: EUR / USD, USD / CAD, XAU / USD,
- $ 462,55 realized profit,
- 3 active positions on a total loss of -1110,28 USD.