


How to understand any market? - Useful techniques and tips [part 1]

It happens that traders often change their approach to trade, because they simply do not have the conviction what the market works and what does not. They are constantly looking for a way to effectively analyze charts, using all possible tools. Unfortunately, this type of approach, i.e. jumping at different time intervals, constant change of techniques, usually do not bring the expected results. The basis is consistency. In this article, we'll introduce ways to make it easier to understand the market and find your way in investing. It is also very important that you do not have to use them at the same time to be successful and earn regularly. It is worth analyzing all the methods, and then choose 2-3, sometimes even one that will best suit a particular trading style.
Support and resistance
We start with the technique that is obvious to many, but correct determination of support and resistance levels can really have a very positive impact on trading. The basic mistake we make here is drawing too many zones. Instead of setting more and more levels, often only a few pips away, it is worth focusing on "quality". Simplicity can often be the best solution, do not forget about it. For analysis, it is always worth using only the latest price action, without going back significantly. The main thing is to focus on levels close to the current price of a given item and not obsessively responding to every, even the smallest change.
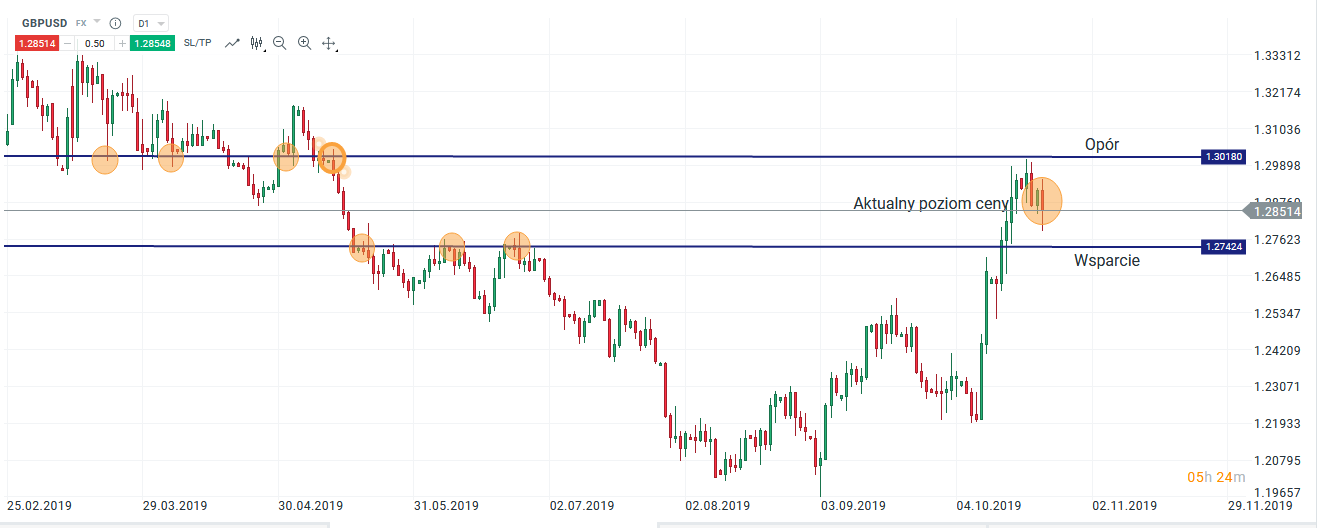
Support and resistance. Chart GBP / USD, D1 interval. Source: xNUMX XTB xStation
Tops and holes
Awareness of peaks and holes can be crucial for many reasons. First of all, almost every trader observes them, regardless of whether they are trading strictly based on technology or foundations. Financial media, industry portals, also often refer to important peaks and holes. The second important fact may be that investors often use tops and holes to determine the level of entry into a position, especially in trading techniques based on breaking games or following the trend. Also orders stop loss and take profit, as a rule, they are accumulated in the areas of the next peak or lower hole. If you are a trader who can interpret them well, you avoid thinking in a traditional way, which gives you a big advantage in trading.
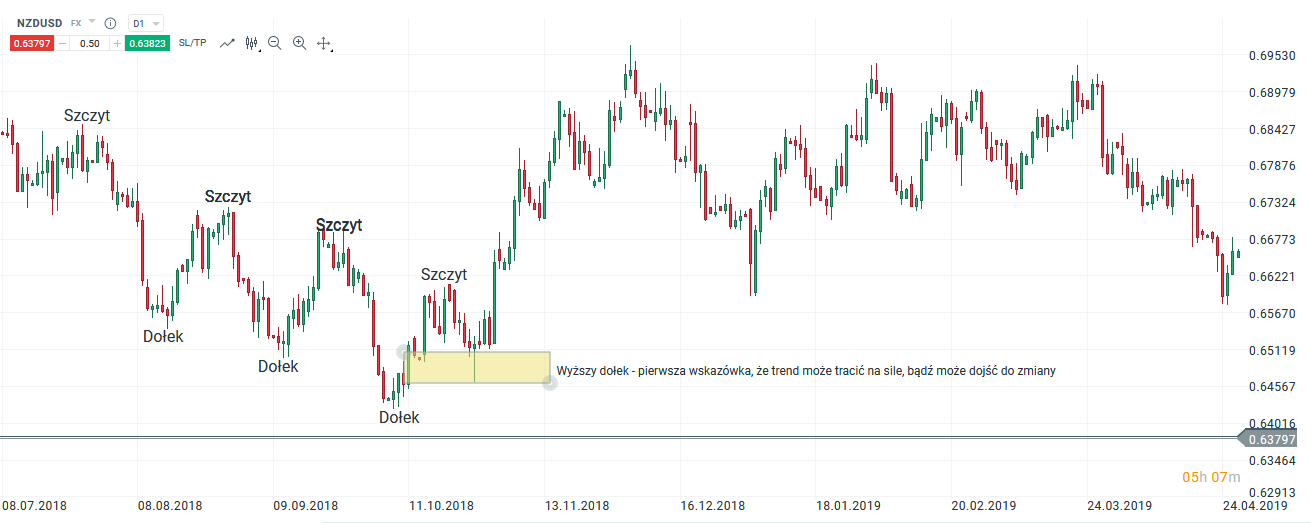
Tops and holes. Chart NZD / USD, D1 interval. Source: xNUMX XTB xStation
Be sure to read: Take Profit and Stop Loss - static or dynamic?
Channels and trend lines
Channels and lines are a technique similar to support and resistance, with the difference that they are components of many technical formations, such as wedges or triangles. Trend lines can be an interesting addition if we use them strictly to analyze the strength of the trend. Drawing a given line, we can see how strong it rises or falls. If the price bounces off it, it is not able to break it, move away from it, then there may also be valuable tips for the trader. Breaking out may indicate a new direction, especially when the price does not continue in line with the previous sentiment.
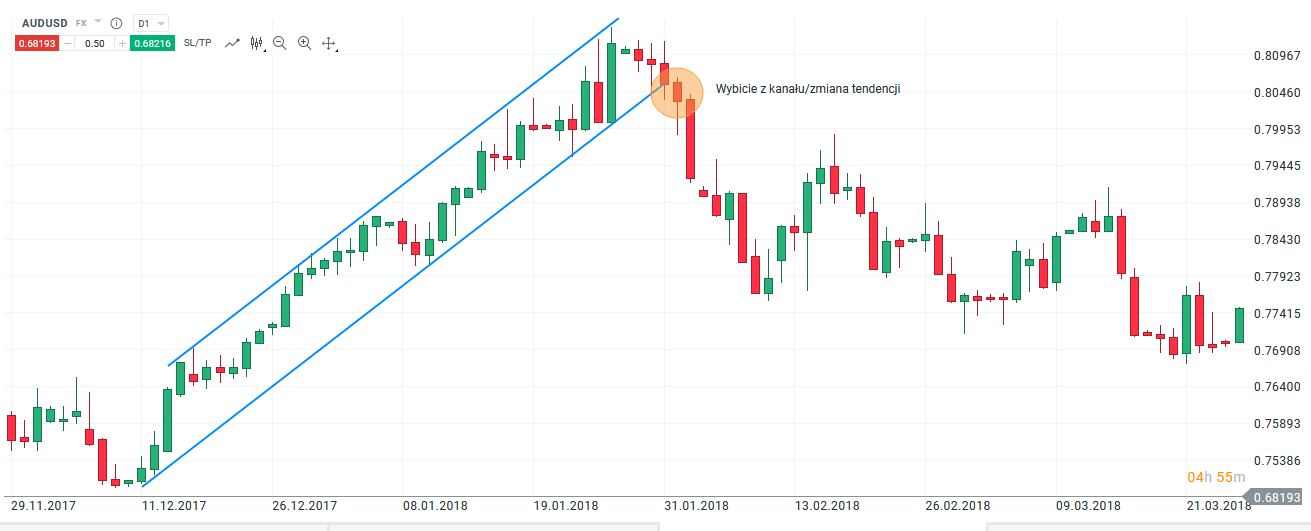
Channels and trend lines. Chart AUD / USD, D1 interval. Source: xNUMX XTB xStation
Time interval
Traders have always divided issues regarding the choice of a particular interval. One group prefers higher TF, the other lower and typical daytrading, or even scalping. It is very important, especially at the beginning of your path in investing, to try to determine which interval suits you best. This is undoubtedly very difficult because we do not yet fully know our trade preferences.
Be sure to read: We choose the trading time interval
If we usually trade, e.g. based on the h4 chart, it is worth starting the analysis with a daily chart, which will show us a broader perspective. What looks like a strong trend at one interval can be a simple consolidation at another, which is why choosing the right TF is so important. You should also be aware that using more than one interval, sometimes it is easier to see some key levels that we can overlook using only one
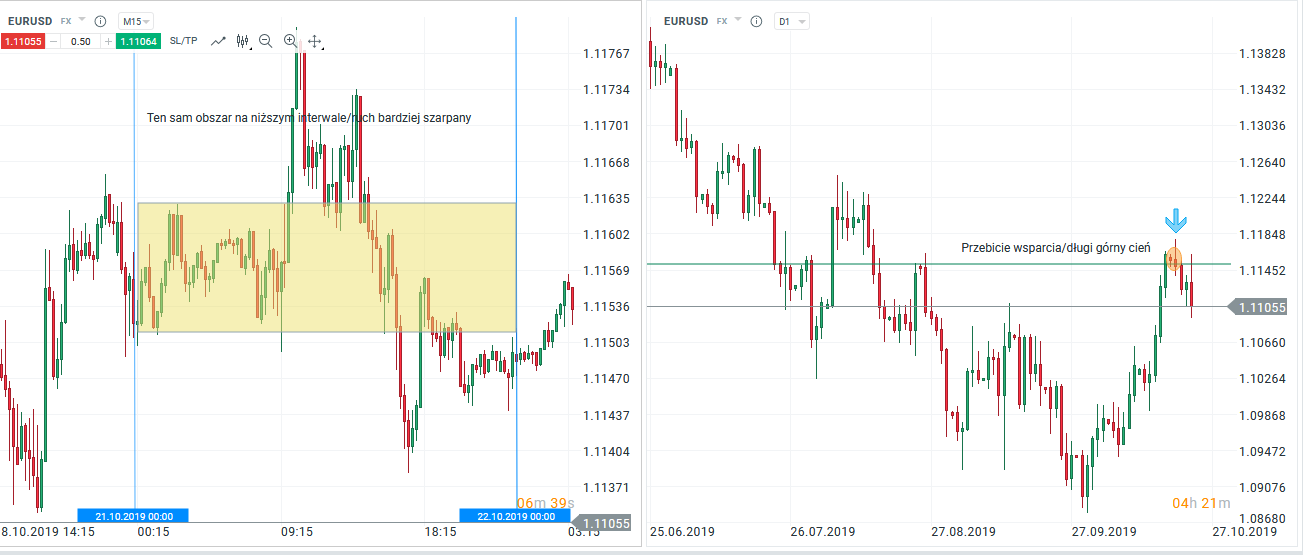
Time interval. Chart EUR / USD, M15 and D1 interval. Source: xNUMX XTB xStation


