


Key types of support and resistance - part II

In the first part we discussed how to use classic swings from the point of view of support and resistance. In Part 2, we'll look at the next types of levels that can also be successfully used in daily trading and price analysis. In this article we will present dynamic support and resistance based on Fibonacci levels.
Be sure to read: Key types of support and resistance - part I
Dynamic support and resistance
Wanting to use dynamic support and resistance ("dynamic" in this context, it simply means floating) in our trade, we must find some "determinant" that will help us draw these dynamic levels along with subsequent price movements. When drawing, for example, a line marking a specific level, we have typical support or static resistance.
So what allows you to determine the dynamic level? This can be e.g. a properly configured moving average. Average just like the price move up or down. Depending on what the price does on the chart, we can set them to include e.g. a certain number of candles or time periods. Moving averages, and hence the dynamic support or resistance level determined on their basis will be best suited to the markets trendy joins to specific traffic. We observe price and average tests both after breaking above and below and on this basis we search for opportunities to enter. Of course, it is best to use typically such a moving level to continue the movement. Unfortunately, in consolidation such dynamic levels determined on the basis of averages may no longer work as well, because, as we know, a price that moves within ranges tends to excessively cut the averages, which could generate many so-called forgeries.
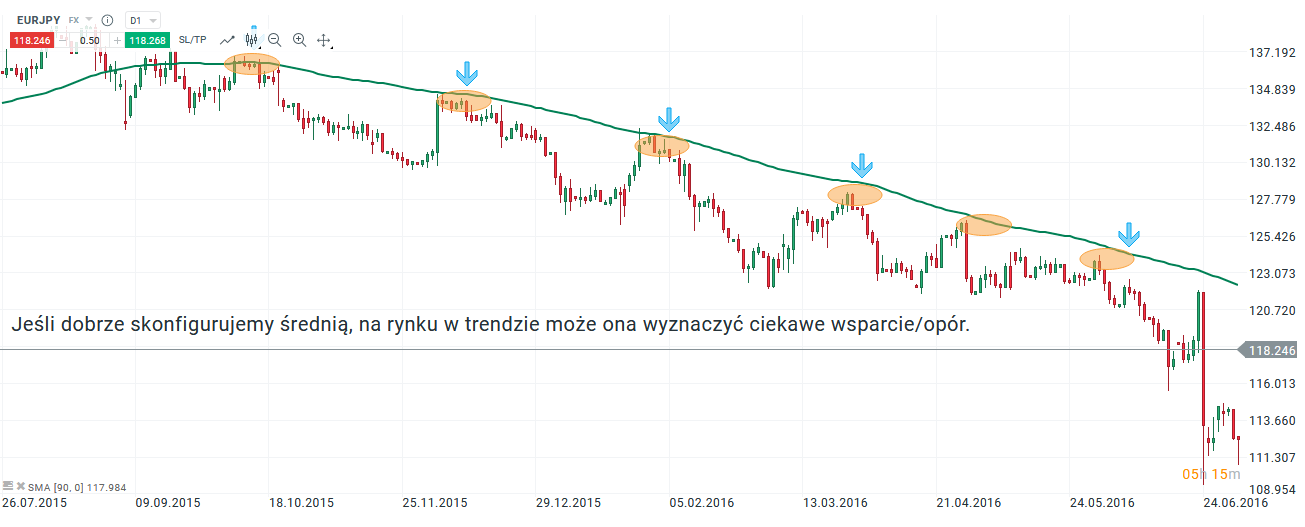
An example of a dynamic resistance level based on an average. Chart EUR / JPY, D1 interval. Source: xNUMX XTB xStation
Support and resistance as a Fibo level
Of course, we don't discover America here, many traders using Fibonacci levels to set some key levels of support or resistance. There is no better or worse level. The most popular ones such as 38,2% or 61,% can be used successfully. Especially the second level, I use it quite often in my everyday trade. However, I would like to mention here a certain relationship that can often be seen on the market. Namely about the phenomenon of so-called 50% unbearable (which, in fact, is not "Natural" Fibo level). If the market makes a big move (swing), often the opposite move tolerates it exactly in 50%. Some call it normal market dynamics.
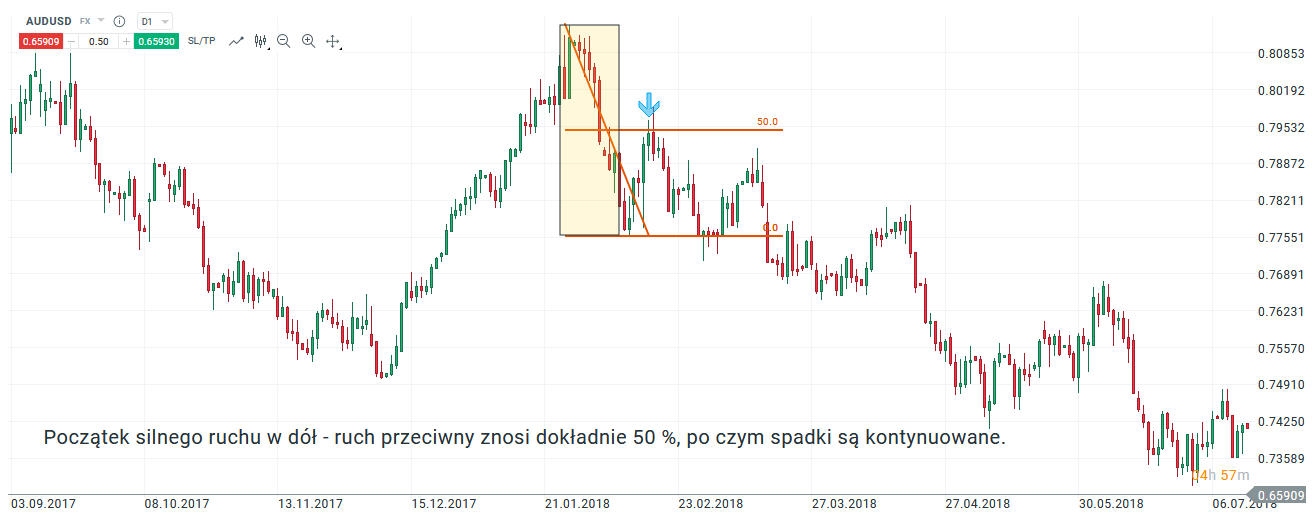
50% abolition. Chart AUD / USD, D1 interval. Source: xNUMX XTB xStation
Summation
In two articles we told each other the most important types of support and resistance. Of course, you can still break down individual types into subgroups almost indefinitely. Here, however, we focused on transparency and simplicity, because as everyone knows, it is these simplest solutions that work best. Good luck!


