


Bollinger Bands - how to use the indicator in everyday trading

For many traders, the Bollinger band is considered one of the most useful indicators for trade. It can be used both to read the market, the strength of a given trend, as well as to plan to enter positions in consolidation periods, and to find potential peaks and holes. It is included in dynamic indicators, which means that it adapts to changing market conditions and is deprived of so-called "Delays" that characterizes most of the popular indicators.
In this article, we'll provide you with some tips to help you use the Bollinger banner in everyday trading.
Be sure to read: Boom and Bust formation - unchangeable market law
General assumptions
The Bollinger Bands are nothing more than some sort of price channels, plotted below and above the price level. As for the external ribbons, they are based directly on the price volatility, which means that if we are dealing with the strengthening of the trend, the webs are expanding. However, when the trend weakens, we have consolidation. When the low momentum is observed, the ribbons shrink.
Inside the outer bands there is 20-periodic moving average, which complements the indicator. The default web setting is characterized by a standard deviation at the 2,0 level. It is, however, worth a closer look at this parameter and adapt it to your trading style. By slightly increasing the level of deviation, the webs will become wider and capture more price actions. The level of deviation at the level 2,5 or greater causes that almost all price movements are contained between the outer ribbons, which means that if there is a permanent break of one of the bands, it will be a very strong signal.
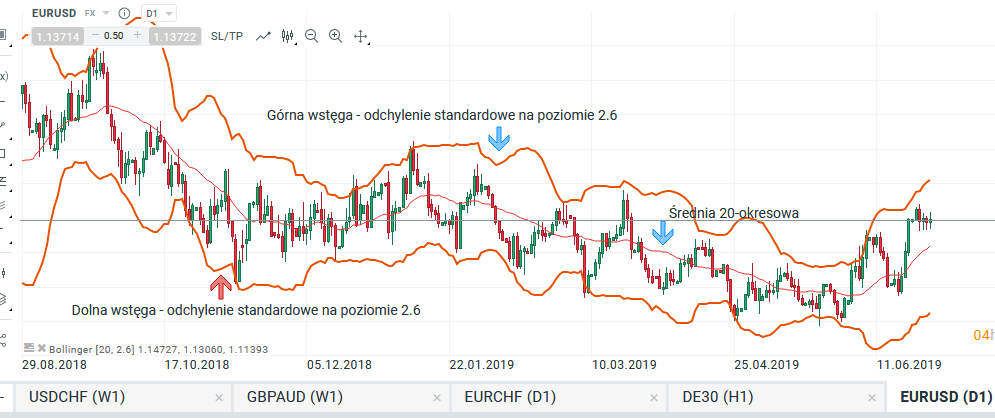
Bollinger band with a larger range of standard deviation, EURUSD, D1. Source: xNUMX XTB xStation
Bollinger bands in everyday trading
The undoubted advantage of the indicator is that it is not so-called a static indicator and changes its shape based on recent price movements and current market momentum. Thanks to this, we can use the ribbon to analyze the trend strength as well as find key peaks and holes. When it comes to analyzing the strength of the trend, in particular it is worth remembering the following assumptions:
- during strong trends, the price very often stays close to the outer ribbons,
- repeated attempts to approach the price of the outer band, which are unsuccessful, testify to the lack of trend strength,
- if we are dealing with the continuation of the trend and the price moves back from the outer band, it is a sign of a drop in momentum,
- if it breaks through the average price, it may be a sign of the end of the trend.
Below are some examples of how to read information from the indicator. In the chart below, we can see how the price moves in a downward trend. The price oscillates all the time at the lower outer band - a very bearish signal.
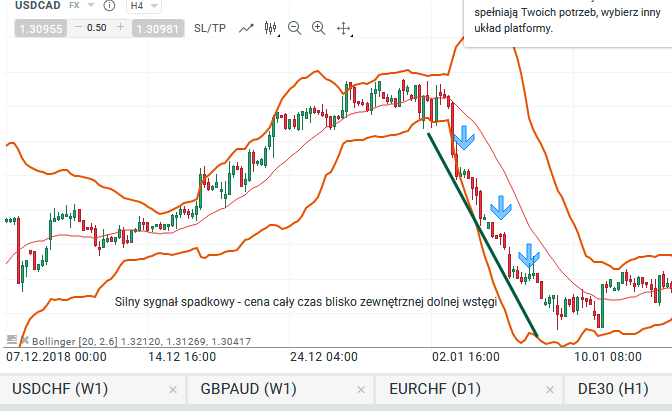
A downward signal based on the Bollinger band, USDCAD H4. Source: xNUMX XTB xStation
Another example is the approach of the price to the outer top band. The first peak reaches the ribbon, the next approaches are unsuccessful, the price stops earlier - a sign of a weakening trend.
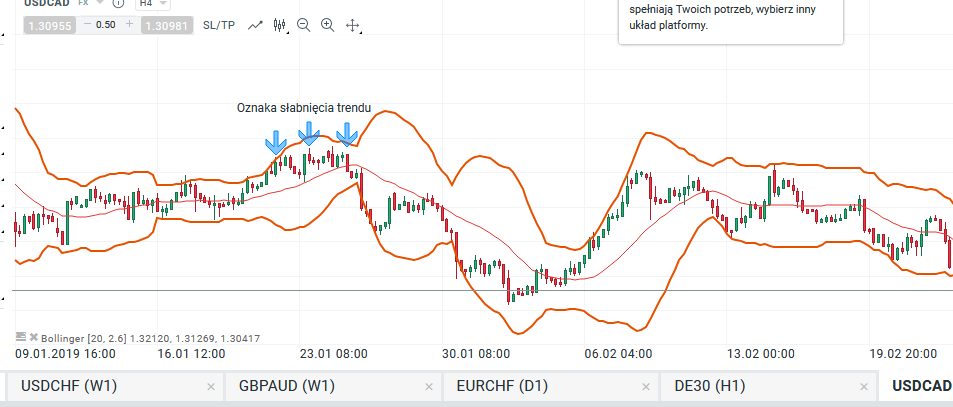
A sign of a weakening trend, USDCAD H4. Source: xNUMX XTB xStation
In this example, we see that the price does not reach the outer bottom band, we have a break above the average, and the price reaches the outer top band, at which the price oscillates longer time - strong bullish signal.

Strong growth signal based on the Bollinger band, USDCAD H4. Source: xNUMX XTB xStation
It is important to set the standard deviation correctly when using the gauge to determine peaks and lows. As I wrote in the introduction - the key is to adjust the parameter to our investing style. If the variance is greater than 2,5 / 2,6, then you can see that the price hits the outer bands less frequently. If we have a real handle, it makes such a signal very important as we automatically have an indication of an important price extremum.
The last parameter of the indicator is the moving average, contained between the outer bands. During strong trends, the average usually holds the price well and does not break it. The signal of a change in sentiment may be the breaking of the average by the price. We can also use the average for, for example, getting out of the position in case of breaking.
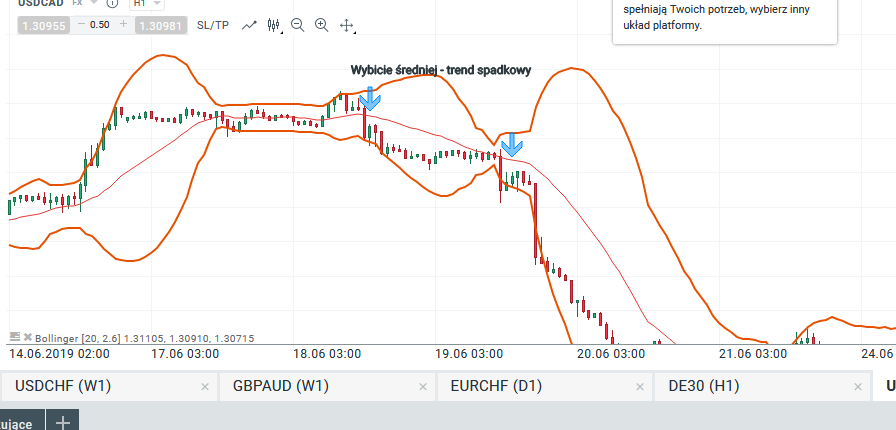
Breaking average by price, downward trend, USDCAD H1. Source: xNUMX XTB xStation


Leave a Response