


Boom and Bust formation - unchangeable market law

Very often investors, especially at the beginning of their way with trading, touch the phenomenon "Struggle" with the market. At all costs, they try to catch the peaks, the holes, predict future price movements. To relate to repeatable successes on the market, it is necessary to know certain laws that govern this market. It is also important to realize how important the role of psychology plays in all of this. In this article, we will look at the formation, which is considered by many to be more than just the arrangement of individual candles. It is a law that describes in a good way how traders move the market and how psychology manifests itself in particular price movements - namely formation Boom and Bust.
Be sure to read: Determining the trend direction - Victor Sperandeo method
Basics of formation Boom and Bust
At the beginning, let's start by explaining what the formation is really about. As the name suggests, it consists of two parts. The first part is tree, in other words, strong growth. After the growth follows bust, or an equally strong price drop. Formation is best suited to identifying the end of a trend, or when playing a reversal of a given trend movement. As for the so-called ideal formation, certain assumptions should be met. At the initial stage, the trend should be relatively slow and moderate. After the second phase, there should be a strong increase in momentum and acceleration of the whole trend movement - trend lines have a more sharp angle. The next step is the occurrence of a specific technical formation. Often also at this stage, we can find confirmation in the indicators, eg in the form of divergence. The last stage is the end of the boom or growth movement, after which we deal with the bust, or a sharp drop in the price.
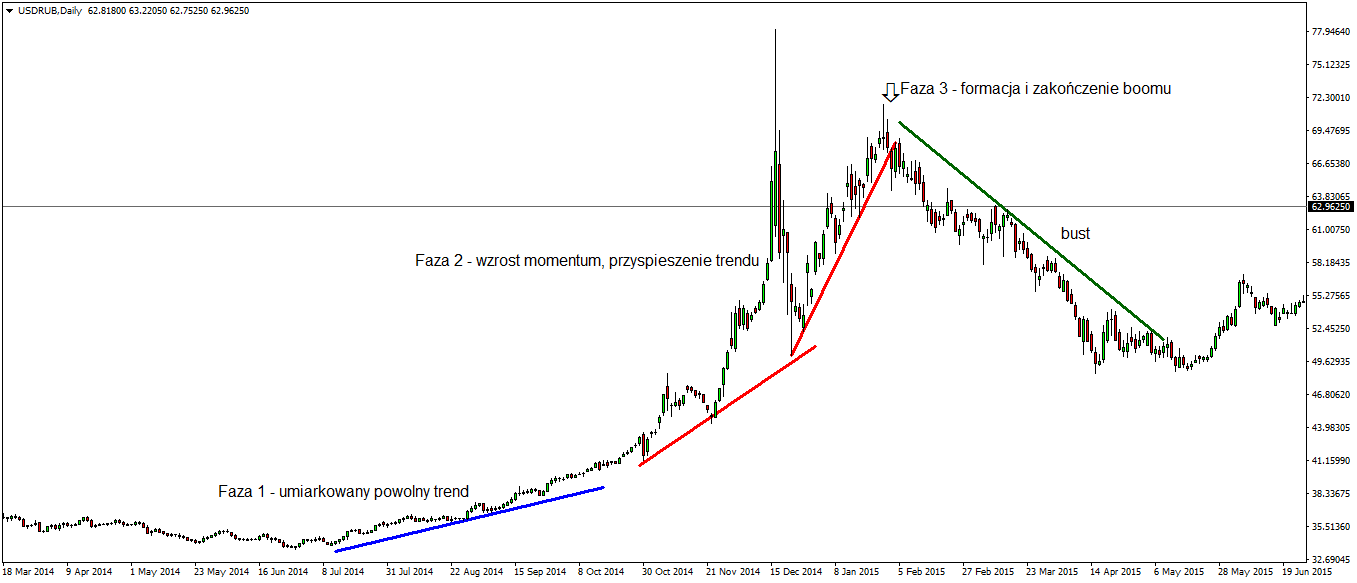
Example of Boom and Bust formation, USDRUB chart D1 interval. Source: MetaTrader 4
Crowd psychology - upward and downward trend
It is very important to understand that prices move differently in upward and downward trends. Many investors do not pay attention to such assumptions, treating sharp rallies and price congresses in the same way. Professional investing involves learning about the current market environment and adjusting your approach to a given price movement. Formation Boom and Bust it works best in upward trends. It results from the fact that if we deal with the so-called with speculative bubbles, as a rule, the movement begins slowly and gradually takes on greater momentum. If the rally was strong, the traders' beliefs also. After strong traffic, the so-called. panic, or the title one bustit will also be extremely powerful.
Measuring formation
To identify tree, it is not necessary to use only trend lines. The other indicators perform very well in this type of formation as well. You can use the Bollinger ribbon for example. if the price is outside the outer band of the indicator, and the trend is characterized by high momentum (big candles, high Stochastica value), very often this kind of movement can be classified as a boom.
Playing the formation Boom and Bust
The biggest problem with this formation is that rallies prices in periods boom they can last a very long time. Of course, every bubble, sooner or later, it breaks. However, short positions with extreme movements should generally be avoided.
Here are some tips to help you play the formation:
- Avoid big speculative bubbles - the key here can be choosing the right time interval. A sensible compromise between large movements on D1 or W1 charts and small intervals can be a H chart.
- Czekaj for clear signs of reversing traffic - the key here is to recognize at which moment we are dealing with the momentum slow down and the change in the direction of the price. A good confirmation may be divergence on indicators, certain technical formations, such as a double peak / bottom, and a false zone breakout. As far as indicators are concerned, Bollinger bands and medium are good.
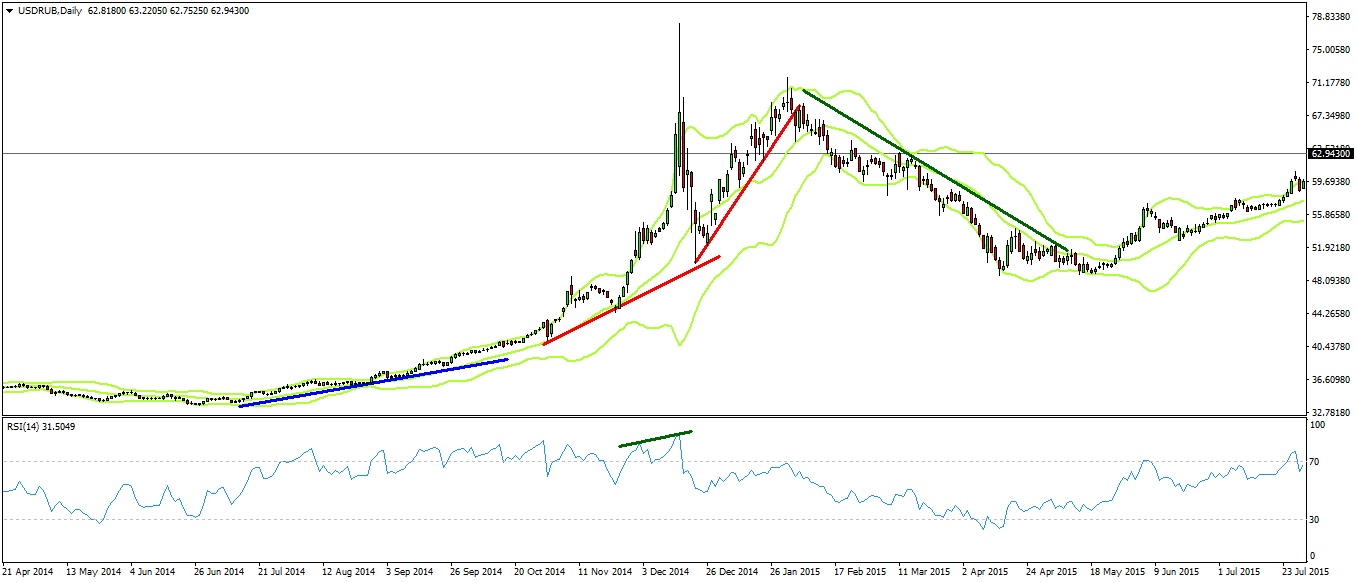
Application of indicators in the Boom and Bust formation, USDRUB D1 chart. Source: MetaTrader 4
Look for your advantage - if you are a trader who plays especially to reverse the movement, it is good to have a specific plan. The most important thing is to have a specific scenario for a given boom / trend movement, select appropriate confirmation tools, specify the place of entry into the reversal transaction, and the moment of departure if the target for the position is not reached.


