


On the trading platform xNUMX xStation a new indicator hit - Accumulation / distribution density. XTB Together with Mieczysław Siudek, together with Mieczysław Siudek, he created a tool that indicates the potential turning points on the market, based on the analysis of price and volume.
Be sure to read: Investment course with Mieczysław Siudek [REVIEW]
How it works Accumulation / distribution density
The indicator shows candles, whose ratio of the number of transactions (or volume) to the price of the price movement was disproportionately high, which may signal a change in the trend.
signals:
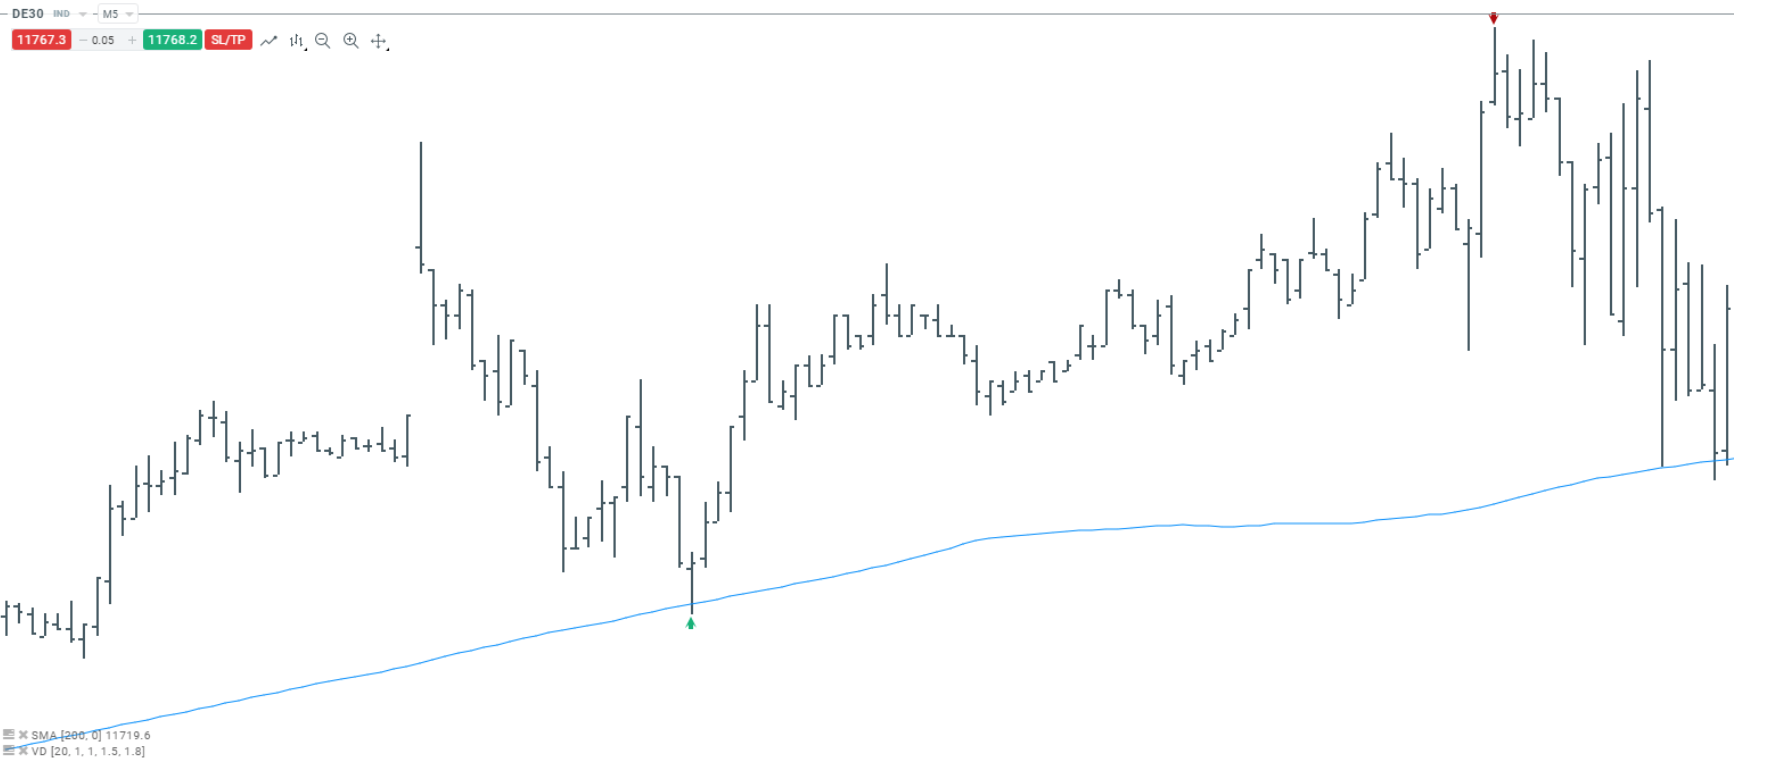
- Red arrow - means "Distribution density" and a potential downward signal.
- Green arrow - shows "Density of accumulation" and potential increase signal.
To add a pointer, just click on the button in the menu on the left side of the chart "F (x)" and enter "Vd" and/ or "Accumulation / distribution density".
Check it out: Volume stacked on the xStation platform
Indicator settings
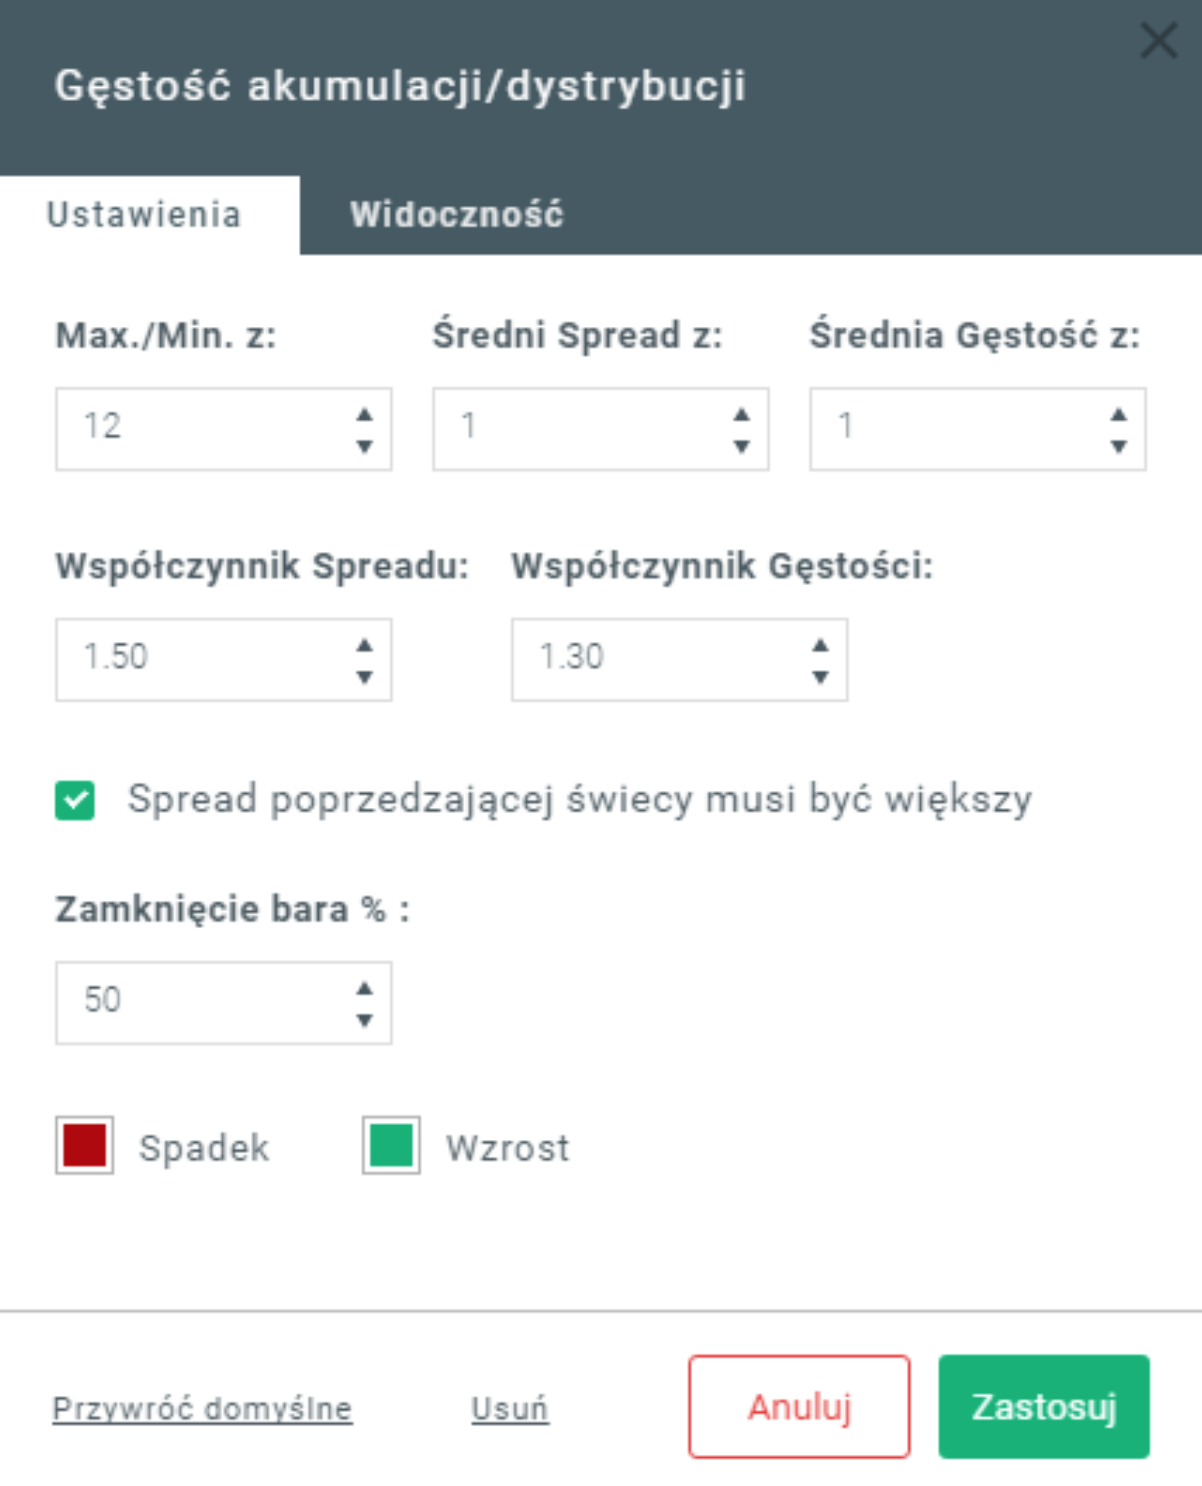
The indicator allows you to configure parameters, allowing you to adjust it to a specific time interval and investment strategy.
-
Accumulation / distribution density
Max. Min. From - determines the number of candles for which the top or bottom is created (i.e. for parameter 10 - the price must be the minimum or maximum of ten candles).
- Average Spread with - average amplitude value of candles from X periods (peak to low value).
- Average Density from - average density value from X candles (the density shows the intensity of the number of orders per pip).
- Spread ratio - indicates the proportion by how much larger the current candle can be than the average size candles for a signal to appear. The greater the value of the coefficient, the more frequently signals will appear.
- Density factor - indicates how much more than the average value of the last X candles, there must be more orders / volume per pip (the lower the ratio, the more often signals will appear).
- Closing the bar - shows how high the candle must close for a signal to occur (in the example below it must be 50% of the height of the entire candle). Thanks to this parameter, we can reject signals where there was no reaction price opposite to the movement.
- spread - in this nomenclature, it means the height of the candle measured from the maximum price to the minimum price.
Exemplary parameters of the indicator depending on the interval
Interval M5 - M30
|
Max./min. with |
20 |
|
Average Spread with |
1-2 |
|
Average Density from |
1-2 |
|
Spread ratio |
1,4 |
|
Density factor |
1,7 – 2,0 |
|
Bar closing |
Present in several = 50% |

Source: 5 xStation, DE30 M5 chart.
Interval H1 - D1
|
Max / Min from |
10 – 20 |
|
Average Spread with |
1 – 2 |
|
Average Density from |
1-2 |
|
Spread ratio |
1,4 – 1,5 |
|
Density factor |
1,2 – 1,4 |
|
Bar closing |
Present in several = 50% |
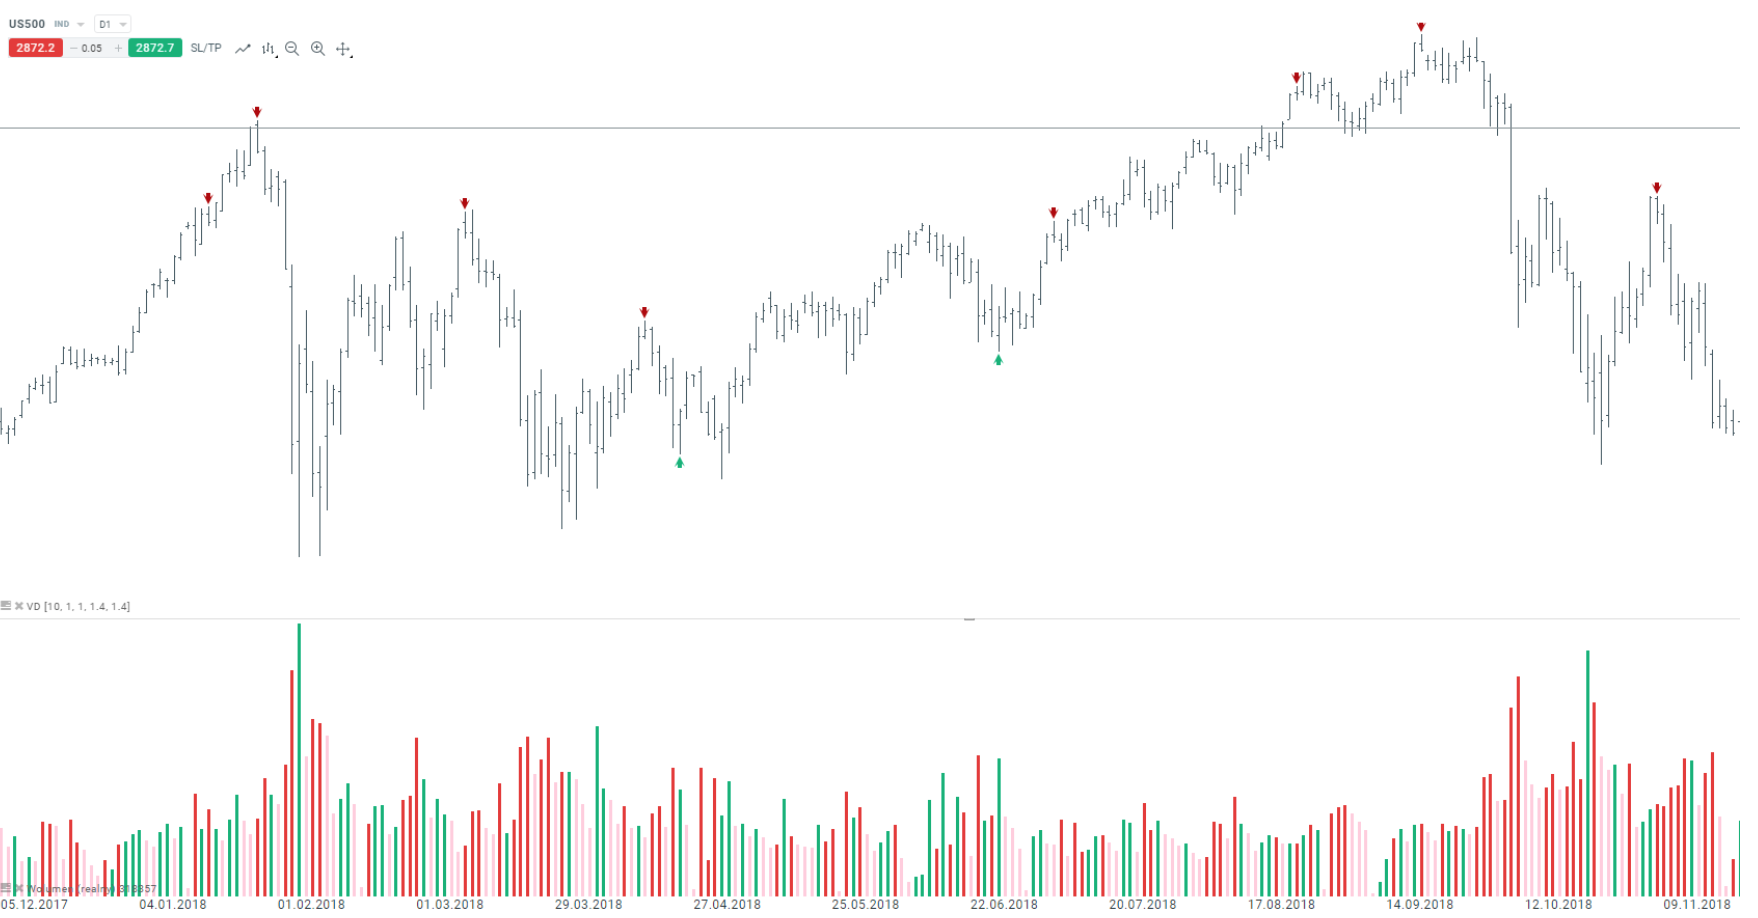
Source: 5 xStation, US500 D1 chart
It should be remembered that the indicator presents the largest value when it is applied in the appropriate market context:
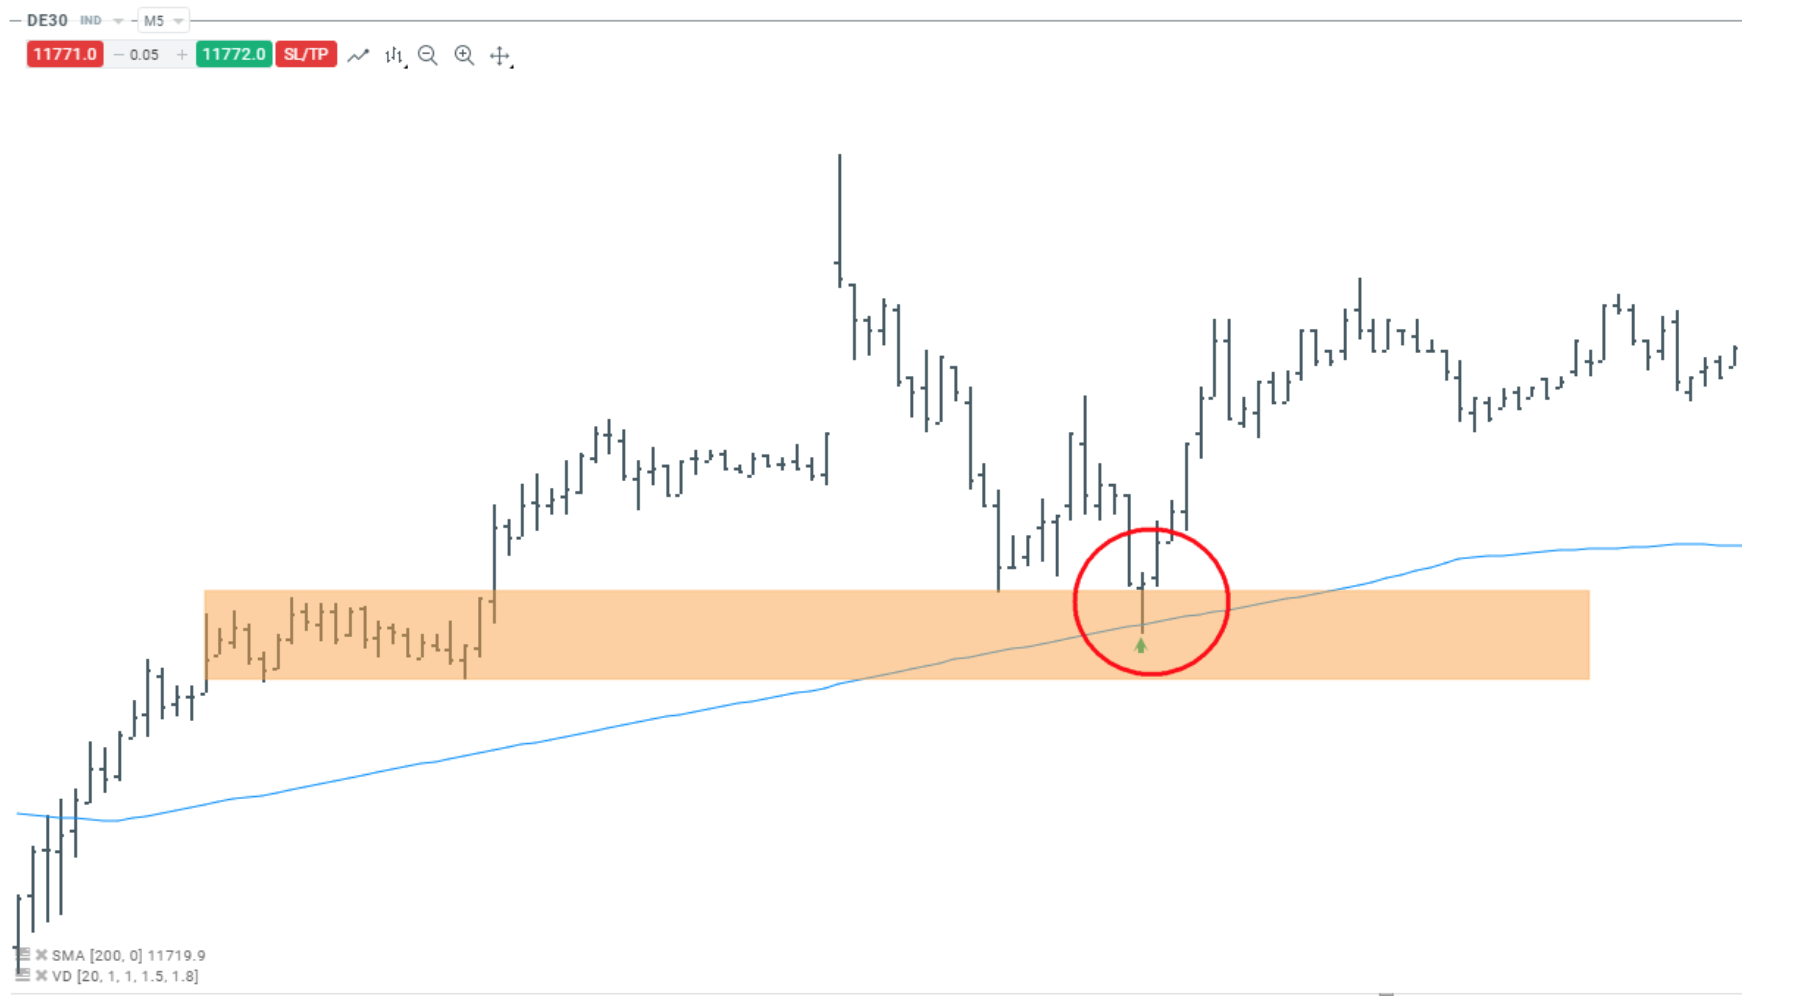
Source: 5 xStation, DE30 M5 chart.
In the example above, the price comes to the demand level, where it additionally reflects the average SMA 200. The buy signal appears at the key price level.
The indicator is available in demo accounts only until the end of this week, later only people with will have access to it real bill.
TEST THE XSTATION 5.0 PLATFORM
CFDs are complex instruments and involve a high risk of a quick loss of cash due to leverage. 80% of retail investors' accounts record losses as a result of trading CFDs at this supplier. Think about whether you understand how CFDs work and whether you can afford a high risk of losing money.
The content presented in this report is for information and educational purposes only. All opinions, analyzes, valuations and presented materials do not constitute an investment advisory service or general recommendation within the meaning of the Act of 29 July 2005 on trading in financial instruments. X-Trade Brokers DM SA does not bear any responsibility for decisions taken on their basis, nor for potentially incurred damages or profits, which may result from direct or indirect use of the above information.
It should be remembered that information and research based on historical data or results do not guarantee profits in the future.
, 00:XNUMX - Cumulative Volume, Tomasz Rozmus")


